. 2021 Oct 26;11(1):21048.
doi: 10.1038/s41598-021-99887-5.

A subpopulation of arenavirus nucleoprotein localizes to mitochondria

Affiliations

A subpopulation of arenavirus nucleoprotein localizes to mitochondria

Francesca Baggio et al. Sci Rep. .

Abstract

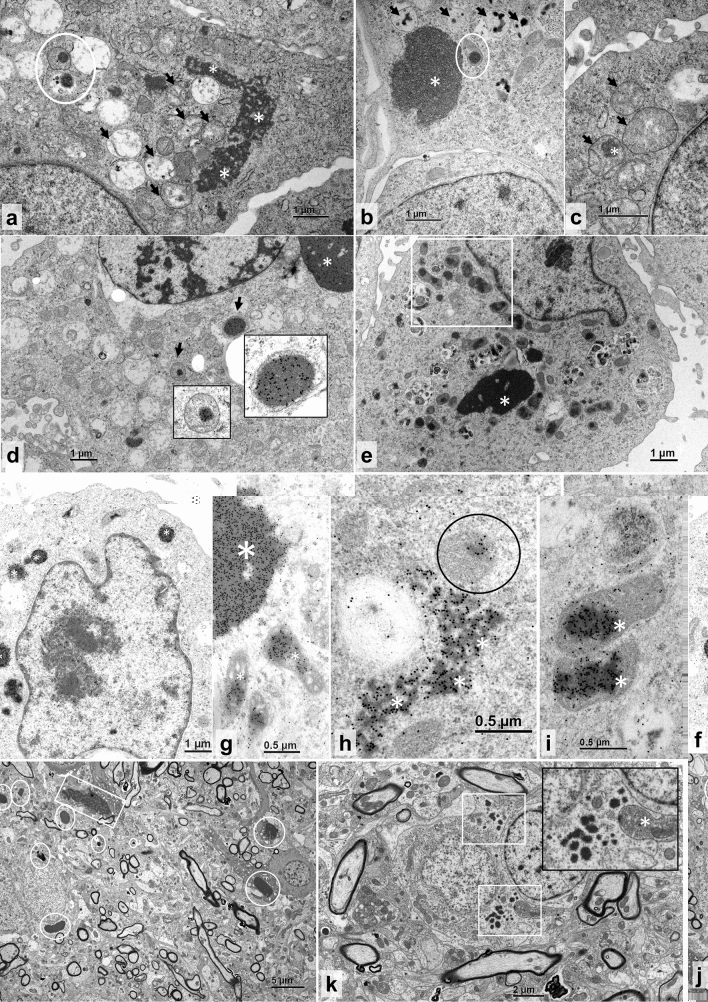
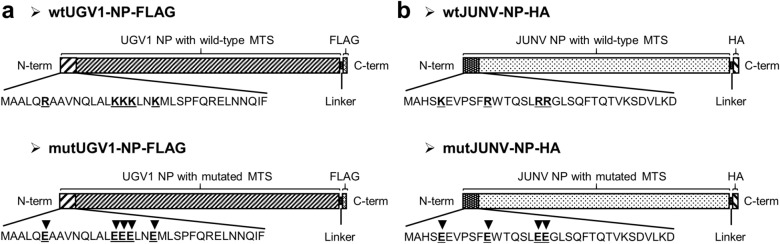
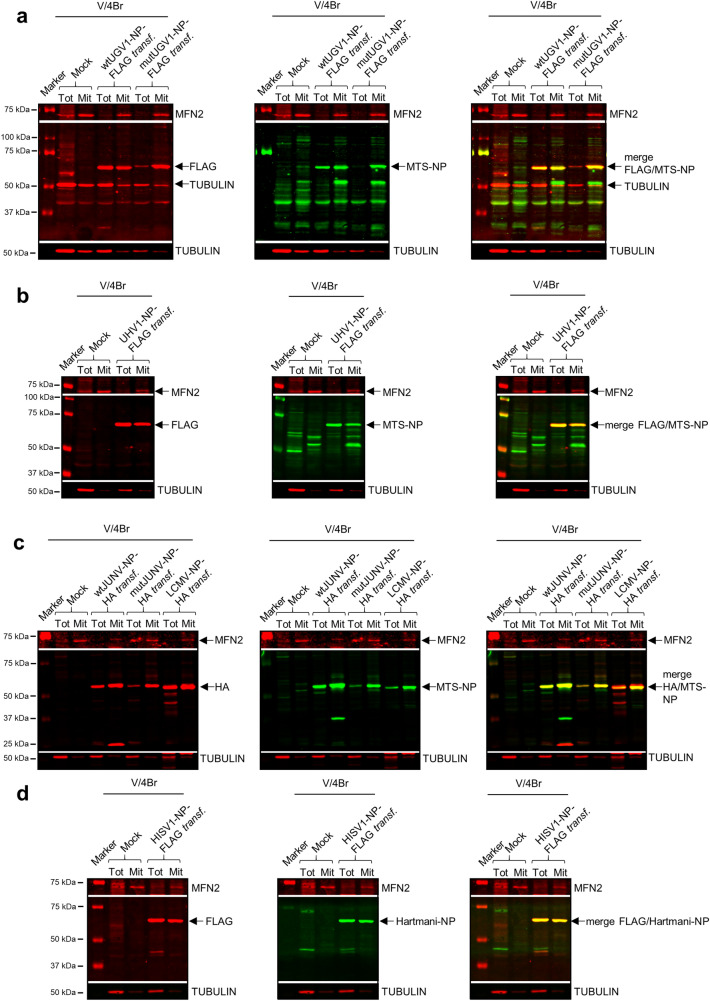
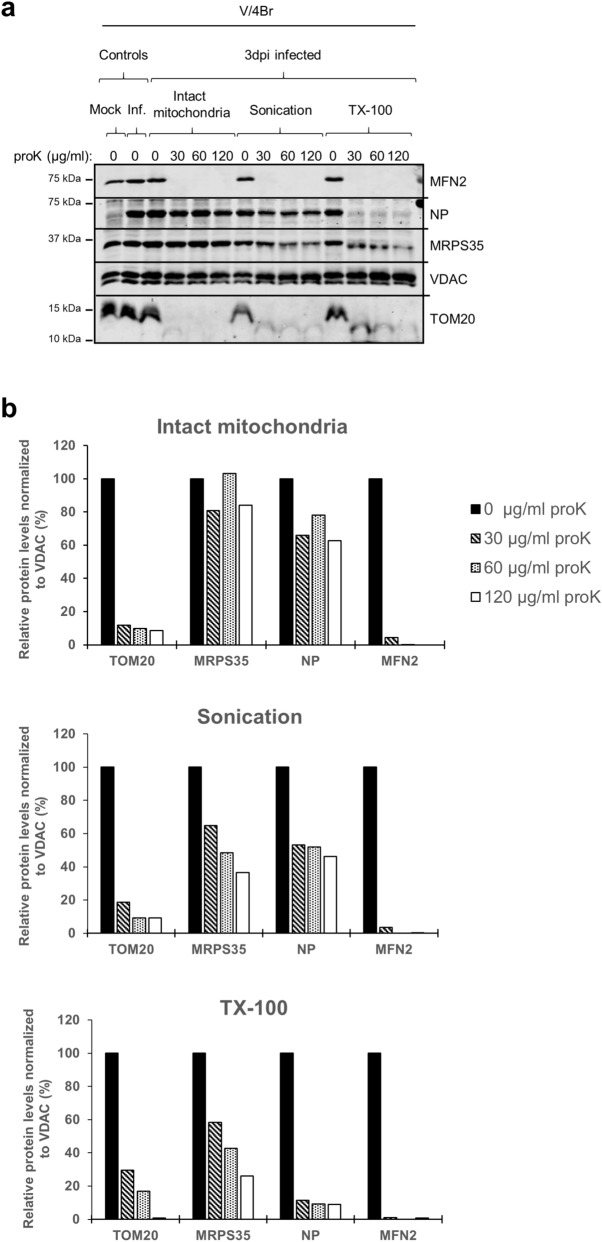
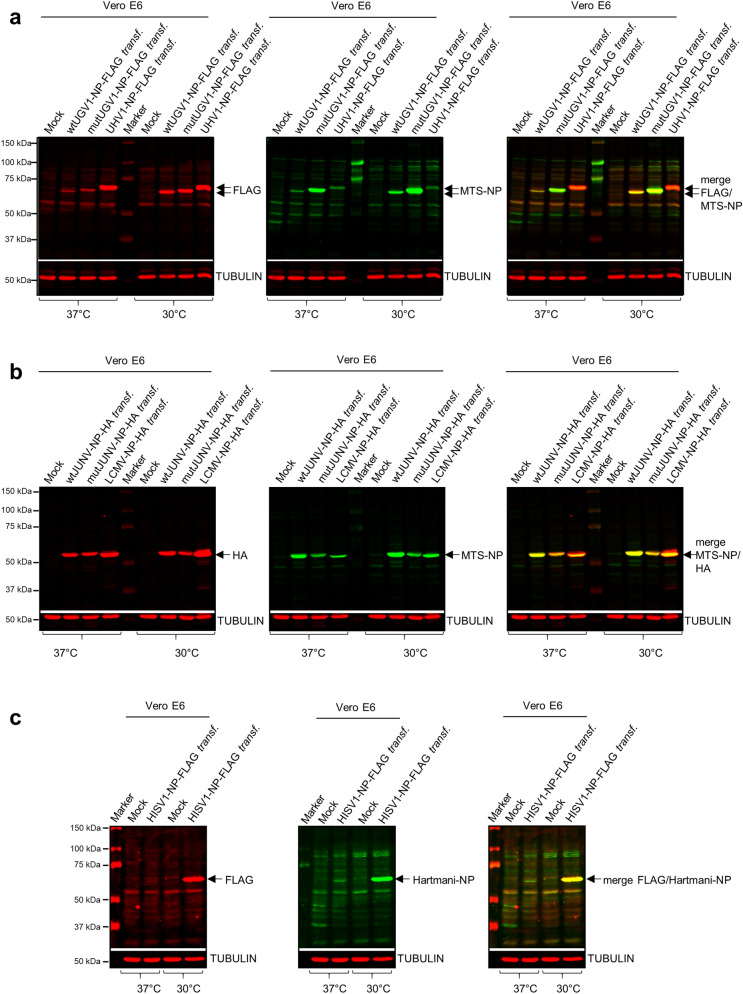
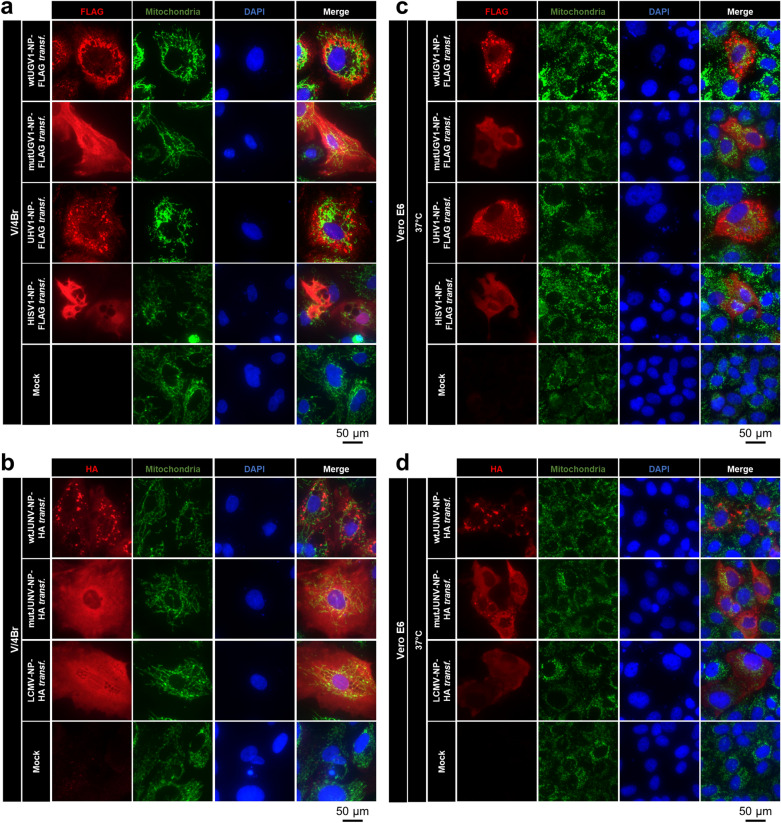
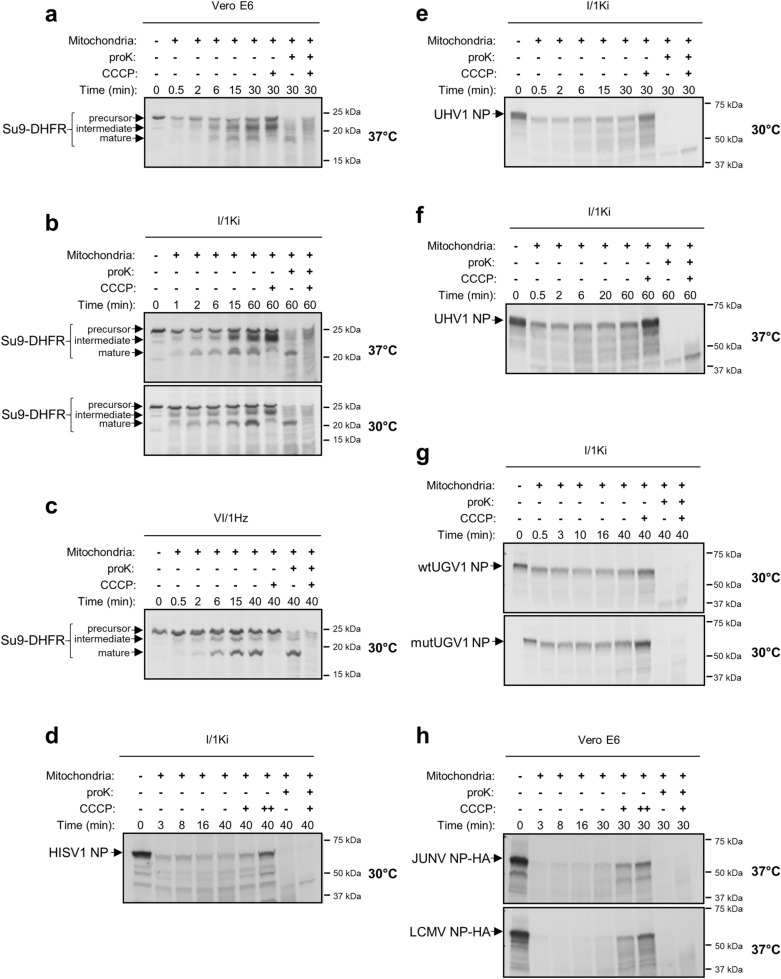
Viruses need cells for their replication and, therefore, ways to hijack cellular functions. Mitochondria play fundamental roles within the cell in metabolism, immunity and regulation of homeostasis due to which some viruses aim to alter mitochondrial functions. Herein we show that the nucleoprotein (NP) of arenaviruses enters the mitochondria of infected cells, affecting the mitochondrial morphology. Reptarenaviruses cause boid inclusion body disease (BIBD) that is characterized, especially in boas, by the formation of cytoplasmic inclusion bodies (IBs) comprising reptarenavirus NP within the infected cells. We initiated this study after observing electron-dense material reminiscent of IBs within the mitochondria of reptarenavirus infected boid cell cultures in an ultrastructural study. We employed immuno-electron microscopy to confirm that the mitochondrial inclusions indeed contain reptarenavirus NP. Mutations to a putative N-terminal mitochondrial targeting signal (MTS), identified via software predictions in both mamm- and reptarenavirus NPs, did not affect the mitochondrial localization of NP, suggesting that it occurs independently of MTS. In support of MTS-independent translocation, we did not detect cleavage of the putative MTSs of arenavirus NPs in reptilian or mammalian cells. Furthermore, in vitro translated NPs could not enter isolated mitochondria, suggesting that the translocation requires cellular factors or conditions. Our findings suggest that MTS-independent mitochondrial translocation of NP is a shared feature among arenaviruses. We speculate that by targeting the mitochondria arenaviruses aim to alter mitochondrial metabolism and homeostasis or affect the cellular defense.


Conflict of interest statement

The authors declare no competing interests.

Figures

Figure 1
Figure 1
TEM and immuno-EM of reptarenavirus-infected and NP-transfected boid cells, and TEM of a BIBD-positive B. constrictor brain. (a–c) TEM, permanent cell culture derived from B. constrictor kidney (I/1Ki), infected with UGV-1, at three dpi. (a) Large irregular cytoplasmic inclusion body (IB; asterisks), vacuolated mitochondria (arrows) and partly ruptured mitochondrion with electron-dense IBs in the matrix (circle). (b) Large electron-dense cytoplasmic IB (asterisk), one mitochondrion with IB in the matrix (circle), and several vacuolar structures consistent with vacuolated mitochondria with small IBs (arrows). (c) Swollen mitochondria with finely granular disintegrated matrix (arrows) and one IB (asterisk). (d) Immunogold labelling of the reptarenaviral NP, I/1Ki infected with UGV-1, at three dpi. Large NP-positive cytoplasmic IB (asterisk) and several NP-positive IBs within the matrix of mitochondria (arrows). Inserts: higher magnification of the areas indicated by the arrows. (e–i) I/1Ki transfected with UHV1-NP-FLAG, at three dpt. (e) TEM, cell with large electron-dense IB (asterisk) and multiple mitochondria with IB formation (highlighted by a white rectangle). (f–i) Immunogold labelling of reptarenaviral NP. (f) Positive reaction in small electron-dense cytoplasmic IBs (asterisks). (g) Large electron-dense IB with positive reaction (larger asterisk) and individual mitochondria with positive IBs within the matrix (smaller asterisks). (h) Irregular shaped, more electron-lucent, presumably earlier cytoplasmic IB (asterisk) and single mitochondrion with positive reaction within the matrix (circle). (i) Mitochondria with positive IBs within the matrix (asterisks) at higher magnification. (j–k) TEM, neurons. (j) Numerous < 1–3.5 µm sized, round, smooth edged electron-dense cytoplasmic IBs (circles) and one larger, less electron-dense, irregularly shaped IB with coarser margins (square). (k) Neurons with small, 0.1–3 µm sized electron-dense cytoplasmic IBs (white squares). Insert: higher magnification depicting irregularly shaped IB borders and a swollen mitochondrion with disorganized coarse electron-dense matrix (asterisk).
Figure 2
Figure 2
Arenaviral NPs transfection constructs. (a,b) Schematic representation of the wild-type (wt) and the mutated (mut) versions of the UGV-1 NP (a) and JUNV NP (b) expressed from a pCAGGS-FLAG or pCAGGS-HA construct, respectively, and used for transfections. Black arrowheads in the putative MTSs (first N-terminal 34 amino acids shown) indicate the positions of the amino acid substitutions of the mut versions compared to the corresponding wt sequences. Both wt and mut UGV-1 NPs are fused in frame with a C-terminal FLAG tag, separated by a linker sequence (a). Both wt and mut JUNV NPs are fused in frame with a C-terminal HA tag, separated by a linker sequence (b).
Figure 3
Figure 3
Immunoblotting studies on boid cells transfected with different arenaviral NPs. (a–d) Immunoblotting analyses of whole-cell lysates (Tot) and mitochondrial preparations (Mit) obtained from Boa constrictor V/4Br cells transfected with constructs expressing wt or mutUGV1-NP-FLAG (a), UHV1-NP-FLAG (b), wt or mutJUNV-NP-HA, or LCMV-NP-HA (c) and HISV1-NP-FLAG (d), all at three dpt. Non-transfected (Mock) samples were used as negative controls. About 1/5 of the transfected cells were used for whole-cell lysate procedure (Tot) and the other 4/5 for mitochondria isolation (Mit). 20 µg (a,b) or 12 µg (c,d) of protein per sample from both Tot and Mit were loaded on standard SDS-PAGE gels followed by immunoblotting analyses. The nitrocellulose membranes were incubated sequentially with the following antibodies in the presented order: (1) mouse anti-FLAG tag 1:500 (a,b,d) or mouse anti-HA tag 1:500 (c); (2) rabbit anti-MTS-NP 1:200 (ac), or rabbit anti-Hartmani-NP 1:500 (d); (3) mouse anti-tubulin 1:500 (a–d); (4) mouse anti-MFN2 1:200 (a,b,d) or 1:100 (c). Anti-tubulin and anti-MFN2 specific signals at known molecular weight did not require membrane stripping, except for panel c, where a stripping step was introduced before probing with mouse anti-MFN2. Tubulin and MFN2 (both in red, secondary antibody: IRDye 680RD Donkey anti-mouse) were used as cytosolic and mitochondrial marker, respectively. Arenavirus NPs (63–68 kDa) are indicated (black arrows). (a,b) Left panels: FLAG tag in red (secondary antibody: IRDye 680RD Donkey anti-mouse); middle panels: MTS-NP in green (secondary antibody: IRDye 800CW Donkey anti-rabbit); right panels: merged image. (c) Left panel: HA tag in red (secondary antibody: IRDye 680RD Donkey anti-mouse); middle panel: MTS-NP in green (secondary antibody: IRDye 800CW Donkey anti-rabbit); right panel: merged image. (d) Left panel: FLAG tag in red (secondary antibody: IRDye 680RD Donkey anti-mouse); middle panel: Hartmani-NP in green (secondary antibody: IRDye 800CW Donkey anti-rabbit); right panel: merged image. Immunodetection was performed using the Odyssey Infrared Imaging System (LICOR, Biosciences) providing also the molecular marker (Precision Plus Protein Dual Color Standards, Bio-Rad) used. Full-length blots are presented in Supplementary Fig. S3.
Figure 4
Figure 4
Submitochondrial analyses of reptarenavirus NP in infected boid cells. (a) Submitochondrial localization assay, protein localization as determined by protease accessibility. Mitochondria were isolated at three dpi from reptarenavirus-inoculated Boa constrictor V/4Br cells and either treated directly with proK at 30, 60 or 120 µg/ml, or subjected to sonication or TX-100 lysis first, and then treated with proK. For each condition, a sample without proK-treatment is provided as a control. An uninfected (Mock) and a reptarenavirus-infected (Inf.) mitochondrial sample at three dpi serve respectively as negative and positive controls for the anti-UHV-NP antibody used to detect the reptarenaviral NP. The samples (25 µg/lane of protein derived from the mitochondrial fraction) were separated through standard SDS-PAGE followed by immunoblotting to detect TOM20 and MFN2 (markers of the OMM), MRPS35 (marker of the mitochondrial matrix), VDAC (loading control) and reptarenaviral NP. Nitrocellulose membrane was cut into upper, middle and lower parts, that were subsequently incubated with antibodies against: upper part, rabbit affinity-purified anti-UHV-NP 1:500 (secondary antibody: IRDye 800CW Donkey anti-rabbit), followed by mouse anti-MFN2 1:200 (secondary antibody: IRDye 680RD Donkey anti-mouse); middle part, rabbit anti-MRPS35 1:1000 (secondary antibody: IRDye 800CW Donkey anti-rabbit), followed by mouse anti-VDAC 1:500 (secondary antibody: IRDye 680RD Donkey anti-mouse); lower part, rabbit anti-TOM20 1:1000 (secondary antibody: IRDye 800CW Donkey anti-rabbit). VDAC, embedded in the OMM membrane, is not affected by proK treatment and thus provides an internal reference for loading. Immunodetections were performed using the Odyssey Infrared Imaging System (LICOR Biosciences), showing also the molecular weight marker (Precision Plus Protein Dual Color Standards, Bio-Rad) used. (b) Quantification of the protein signals from the blot of Fig. 4a was performed by normalizing the signal intensity (determined through Image Studio Lite software, LICOR, Biosciences) of each band of TOM20, MRPS35, reptarenavirus NP and MFN2 to the corresponding one of VDAC, representing the internal loading control. For each condition of intact mitochondria (upper graph), sonication (middle graph) and TX-100 treatment (lower graph), the levels of each protein in proK-treated samples are presented relative to the level of the corresponding proK-untreated sample. Full-length blots are presented in Supplementary Fig. S7.
Figure 5
Figure 5
Immunoblotting studies on arenaviral NPs in transfected mammalian cells. (ac) Immunoblotting analyses of whole-cell lysates obtained from monkey Vero E6 cells transfected with a construct expressing either wt or mutUGV1-NP-FLAG, or UHV1-NP-FLAG (a), wt or mutJUNV-NP-HA, or LCMV-NP-HA (b), HISV1-NP-FLAG (c), at three dpt after incubation at either 37 °C or 30 °C. Non-transfected (Mock) samples are provided as negative controls. 40 µg of protein per sample were loaded on standard SDS-PAGE gels, followed by immunoblotting. The nitrocellulose membranes were incubated sequentially with the following antibodies in the presented order: (1) mouse anti-FLAG tag 1:500 (a,c) or mouse anti-HA tag 1:500 (b); (2) rabbit anti-MTS-NP 1:200 (a,b) or rabbit anti-Hartmani-NP 1:500 (c); (3) mouse anti-tubulin 1:500 (a–c). Anti-tubulin specific signal at known molecular weight did not require membrane stripping. Tubulin (in red, secondary antibody: IRDye 680RD Donkey anti-mouse) was used as a reference for loading. Reptarenavirus and hartmanivirus (65–68 kDa), and mammarenavirus (63–65 kDa) NPs are indicated (black arrows). (a) Left panel: FLAG tag in red (secondary antibody: IRDye 680RD Donkey anti-mouse); middle panel: MTS-NP in green (secondary antibody: IRDye 800CW Donkey anti-rabbit); right panel: merged image. (b) Left panel: HA tag in red (secondary antibody: IRDye 680RD Donkey anti-mouse); middle panel: MTS-NP in green (secondary antibody: IRDye 800CW Donkey anti-rabbit); right panel: merged image. (c) Left panel: FLAG tag in red (secondary antibody: IRDye 680RD Donkey anti-mouse); middle panel: Hartmani-NP in green (secondary antibody: IRDye 800CW Donkey anti-rabbit); right panel: merged image. Immunodetection was performed using the Odyssey Infrared Imaging System (LICOR, Biosciences) providing also the molecular marker (Precision Plus Protein Dual Color Standards, Bio-Rad) used. Full-length blots are presented in Supplementary Fig. S8.
Figure 6
Figure 6
IF studies on arenaviral NPs in transfected boid and mammalian cells. Double IF images of Boa constrictor V/4Br cells incubated at 30 °C (a,b) or of monkey Vero E6 cells incubated at 37 °C (c,d), transfected with a construct expressing either wt or mutUGV1-NP-FLAG, UHV1-NP-FLAG, or HISV1-NP-FLAG (a,c), and wt or mutJUNV-NP-HA, or LCMV-NP-HA (b,d) at three dpt. Non-transfected (Mock) cells served as controls. (a,c) The panels from left: FLAG tag in red (secondary antibody: AlexaFluor 594 goat anti-rabbit), mitochondrial marker in green (secondary antibody: AlexaFluor 488 goat anti-mouse), nuclei in blue (DAPI), and a merged image. (b,d) The panels from left: HA tag in red (secondary antibody: AlexaFluor 594 goat anti-rabbit), mitochondrial marker in green (secondary antibody: AlexaFluor 488 goat anti-mouse), nuclei in blue (DAPI), and a merged image.
Figure 7
Figure 7
In vitro mitochondria import assay of arenaviral NPs. (ac) The in vitro import into mitochondria was determined for a known chimeric mitochondrial protein, Su9-DHFR, used as positive control for the assay. The fusion protein was synthesized using [35S]-methionine in a rabbit reticulocyte lysate, from its sequence cloned in a pGEM4Z vector, flanking the SP6 RNA promoter. The hybrid protein was imported into freshly isolated mitochondria of monkey Vero E6 cells, at 37 °C (a), Boa constrictor kidney (I/1Ki) cells, at both 37 °C and 30 °C (b), and Python regius heart (VI/1Hz) cells, at 30 °C (c), as indicated by the presence at different time points of three distinct translocation forms: precursor, intermediate and mature forms (black arrows). (dh) The in vitro translocation into freshly isolated Boa constrictor I/1Ki mitochondria was assessed for HISV-1 NP, at 30 °C (d), UHV-1 NP, at 30 °C (e) and 37 °C (f), wt and mutUGV-1 NPs, at 30 °C (g) and HA-tagged JUNV and LCMV NPs, at 37 °C (h). Radiolabelled NPs were in vitro synthesized using [35S]-methionine in a rabbit reticulocyte lysate, from their ORFs cloned into pGEM4Z (d–g) or pCR4Blunt-TOPO (h) vectors, flanking the SP6 (d–g) or T7 (h) promoter. Protein signals were determined through autoradiographic detection. CCCP: mitochondrial protein import blocker by inducing mitochondrial membrane potential dissipation. proK: leading to degradation of non-imported proteins. Full-length autoradiographies are presented in Supplementary Fig. S12.

Similar articles

Cited by

References

    1. Glingston RS, Deb R, Kumar S, Nagotu S. Organelle dynamics and viral infections: At cross roads. Microbes Infect. 2019;21:20–32. doi: 10.1016/j.micinf.2018.06.002. - DOI - PMC - PubMed
    1. Kagan JC. Signaling organelles of the innate immune system. Cell. 2012;151:1168–1178. doi: 10.1016/j.cell.2012.11.011. - DOI - PMC - PubMed
    1. Bock FJ, Tait SWG. Mitochondria as multifaceted regulators of cell death. Nat. Rev. Mol. Cell Biol. 2020;21:85–100. doi: 10.1038/s41580-019-0173-8. - DOI - PubMed
    1. Weinberg SE, Sena LA, Chandel NS. Mitochondria in the regulation of innate and adaptive immunity. Immunity. 2015;42:406–417. doi: 10.1016/j.immuni.2015.02.002. - DOI - PMC - PubMed
    1. Anand SK, Tikoo SK. Viruses as modulators of mitochondrial functions. Adv. Virol. 2013;2013:738794. doi: 10.1155/2013/738794. - DOI - PMC - PubMed

Publication types