. 2021 Oct 26;4(1):1227.
doi: 10.1038/s42003-021-02715-9.

Bmal1 in the striatum influences alcohol intake in a sexually dimorphic manner

Affiliations

Bmal1 in the striatum influences alcohol intake in a sexually dimorphic manner

Nuria de Zavalia et al. Commun Biol. .

Abstract

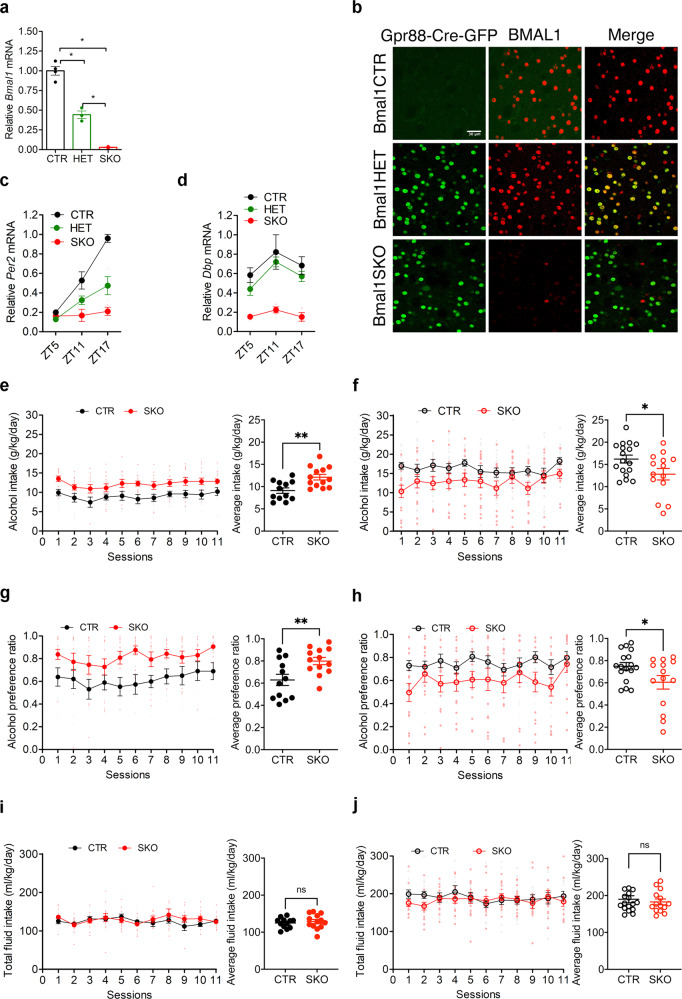
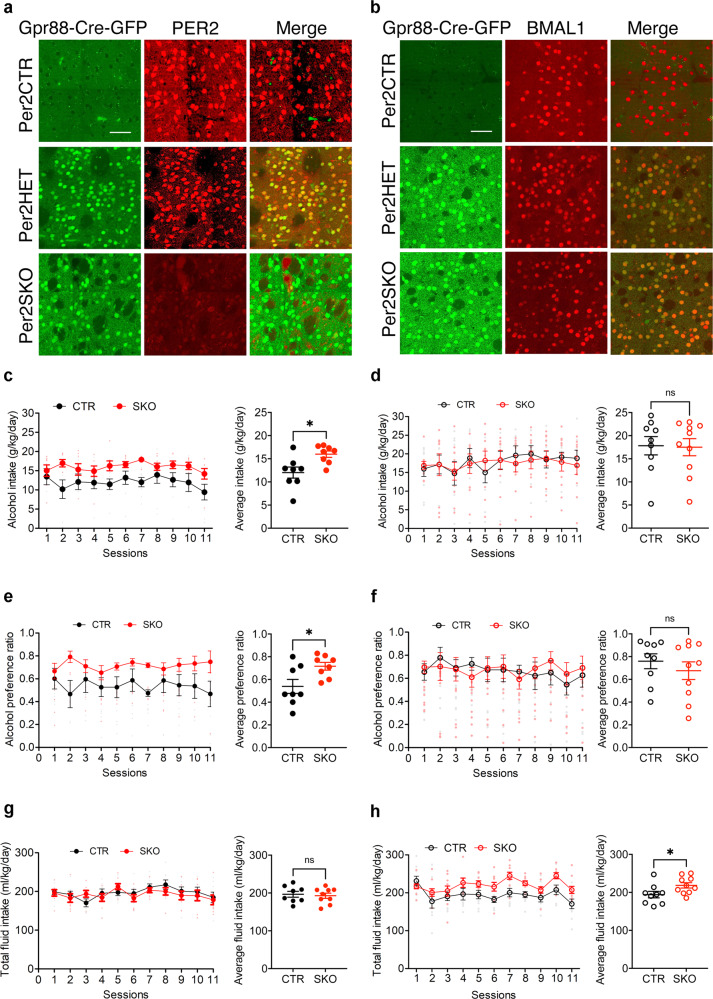
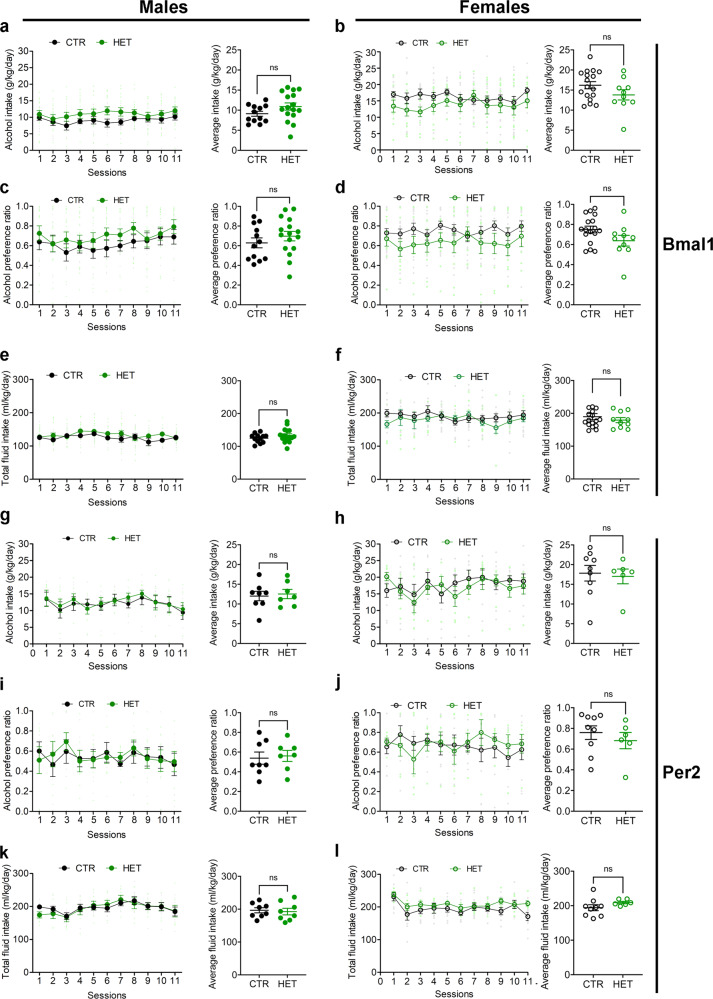
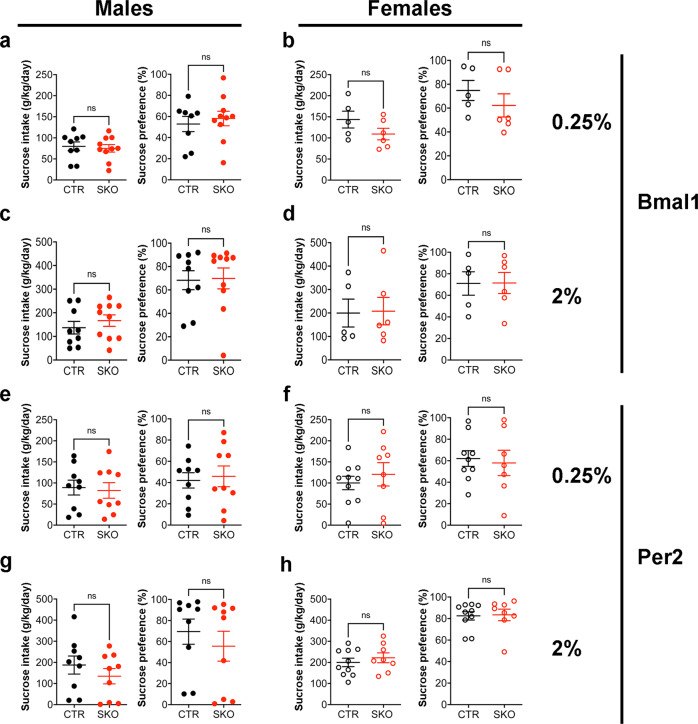
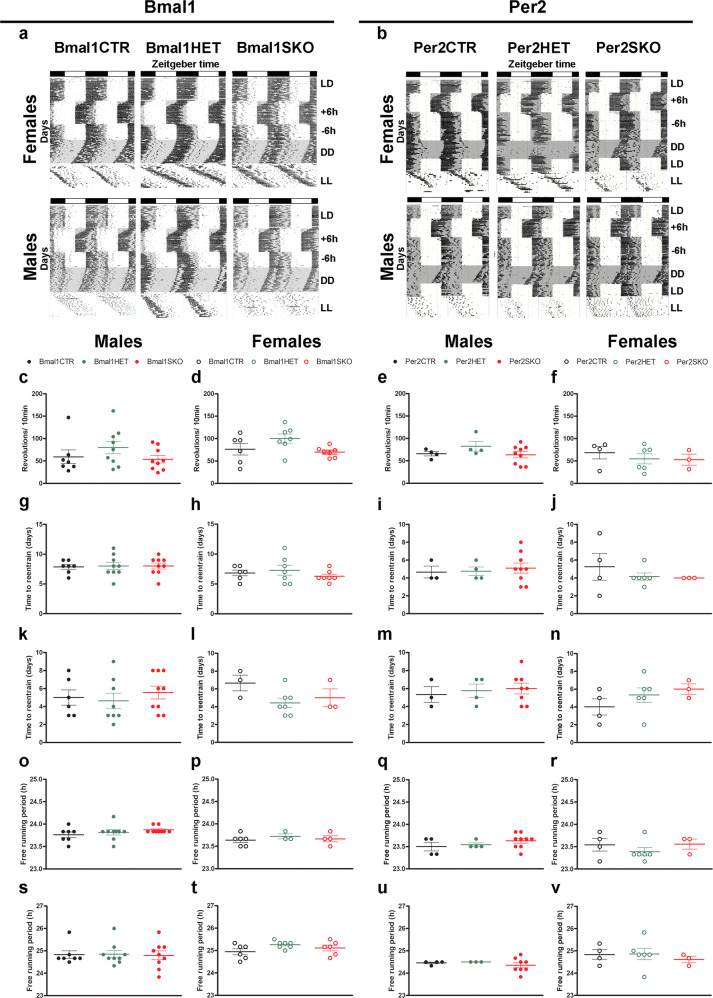
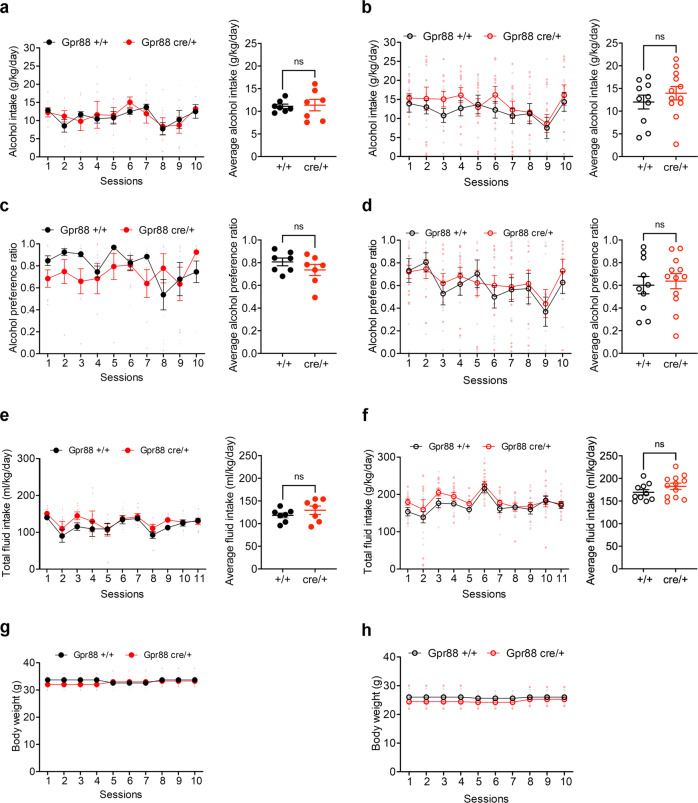
Alcohol consumption has been strongly associated with circadian clock gene expression in mammals. Analysis of clock genes revealed a potential role of Bmal1 in the control of alcohol drinking behavior. However, a causal role of Bmal1 and neural pathways through which it may influence alcohol intake have not yet been established. Here we show that selective ablation of Bmal1 (Cre/loxP system) from medium spiny neurons of the striatum induces sexual dimorphic alterations in alcohol consumption in mice, resulting in augmentation of voluntary alcohol intake in males and repression of intake in females. Per2mRNA expression, quantified by qPCR, decreases in the striatum after the deletion of Bmal1. To address the possibility that the effect of striatal Bmal1 deletion on alcohol intake and preference involves changes in the local expression of Per2, voluntary alcohol intake (two-bottle, free-choice paradigm) was studied in mice with a selective ablation of Per2 from medium spiny neurons of the striatum. Striatal ablation of Per2 increases voluntary alcohol intake in males but has no effect in females. Striatal Bmal1 and Per2 expression thus may contribute to the propensity to consume alcohol in a sex -specific manner in mice.


Conflict of interest statement

The authors declare no competing interests.

Figures

Fig. 1
Fig. 1. Alcohol drinking behavior of control and Bmal1 knockout mice.
a Quantitative PCR analysis of Bmal1 mRNA levels measured at ZT1 in dorsal striatal tissue of control, Bmal1 heterozygote and knockout mice. ANOVA, significant genotype effect, F (2, 7) = 113.8, p < 0.0001, Tukey’s post-hoc test, *p < 0.005. b A representative image of BMAL1 immunofluorescence staining at ZT 1 in dorsal striatal tissue of control, Bmal1 heterozygote and knockout mice. BMAL1: red, Gpr88-Cre-GFP: green. Scale bar = 30 µm. c Quantitative PCR analysis of Per2 mRNA levels in dorsal striatal tissue of control, Bmal1 heterozygote and knockout male mice. Two-way ANOVA, significant genotype effect, F (2, 5) = 21.46, p = 0.0035, and time point effect, F (2, 8) = 51.7, p < 0.0001, significant interaction effect, F (4, 8) = 13.97, p = 0.0011. d Quantitative PCR analysis of Dbp mRNA levels in dorsal striatal tissue of control, Bmal1 heterozygote and knockout mice. Two-way ANOVA, significant genotype effect, F (2, 5) = 116.6, p < 0.0001, and time point effect F (2, 8) = 5.236, p < 0.05 effect, Tukey’s test, **p < 0.05. e Daily alcohol consumption (left) and average alcohol consumption (right) of control, and Bmal1 knockout male mice. Two-way repeated measure ANOVA, (RM-ANOVA) significant genotype effect, F (1, 23) = 13.26, p = 0.0014, Unpaired two-tailed t-test, **p < 0.01. f Daily alcohol consumption (left) and average alcohol consumption (right) of control, and Bmal1 knockout female mice. RM-ANOVA, significant genotype effect, F (1, 29) = 5.0, p = 0.033. Unpaired two-tailed t-test, *p < 0.05. g Daily alcohol preference (left) and average alcohol preference (right) of control, and Bmal1 knockout male mice. RM-ANOVA, significant genotype effect, F (1, 23) = 10.73, p = 0.0033. Unpaired two tailed t-test, **p < 0.01. h Daily alcohol preference (left) and average alcohol preference (right) of control, and Bmal1 knockout female mice. RM-ANOVA, significant genotype effect, F (1, 29) =4.708, p = 0.0384. Unpaired two tailed t-test, *p < 0.05. i Daily fluid intake (left) and average fluid intake (right) of control and Bmal1 knockout male mice. RM-ANOVA, no significant effect, F (1, 23) = 0.3737, p = 0.5470. Unpaired two-tailed t-test, NS. j Daily fluid intake (left) and average fluid intake (right) of control and Bmal1 knockout female mice. RM-ANOVA, no significant effect, F (1,29) = 0.3185, p = 0.5769. Unpaired two-tailed t-test, NS. NS = no significant differences. CTR: control, HET: Bmal1 heterozygote, SKO: Bmal1 knockout. ZT: Zeitgeber time. c-j, the values express mean ± S.E.M. ad, n = 3/genotype. e, g, i, CTR n = 12, SKO n = 13. f, h, j, CTR n = 17, SKO n = 14.
Fig. 2
Fig. 2. Alcohol drinking behavior of control and Per2 knockout mice.
a A representative image of PER2 immunofluorescence staining in dorsal striatal tissue of control and Per2 knockout mice. PER2: red, Gpr88-Cre-GFP: green. n = 3/genotype, scale bar = 50 µm. b A representative image of BMAL1 immunofluorescence staining in dorsal striatal tissue of control, and Per2 knockout mice. BMAL1: red, Gpr88-Cre-GFP: green. n = 3/genotype, scale bar = 50 µm. c Daily alcohol consumption (left) and average alcohol consumption (right) of control and Per2 knockout male mice. Two-way repeated measure ANOVA (RM-ANOVA), significant genotype effect, F (1, 14) = 8.332, p = 0.0120. Unpaired two-tailed t-test, *p < 0.05. d Daily alcohol consumption (left) and average alcohol consumption (right) of control and Per2 knockout female mice. RM-ANOVA, no significant effect, F (1, 17) = 0.014, p = 0.9072. Unpaired two-tailed t-test, NS. e Daily alcohol preference (left) and average alcohol preference (right) of control and Per2 knockout male mice. RM-ANOVA, significant genotype effect, F (1, 14) = 6.552, p = 0.0227. Unpaired two-tailed t-test, *p < 0.05. f Daily alcohol preference (left) and average alcohol preference (right) of control and Per2 knockout female mice. RM-ANOVA, no significant effect, F (1, 17) = 0.01779, p = 0.8955. Unpaired two-tailed t-test, NS. g Daily fluid intake (left) and average fluid intake (right) of control and Per2 knockout male mice. RM-ANOVA, no significant effect, F (1, 14) = 0.142, p = 0.7116. Unpaired two-tailed t-test, NS. h Daily fluid intake (left) and average fluid intake (right) of control and Per2 knockout female mice. RM-ANOVA, significant genotype effect, F (1, 17) = 5.665, p = 0.0293. Unpaired two-tailed t-test, *p < 0.05. NS = no significant differences. CTR: control, HET: Per2 heterozygote, SKO: Per2 knockout. ch The values express mean ± S.E.M. a, b n = 3/genotype. c, e, g, CTR n = 8, SKO n = 8. d, f, h CTR n = 9, SKO n = 10.
Fig. 3
Fig. 3. Alcohol drinking behavior of control, Bmal1, and Per2 heterozygote mice.
a Daily alcohol intake (left) and average alcohol intake (right) of control and Bmal1 heterozygote male mice. Two-way repeated measure ANOVA (RM-ANOVA), no significant effect, F (1, 26) = 2.793, p = 0.1067, Unpaired two-tailed t-test, NS. b Daily alcohol intake (left) and average alcohol intake (right) of control and Bmal1 heterozygote female mice. RM-ANOVA, no significant effect, F (1, 25) = 2.507, p = 0.1259, Unpaired two-tailed t-test, NS. c Daily alcohol preference (left) and average alcohol preference (right) of control and Bmal1 heterozygote male mice. RM-ANOVA, no significant effect, F (1, 26) = 1.326, p = 0.26, Unpaired two-tailed t-test, NS. d Daily alcohol preference (left) and average alcohol preference (right) of control and Bmal1 heterozygote female mice. RM-ANOVA, no significant effect, F (1, 25) = 3.506, p = 0.0729, Unpaired two tailed t-test, NS. e Total fluid intake (left) and average fluid intake (right) of control and Bmal1 heterozygote male mice. RM-ANOVA, no significant effect, F (91, 26) = 1.498, p = 0.2320, Unpaired two-tailed t-test, NS. f Total fluid intake (left) and average fluid intake (right) of control and Bmal1 heterozygote female mice. RM-ANOVA, no significant effect, F (1, 25) = 0.5874, p = 0.4506, Unpaired two-tailed t-test, NS. g Daily alcohol intake (left) and average alcohol intake (right) of control and Per2 heterozygote male mice. RM-ANOVA, no significant effect, F (1, 13) = 0.09317, p = 0.7650. Unpaired two-tailed t-test, NS. h Daily alcohol intake (left) and average alcohol intake (right) of control and Per2 heterozygote female mice. RM-ANOVA, no significant effect, F (1, 13) = 0.08137. p = 0.7799. Unpaired two-tailed t-test, NS. i Daily alcohol preference (left) and average alcohol preference (right) of control and Per2 heterozygote male mice. RM-ANOVA, no significant effect, F (1, 13) = 0.01314, p = 0.9105. Unpaired two-tailed t-test, NS. j Daily alcohol preference (left) and average alcohol preference (right) of control and Pe2 heterozygote female mice. RM-ANOVA, no significant effect, F (1, 13) = 0.04381, p = 0.8375. Unpaired two-tailed t-test, NS. k Total fluid intake (left) and average fluid intake (right) of control and Per2 heterozygote male mice. RM-ANOVA, no significant effect, F (1, 13) = 0.02780, p = 0.8702. Unpaired two-tailed t-test, NS. l Total fluid intake (left) and average fluid intake (right) of control and Per2 heterozygote female mice. RM-ANOVA, no significant effect, F (1, 13) = 1.833, p = 0.1988. Unpaired two tailed t-test, NS. NS = no significant differences. The values express mean ± S.E.M. a–f, CTR: control, HET: Bmal1 heterozygote. a, c, e CTR n = 12, HET n = 16. b, d, f CTR n = 17, HET n = 10. gl CTR: control, HET: Per2 heterozygote. g, i, k CTR n = 8, HET n = 7. h, j, l CTR n = 9, HET n = 6.
Fig. 4
Fig. 4. Drinking behavior of Bmal1 and Per2 knockout mice is independent of changes in the general reward processing.
a Average daily intake (left) and preference (right) of 0.25% sucrose solution of control and Bmal1 knockout male mice. Unpaired two-tailed t-test, NS. b Average daily intake (left) and preference (right) of 0.25% sucrose solution of control and Bmal1 knockout female mice. Unpaired two-tailed t-test, NS. c Average daily intake (left) and preference (right) of 2% sucrose solution of control and Bmal1 knockout male mice. Unpaired two-tailed t-test, NS. d Average daily intake (left) and preference (right) of 2% sucrose solution of control and Bmal1 knockout female mice. Unpaired two-tailed t-test, NS. e Average daily intake (left) and preference (right) of 0.25% sucrose solution of control and Per2 knockout male mice. Unpaired two-tailed t-test, NS. f Average daily intake (left) and preference (right) of 0.25% sucrose solution of control and Per2 knockout female mice. Unpaired two-tailed t-test, NS. g Average daily intake (left) and preference (right) of 2% sucrose solution of control and Per2 knockout male mice. Unpaired two-tailed t-test, NS. h, Average daily intake (left) and preference (right) 2% sucrose solution of control and Per2 knockout female mice. Unpaired two-tailed t-test, NS. NS = no significant differences. ah, the values express mean ± S.E.M. ad, CTR: Bmal1 control, SKO: Bmal1 Knockout. a, c, CTR n = 9, SKO n = 9. b, d CTR n = 5, SKO n = 6. eh CTR: Per2 control, SKO: Per2 knockout. e, g CTR n = 9, SKO n = 9. f, h CTR n = 10, SKO n = 8.
Fig. 5
Fig. 5. Conditional ablation of Bmal1 and Per2 does not affect SCN function.
a Representative double-plotted actograms illustrating the daily pattern of running-wheel activity of control, Bmal1 heterozygote and knockout female (top), and male (bottom) mice. b Representative double-plotted actograms illustrating the daily pattern of running-wheel activity of control, Per2 heterozygote and knockout female (top) and male (bottom) mice. The vertical marks indicate periods of activity of at least 10-wheel revolutions per 10 min. Each horizontal line plots 48 h, and sequential days are arranged from top to bottom. The empty and gray shaded areas in each actogram illustrate the light and dark phases, respectively. c–v Circadian analysis of locomotor activity of Bmal1 and Per2 control, heterozygote and knockout male and female mice. One way-ANOVA. No significant differences were observed between the different genotypes in any of the parameters analyzed. cf Amplitude of the locomotor activity rhythm. gj, time to entrain to a 6-h phase advance. kn Time to entrain to a 6-h phase delay. or Free running period in constant dark (DD). s-v Free running period in constant light (LL). a, b LD, 12:12 h light dark; +6 h, 6-h phase advance; −6h, 6-h phase delay; DD, constant dark; LL, constant light. Bmal1CTR: control, Bmal1HET: Bmal1 heterozygote, Bmal1SKO: Bmal1 knockout. Per2CTR: control, Per2HET: Per2 heterozygote, Per2SKO: Per2 knockout. Bars on the graphs represent the arithmetic mean ± S.E.M.
Fig. 6
Fig. 6. Alcohol consumption is not altered in Gpr88 heterozygote mice.
a Daily alcohol intake (left) and average alcohol intake (right) of control and Gpr88 heterozygote male mice. Two-way repeated measure ANOVA (RM-ANOVA), no significant effect, F (1, 12) = 0.03709, p = 0.8505. Unpaired two-tailed t-test, no significance. b Daily alcohol intake (left) and average alcohol intake (right) of control and Gpr88 heterozygote female mice. RM- ANOVA, no significance, F (1, 20) = 0.8286, p = 0.3735. Unpaired two-tailed t-test, no significance. c Daily alcohol preference (left) and average alcohol preference of control and Gpr88 heterozygote male mice. RM-ANOVA, no significance, F (1, 12) = 1.418, p = 0.2567. Unpaired two-tailed t-test, no significance. d Daily alcohol preference (left) and average alcohol preference of control and Gpr88 heterozygote female mice. RM-ANOVA, no significance, F (1, 20) = 0.1233, p = 0.0.7292. Unpaired two-tailed t-test, no significance. e Total fluid intake (left) and average fluid intake (right) of control and Gpr88 heterozygote male mice. RM-ANOVA, no significant effect, F (1, 12) = 1.079, p = 0.3195, Unpaired two-tailed t-test, NS. f Total fluid intake (left) and average fluid intake (right) of control and Gpr88 heterozygote female mice. RM-ANOVA, no significant effect, F (1, 20) = 1.983, p = 0.1744, Unpaired two-tailed t-test, NS. g Daily body weight of control and Gpr88 heterozygote male mice. RM-ANOVA, no significant effect, F (1, 12) = 0.5672, p = 0.4659. h Daily body weight of control and Gpr88 heterozygote female mice. RM-ANOVA, no significant effect, F (1, 20) = 2.905, p = 0.1038. NS = no significant differences. The values express mean ± S.E.M. a, c, e, g, Gpr88+/+, n = 7 and Gpr88Cre/+, n = 7. b, d, f, h Gpr88+/+, n = 10 and Gpr88Cre/+, n = 12.

Similar articles

Cited by

References

    1. Bunger MK, et al. Mop3 is an essential component of the master circadian pacemaker in mammals. Cell. 2000;103:1009–1017. doi: 10.1016/S0092-8674(00)00205-1. - DOI - PMC - PubMed
    1. Frederick A, Goldsmith J, de Zavalia N, Amir S. Mapping the co-localization of the circadian proteins PER2 and BMAL1 with enkephalin and substance P throughout the rodent forebrain. PLoS ONE. 2017;12:e0176279. doi: 10.1371/journal.pone.0176279. - DOI - PMC - PubMed
    1. McDearmon EL, et al. Dissecting the functions of the mammalian clock protein BMAL1 by tissue-specific rescue in mice. Science. 2006;314:1304–1308. doi: 10.1126/science.1132430. - DOI - PMC - PubMed
    1. Hatanaka F, et al. Genome-wide profiling of the core clock protein BMAL1 targets reveals a strict relationship with metabolism. Mol. Cell Biol. 2010;30:5636–5648. doi: 10.1128/MCB.00781-10. - DOI - PMC - PubMed
    1. Alvarez JD, et al. The circadian clock protein BMAL1 is necessary for fertility and proper testosterone production in mice. J. Biol. Rhythms. 2008;23:26–36. doi: 10.1177/0748730407311254. - DOI - PMC - PubMed

Publication types

Grants and funding