. 2021 Oct 19:14:6935-6950.
doi: 10.2147/IJGM.S331959. eCollection 2021.

A Novel Autophagy-Related lncRNA Prognostic Signature Associated with Immune Microenvironment and Survival Outcomes of Gastric Cancer Patients

Affiliations

A Novel Autophagy-Related lncRNA Prognostic Signature Associated with Immune Microenvironment and Survival Outcomes of Gastric Cancer Patients

Di Chen et al. Int J Gen Med. .

Abstract

Purpose: Autophagy plays a crucial role in the initiation and progression of gastric cancer (GC). However, the role of autophagy-related lncRNAs in GC remains unknown. This study aimed to investigate the prognostic value of the autophagy-related lncRNA signature and its role in the tumor immune microenvironment (TIME) of GC.

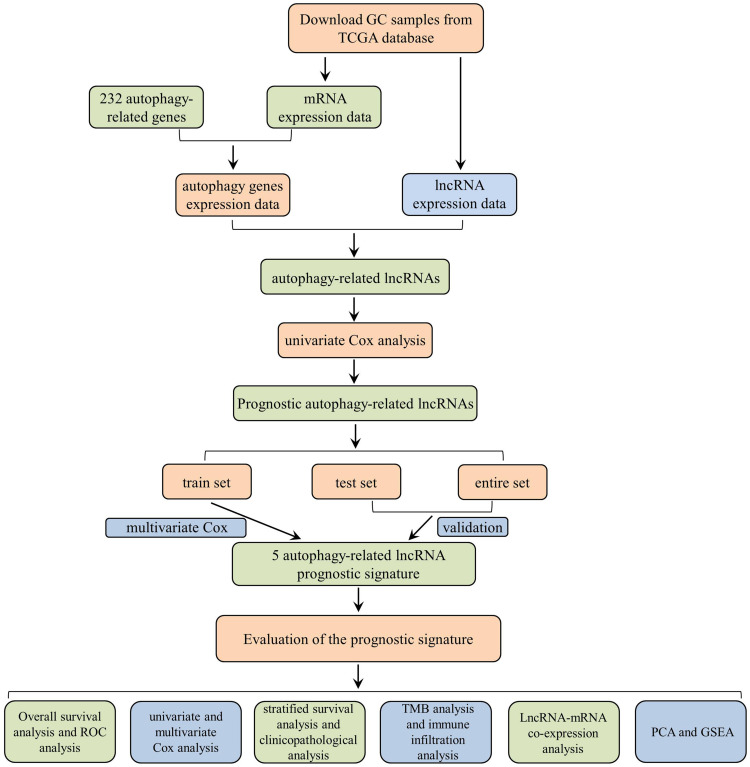
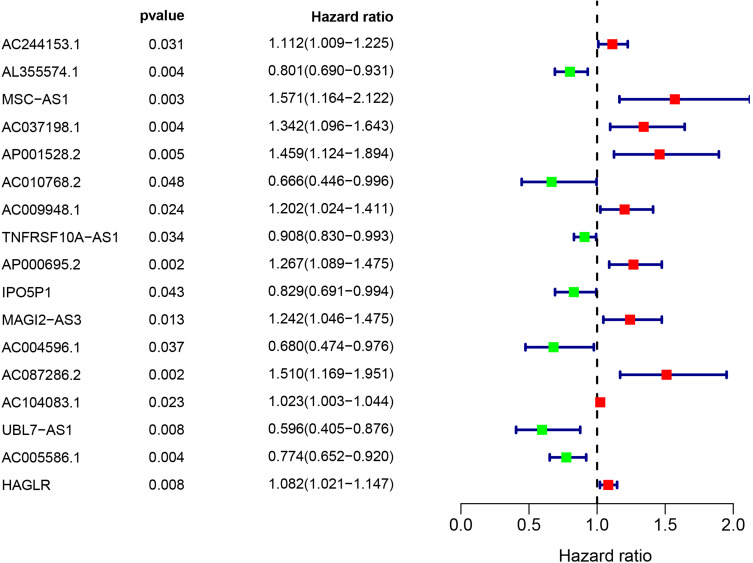
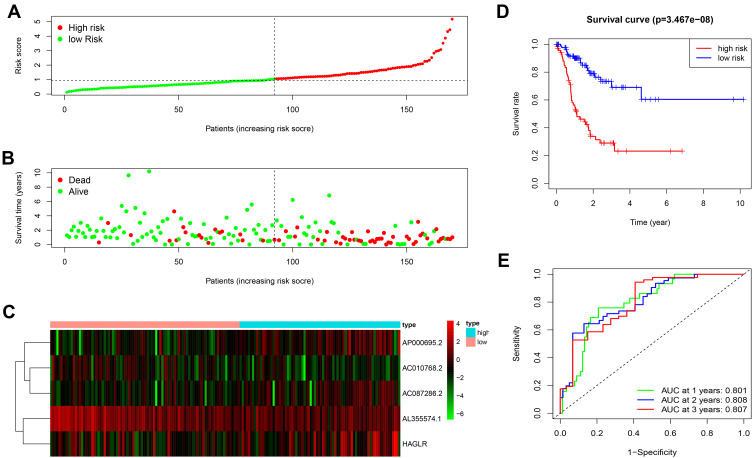
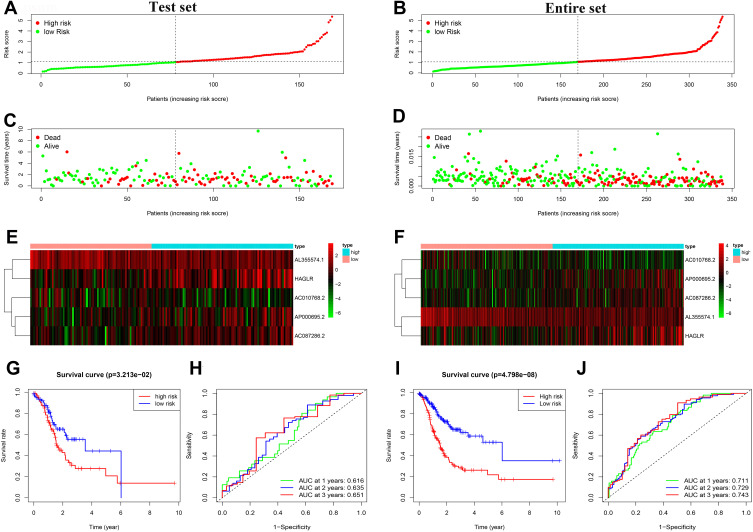
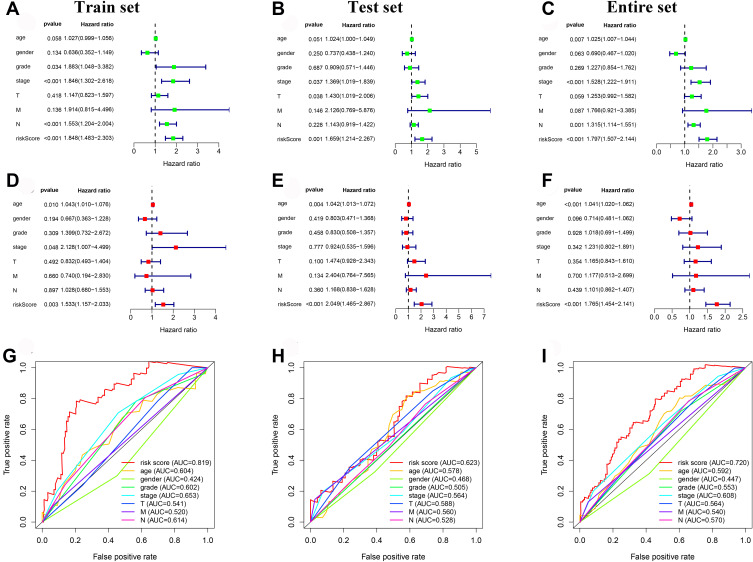
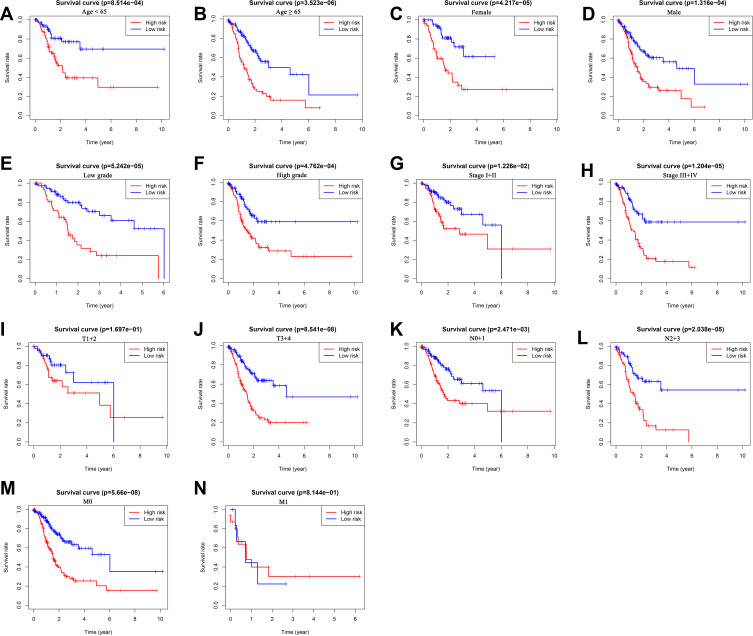
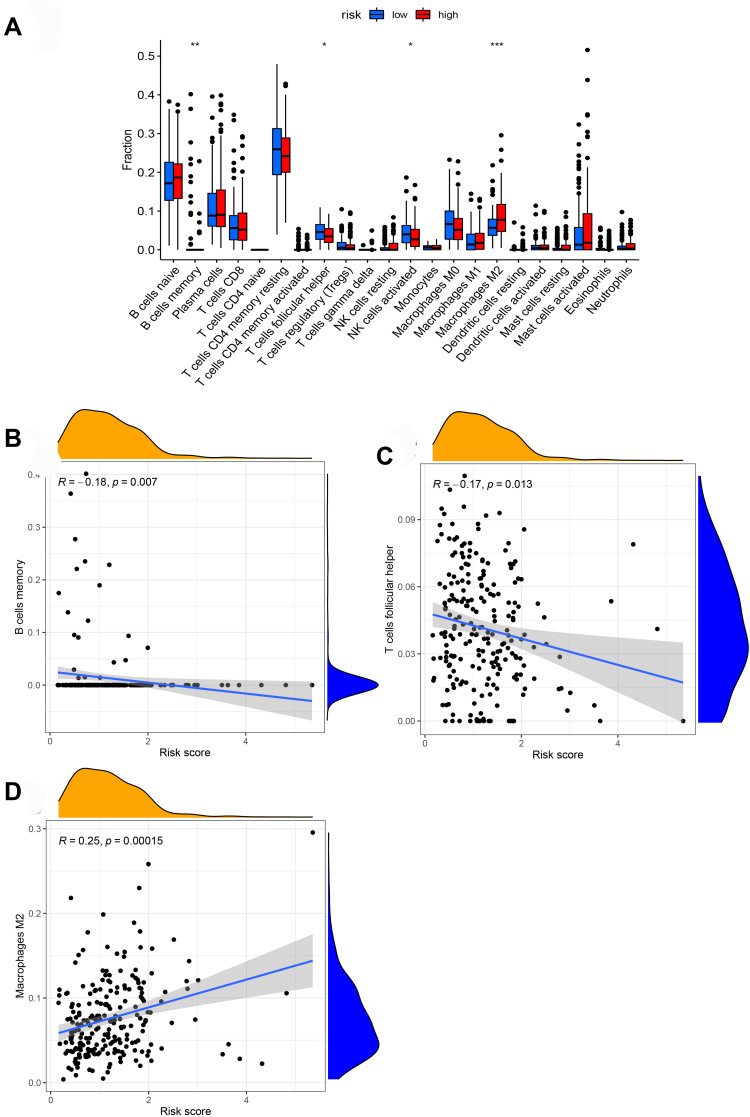
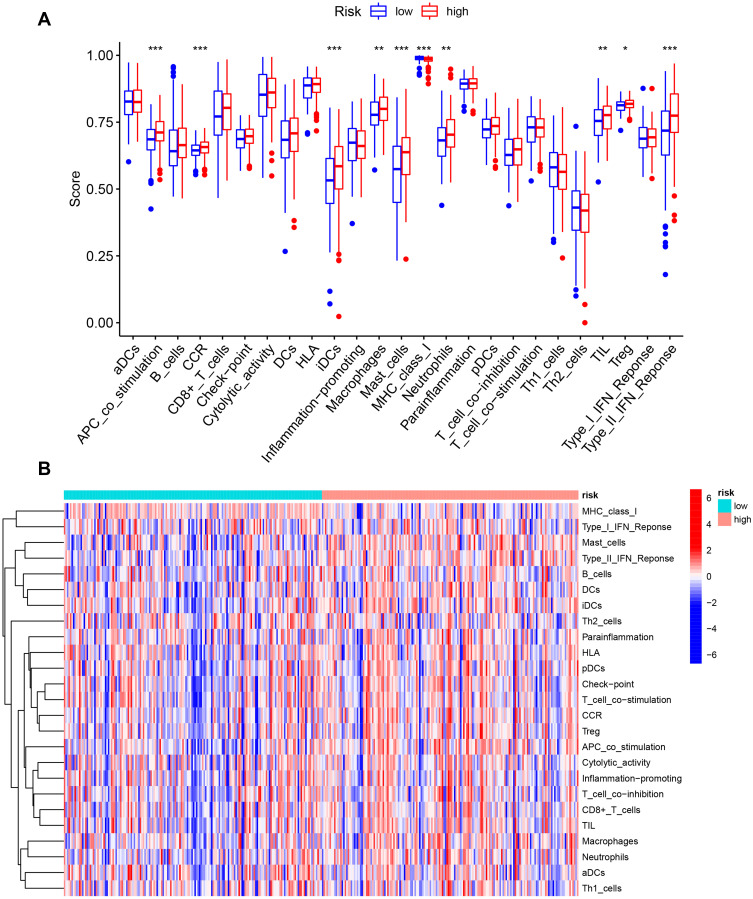
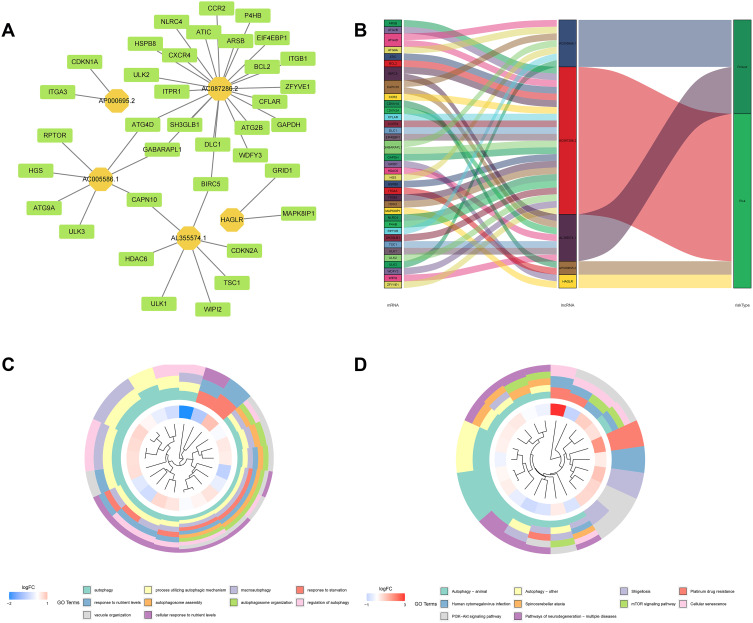
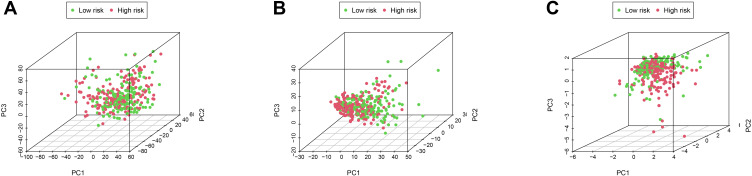
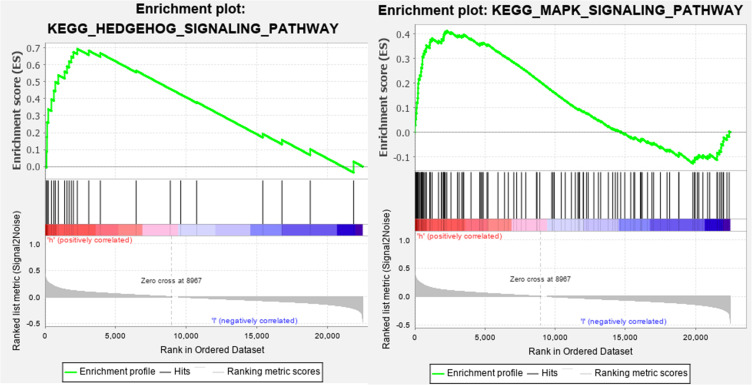
Methods: RNA-sequencing (RNA-seq) and clinical data of GC patients were extracted from The Cancer Genome Atlas (TCGA) database. Univariate and multivariate Cox regression analyses were performed to identify the autophagy-related lncRNA prognostic signature which was validated in the test set and entire set. The survival and predictive performance were analyzed based on the Kaplan-Meier and ROC curves. Furthermore, the CIBERSORT algorithm was applied to explore the relationship between this signature and the immune cell infiltration. To elucidate the potential functions of autophagy-related lncRNAs in GC, we constructed the lncRNA-mRNA co-expression network and performed enrichment analysis. Principal component analysis (PCA) and Gene Set Enrichment Analysis (GSEA) were further performed to compare the different statuses between the high-risk and low-risk groups.

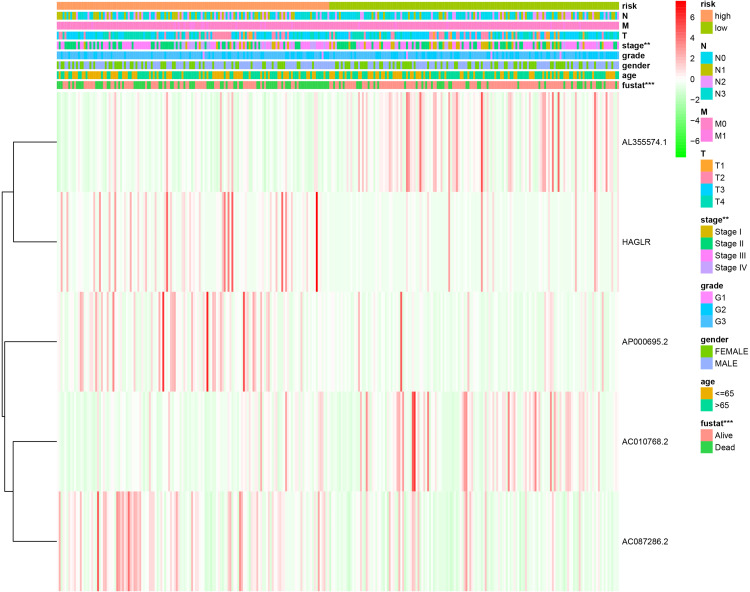
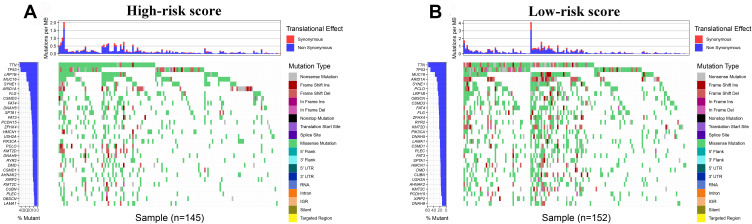
Results: We identified 5 autophagy-related lncRNAs (AL355574.1, AC010768.2, AP000695.2, AC087286.2, and HAGLR) to construct a prognostic signature. This signature could be an independent prognostic indicator for GC patients and had a higher prediction efficiency than other clinicopathological parameters. Furthermore, patients in the high-risk score group had a stronger immunosuppressive microenvironment than the low-risk group. The enrichment analysis for mRNAs co-expressed with these lncRNAs indicated that autophagy-related signaling pathways were remarkably enriched. PCA and GSEA further revealed different autophagy and immune statuses in the high- and low-risk groups.

Conclusion: The 5 autophagy-related lncRNA signature has significant clinical implications in prognosis prediction of GC. Meanwhile, our study elucidates the critical role of the autophagy-related lncRNA signature in the TIME of GC.

Keywords: autophagy; gastric cancer; long non-coding RNAs; prognostic signature; tumor immune microenvironment.


Conflict of interest statement

The authors report no conflicts of interest in this work.

Figures

Figure 1
Figure 1
The flow chart of this study.
Figure 2
Figure 2
Identification of autophagy-related lncRNAs with significant prognostic value in GC.
Figure 3
Figure 3
The prognostic value of the 5 autophagy-related lncRNAs signature in the train set. (A) The number of patients in the high-risk and low-risk groups ranked by the risk score. (B) The scatter dot plot of GC patients’ survival status. (C) The heatmap of the 5 autophagy-related lncRNAs expression. (D) Kaplan-Meier survival analysis for patients between the high-risk and low-risk groups. (E) The ROC for the autophagy-related lncRNAs signature.
Figure 4
Figure 4
Prognostic analysis of the 5 autophagy-related lncRNAs signature in the test set and the entire set. (A) Distribution of the risk score in the test set. (B) Distribution of the risk score in the entire set. (C) The scatter dot plot of GC patients’ survival status in the test set. (D) The scatter dot plot of GC patients’ survival status in the entire set. (E) The heatmap of the 5 autophagy-related lncRNAs expression in the test set. (F) The heatmap of the 5 autophagy-related lncRNAs expression in the entire set. (G) Kaplan-Meier survival analysis for patients between the high-risk and low-risk groups in the test set. (H) The ROC for the autophagy-related lncRNAs signature in the test set. (I) Kaplan-Meier survival analysis for patients between the high-risk and low-risk groups in the entire set. (J) The ROC for the autophagy-related lncRNAs signature in the test set.
Figure 5
Figure 5
Independent prognostic value of the 5 autophagy-related lncRNAs prognostic signature. (A) The univariate Cox regression analysis of the 5 lncRNAs and clinicopathologic parameters in the train set. (B) The univariate Cox regression analysis of the 5 lncRNAs and clinicopathologic parameters in the test set. (C) The univariate Cox regression analysis of the 5 lncRNAs and clinicopathologic parameters in the entire set. (D) The multivariate Cox regression analysis of the 5 lncRNAs and clinicopathologic parameters in the train set. (E) The multivariate Cox regression analysis of the 5 lncRNAs and clinicopathologic parameters in the test set. (F) The multivariate Cox regression analysis of the 5 lncRNAs and clinicopathologic parameters in the entire set. (G) The ROC analysis of the autophagy-related prognostic signature and clinicopathologic features in the train set. (H) The ROC analysis of the autophagy-related prognostic signature and clinicopathologic features in the test set. (I) The ROC analysis of the autophagy-related prognostic signature and clinicopathologic features in the entire set.
Figure 6
Figure 6
The relationship between the risk score from the autophagy-related lncRNA prognostic signature and clinicopathological features.
Figure 7
Figure 7
The survival differences between high- and low-risk GC patients stratified by clinicopathological characteristics. (AN) The difference in overall survival stratified by age (< 65 and ≥ 65), gender (female and male), grade (low grade and high grade), tumor stage (stage I+II and stage III+IV), T stage (T1+2 and T3+4), N stage (N0+1 and N2+3), M stage (M0, M1) between two groups.
Figure 8
Figure 8
Tumor mutational burden analysis. (A and B) The top 30 mutational genes in the high-risk and low-risk groups.
Figure 9
Figure 9
The association between the risk score and infiltrating immune cells. (A) The ratio differentiation of infiltrating immune cells between the high-risk and low-risk groups. (BD) 3 kinds of infiltrating immune cells associated with the risk score.
Figure 10
Figure 10
The correlation between the risk score and the characterization of tumor immune microenvironment. (A) The value of 25 immune-related signatures between the high-risk and low-risk groups. (B) The heatmap of 25 immune-related signatures. *P < 0.05, **P < 0.01, ***P < 0.001.
Figure 11
Figure 11
LncRNA-mRNA co-expression network and functional enrichment analysis. (A) Construction of the lncRNA-mRNA co-expression network based on 5 autophagy-related lncRNAs. (B) A Sankey diagram showed the correlation of lncRNAs, mRNAs, and risk type. (C) GO analysis of the mRNAs co-expressed with 5 autophagy-related lncRNAs. (D) KEGG analysis of the mRNAs co-expressed with 5 autophagy-related lncRNAs.
Figure 12
Figure 12
The differences and similarities among grouped samples. (A) PCA of the whole-genome expression profiles. (B) PCA of autophagy-related lncRNA set. (C) PCA of the 5 autophagy-related lncRNA prognostic signature.
Figure 13
Figure 13
GSEA of GC patients based on the autophagy-related lncRNA prognostic signature.

References

    1. Sung H, Ferlay J, Siegel RL, et al. Global Cancer Statistics 2020: GLOBOCAN estimates of incidence and mortality worldwide for 36 cancers in 185 countries. CA Cancer J Clin. 2021;71(3):209–249. doi:10.3322/caac.21660 - DOI - PubMed
    1. Smyth EC, Nilsson M, Grabsch HI, van Grieken NC, Lordick F. Gastric cancer. Lancet. 2020;396(10251):635–648. doi:10.1016/S0140-6736(20)31288-5 - DOI - PubMed
    1. Addeo M, Di Paola G, Verma HK, et al. Gastric cancer stem cells: a glimpse on metabolic reprogramming. Front Oncol. 2021;11:698394. doi:10.3389/fonc.2021.698394 - DOI - PMC - PubMed
    1. Verma HK, Falco G, Bhaskar L. Molecular signaling pathways involved in gastric cancer chemoresistance. In: Theranostics Approaches to Gastric and Colon Cancer. Springer; 2020:117–134.
    1. Fu M, Gu J, Jiang P, Qian H, Xu W, Zhang X. Exosomes in gastric cancer: roles, mechanisms, and applications. Mol Cancer. 2019;18(1):41. doi:10.1186/s12943-019-1001-7 - DOI - PMC - PubMed