. 2021 Sep 10:23:241-253.
doi: 10.1016/j.omtm.2021.09.004. eCollection 2021 Dec 10.

Evaluation of two in vitro assays for tumorigenicity assessment of CRISPR-Cas9 genome-edited cells

Affiliations

Evaluation of two in vitro assays for tumorigenicity assessment of CRISPR-Cas9 genome-edited cells

Myriam Lemmens et al. Mol Ther Methods Clin Dev. .

Abstract

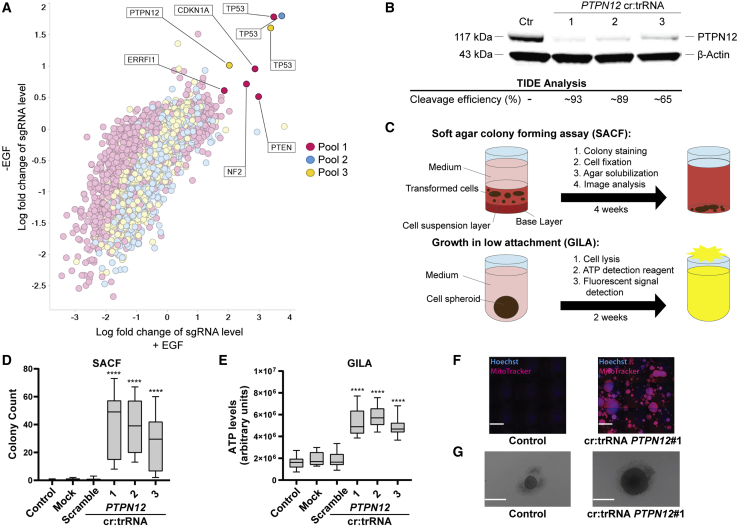
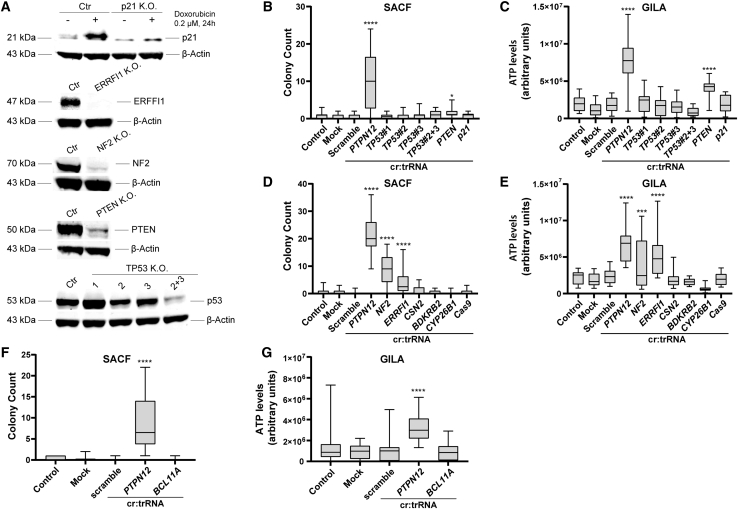
Off-target editing is one of the main safety concerns for the use of CRISPR-Cas9 genome editing in gene therapy. These unwanted modifications could lead to malignant transformation, which renders tumorigenicity assessment of gene therapy products indispensable. In this study, we established two in vitro transformation assays, the soft agar colony-forming assay (SACF) and the growth in low attachment assay (GILA) as alternative methods for tumorigenicity evaluation of genome-edited cells. Using a CRISPR-Cas9-based approach to transform immortalized MCF10A cells, we identified PTPN12, a known tumor suppressor, as a valid positive control in GILA and SACF. Next, we measured the limit of detection for both assays and proved that SACF is more sensitive than GILA (0.8% versus 3.1% transformed cells). We further validated SACF and GILA by identifying a set of positive and negative controls and by testing the suitability of another cell line (THLE-2). Moreover, in contrast to SACF and GILA, an in vivo tumorigenicity study failed to detect the known tumorigenic potential of PTPN12 deletion, demonstrating the relevance of GILA and SACF in tumorigenicity testing. In conclusion, SACF and GILA are both attractive and valuable additions to preclinical safety assessment of gene therapy products.

Keywords: 3Rs; CRISPR-Cas9; anchorage independency; gene therapy; genome editing; in vitro transformation assay; preclinical safety; soft agar.


Conflict of interest statement

M.L., B.F., M.Z., L.R., G.K., A.d.R.-E., F.S., D.M., V.D., A.P., A.M., U.P.-H., U.N., J.H., H.-J.M., and S.L. were employees of the Novartis Institutes for Biomedical Research at the time this research was conducted. A.O. declares no competing interests.

Figures

None
Graphical abstract
Figure 1
Figure 1
Identification and validation of PTPN12 as positive control for SACF and GILA (A) To find genes whose deletion induces hyperproliferation, a genome-wide CRISPR-Cas9 knockout screen was performed. MCF10A Cas9 cells were transduced with three pools of a lentiviral library containing 66,000 sgRNAs each (10 sgRNAs/gene) against approximately 20,000 genes. After 2 weeks, DNA was extracted and analyzed by NGS. The screen was performed in the presence and absence of EGF. Log2 fold change against internal controls of sgRNA levels was calculated to identify inducers of hyperproliferation. (B) Three cr:trRNAs against PTPN12 were electroporated into MCF10A Cas9 cells. 24 h after electroporation, cleavage efficiency was determined by TIDE analysis (lower part). Western blot analysis on protein lysates collected 1 week after electroporation confirmed PTPN12 knockout (upper part). (C) Schematic representation of SACF and GILA. For SACF, 2,500 cells/well were seeded in soft agar. Following 4 weeks of incubation, colonies were stained with Hoechst 33342 (to identify nuclei) and MitoTracker Red CMXRos (for live mitochondria), fixed, agar was solubilized and colonies were counted by a high-content imager. Solubilization was required to allow the colonies to sink to the bottom of the well in one plane, which enabled microscopic analysis. For GILA, 2,500 cells/well were seeded in low-attachment plates and incubated for 2 weeks before ATP level detection. (D and E) 150,000 MCF10A Cas9 cells were electroporated with three different cr:trRNA against PTPN12, and 2,500 cells/well, six wells/condition, were seeded in SACF (D) and GILA (E), respectively. As control samples, we used untreated cells (“Control”), cells electroporated without cr:trRNA (“Mock”), and cells electroporated with a non-targeting scramble cr:trRNA complex (“Scramble”). The data of three independent experiments are shown as boxplots. The boxes describe the inter-quartile range, the whiskers indicate the range from the minimum to the maximum values, and the line is equal to the median. Statistical analysis was performed on three assay repetitions using mixed linear regression models for negative binominal (SACF) or Gaussian distribution (GILA) with a post hoc Holm-Bonferroni p values adjustment. ∗∗∗∗p < 0.001 (Data S1 and S2). The differences between the three independent experiments are represented in Figure S1. (F) Images of control and edited MCF10A Cas9 cells using cr:trRNA PTPN12#1 after 4 weeks in soft agar (montage of nine images, each taken with a 5× objective, wide field mode; scale bars, 1 mm). (G) Spheroids of control and edited MCF10A Cas9 cells grown in low-attachment plates for 2 weeks (images were take with a 4× objective, wide field mode; scale bars, 0.5 mm).
Figure 2
Figure 2
LOD of SACF and GILA (A) The limit of detection (LOD) of SACF and GILA was determined by titrating the amount of cr:trRNA. 150,000 MCF10A Cas9 cells were electroporated with 0.5–12 pmol PTPN12 cr:trRNA, and 2,500 cells/well, six wells per condition, were seeded for GILA and SACF, respectively. The remaining cells were used for cleavage efficiency analysis 24 h after seeding using Sanger sequencing data and TIDE tool. The table shows the cleavage efficiencies from three independent experiments as mean ± standard deviation (SD). (B and C) Cells electroporated with the indicated amount of crRNA:trRNA were seeded in low-attachment plates (GILA; B) or soft agar (SACF, C) and incubated for 2, 3, or 4 weeks to compare and determine the ideal incubation time. (D) Mutation frequencies of cells electroporated with different amounts of PTPN12 cr:trRNA were obtained 24 h after electroporation, after a 2-week incubation in GILA and a 4-week incubation in SACF by using Sanger sequencing data and the TIDE analysis tool. DNA was sequenced in three technical replicates, which are represented in the graph as mean ± SD. (E and F) A pool of stably edited cells for the PTPN12 gene was generated by electroporating MCF10A Cas9 cells with cr:trRNA PTPN12#1 and expanding for 4 weeks before conducting SACF and GILA. The LODs of SACF and GILA were determined by spiking the stable PTPN12-edited cells with parental MCF10A Cas9 cells. 2,500 cells/well were seeded for both SACF and GILA. All p values were calculated using the combined data of three assay repetitions using mixed linear regression models assuming negative binominal distribution for colony count and Gaussian distribution for ATP levels with post hoc Holm-Bonferroni p value adjustment (∗p < 0.05, ∗∗∗∗p < 0.001; see Data S1 and S2). Boxplots represent pooled data of three independent assay repetitions with six technical replicates each. See Figure S3 for a representation of the individual assay repetitions.
Figure 3
Figure 3
Identification of positive and negative control genes for in vitro transformation (A) For each potential positive control, the best cleaving cr:trRNAs from the previously used guide RNA library were selected and tested for protein depletion. 150,000 MCF10A Cas9 cells were electroporated with the cr:trRNA complex and incubated for a week before western blot analysis. Since CDKN1A levels were undetectable in MCF10A Cas9 cells, doxorubicin treatment (0.2 μM, 24 h) was used to induce CDKN1A and confirm its depletion (Ctr = unedited control sample). (B–G) To test the transformation potential of various genes in SACF and GILA, 150,000 cells were electroporated with the corresponding cr:trRNA, and 2,500 cells/well in six replicates were seeded for GILA and SACF. Data of three independent assay repetitions are represented as boxplots. Statistical analysis was performed on the combined data of three assay repetitions using mixed linear regression models for negative binominal (SACF) or Gaussian distribution (GILA) and post hoc Holm-Bonferroni p value adjustment. ∗p < 0.05, ∗∗∗p < 0.005, ∗∗∗∗p < 0.001 (see Data S1 and S2). See Figure S6 for a representation of the individual assay repetitions.
Figure 4
Figure 4
Persistence of MCF10A Cas9 cells in vivo (A–D) PTPN12-edited cells were mixed with MCF10A Cas9 parental cells in different ratios (0%, 6%, 12.5%, 25%, 50%, and 100%) and injected in mammary fat pad (107 cells in total). Mice were sacrificed after 22 weeks and the mammary fat pads were fixed and embedded in paraffin. Histological cross sections were stained with hematoxylin and eosin (A and C) and with an anti-Ku80 antibody (B and D) as a marker for human cells. Ku80-positive cells are shown in brown. Sections of mice injected in the mammary fat pad with 100% control (A and B) or PTPN12-edited MCF10A cells (C and D) are represented (scale bars, 100 μm). See also Figure S9.

References

    1. Corrigan-Curay J., O’Reilly M., Kohn D.B., Cannon P.M., Bao G., Bushman F.D., Carroll D., Cathomen T., Joung J.K., Roth D. Genome editing technologies: defining a path to clinic. Mol. Ther. 2015;23:796–806. - PMC - PubMed
    1. Hsu P.D., Scott D.A., Weinstein J.A., Ran F.A., Konermann S., Agarwala V., Li Y., Fine E.J., Wu X., Shalem O. DNA targeting specificity of RNA-guided Cas9 nucleases. Nat. Biotechnol. 2013;31:827–832. - PMC - PubMed
    1. Fu Y., Foden J.A., Khayter C., Maeder M.L., Reyon D., Joung J.K., Sander J.D. High-frequency off-target mutagenesis induced by CRISPR-Cas nucleases in human cells. Nat. Biotechnol. 2013;31:822–826. - PMC - PubMed
    1. Rezza A., Jacquet C., Le Pillouer A., Lafarguette F., Ruptier C., Billandon M., Isnard Petit P., Trouttet S., Thiam K., Fraichard A., Chérifi Y. Unexpected genomic rearrangements at targeted loci associated with CRISPR/Cas9-mediated knock-in. Sci. Rep. 2019;9:3486. - PMC - PubMed
    1. Kosicki M., Tomberg K., Bradley A. Repair of double-strand breaks induced by CRISPR-Cas9 leads to large deletions and complex rearrangements. Nat. Biotechnol. 2018;36:765–771. - PMC - PubMed

LinkOut - more resources