. 2021 Sep 14:23:151-162.
doi: 10.1016/j.omto.2021.09.002. eCollection 2021 Dec 17.

Transcriptional landscape associated with TNBC resistance to neoadjuvant chemotherapy revealed by single-cell RNA-seq

Affiliations

Transcriptional landscape associated with TNBC resistance to neoadjuvant chemotherapy revealed by single-cell RNA-seq

Radhakrishnan Vishnubalaji et al. Mol Ther Oncolytics. .

Abstract

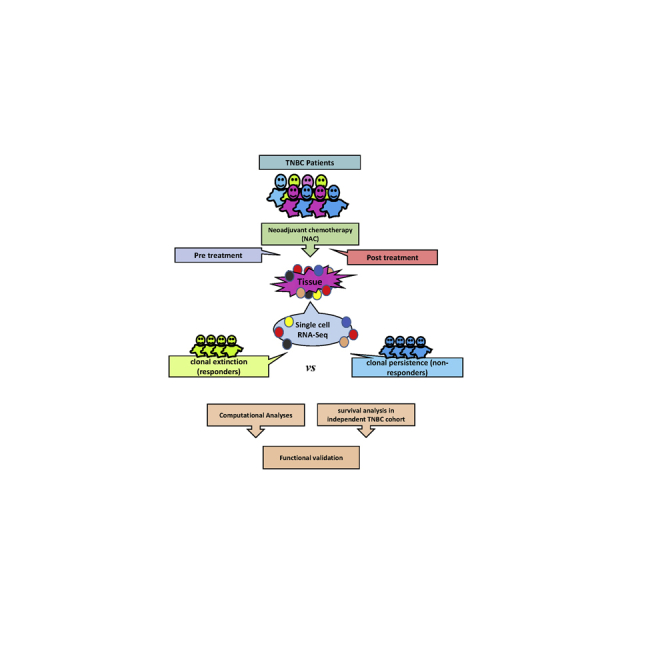
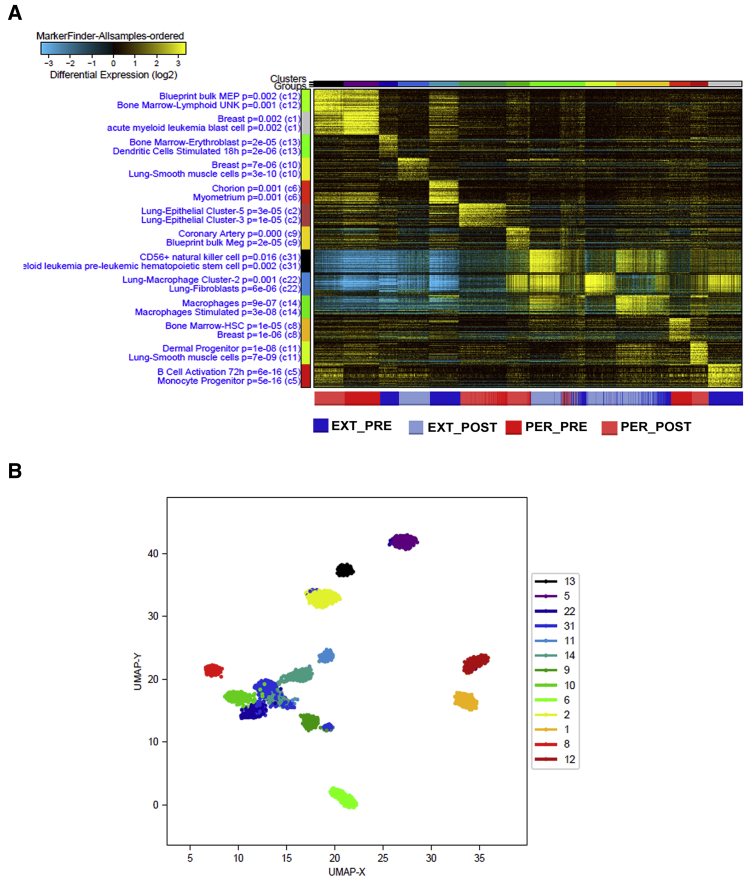
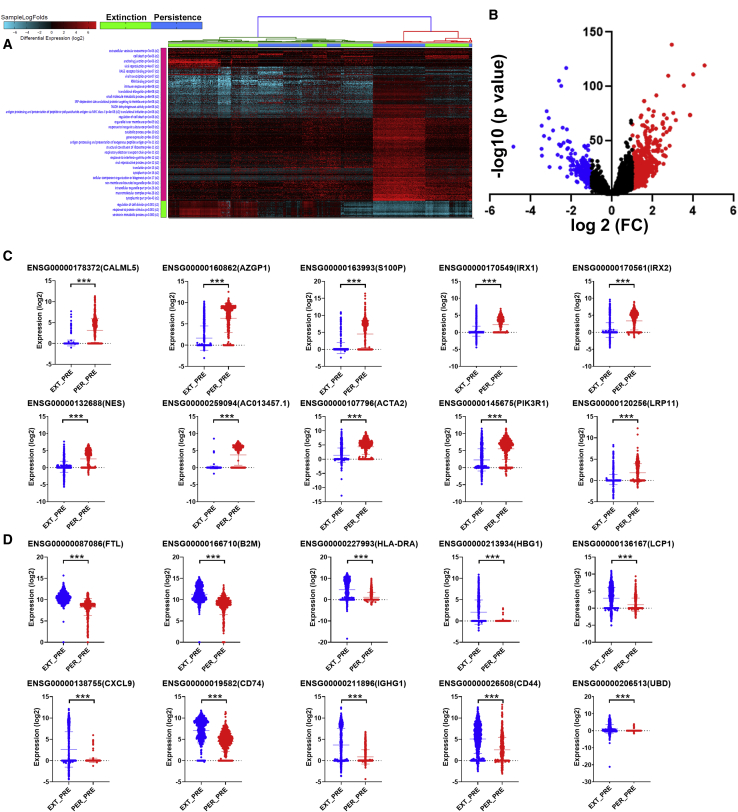
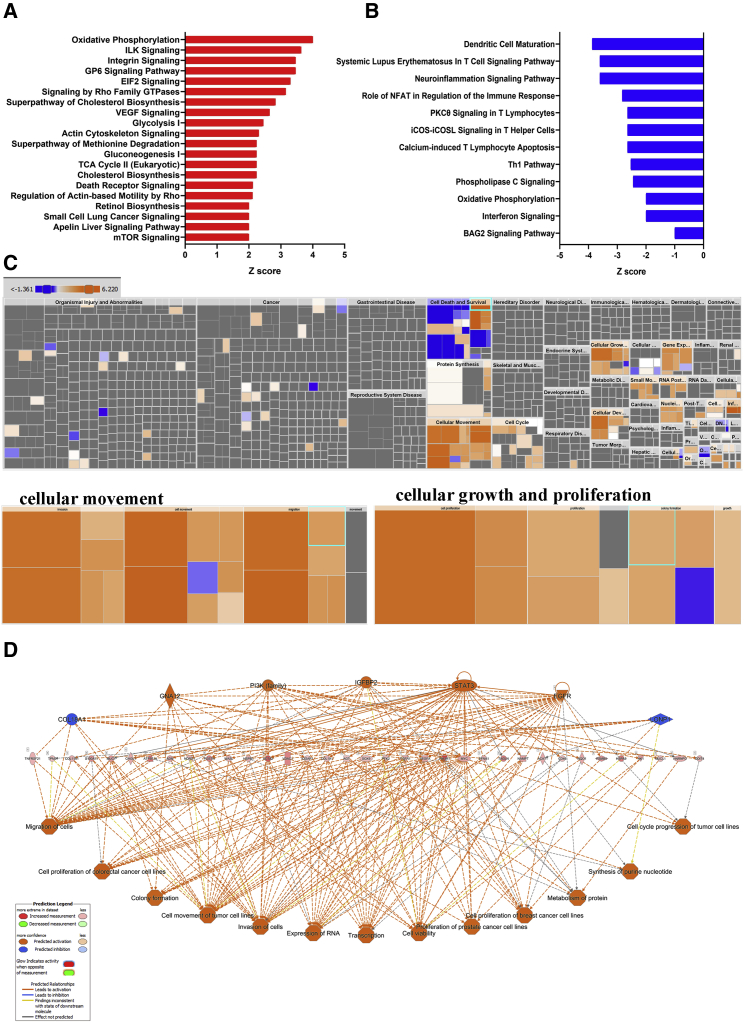
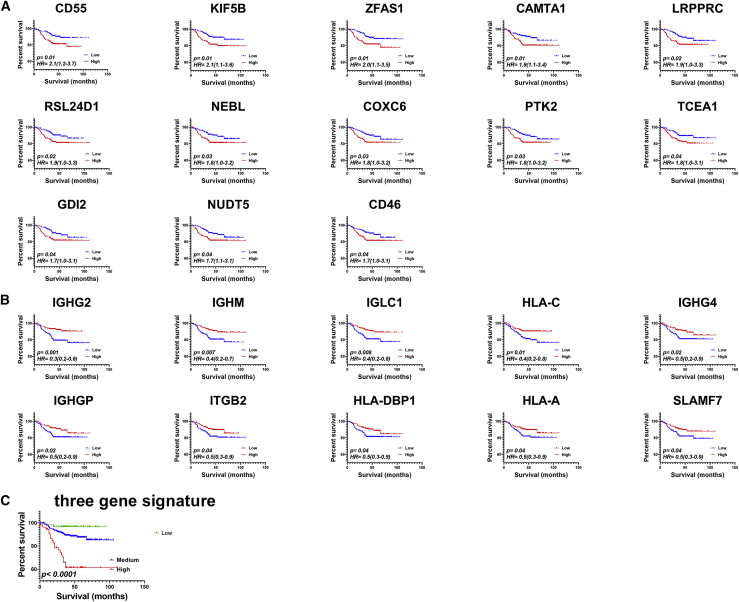
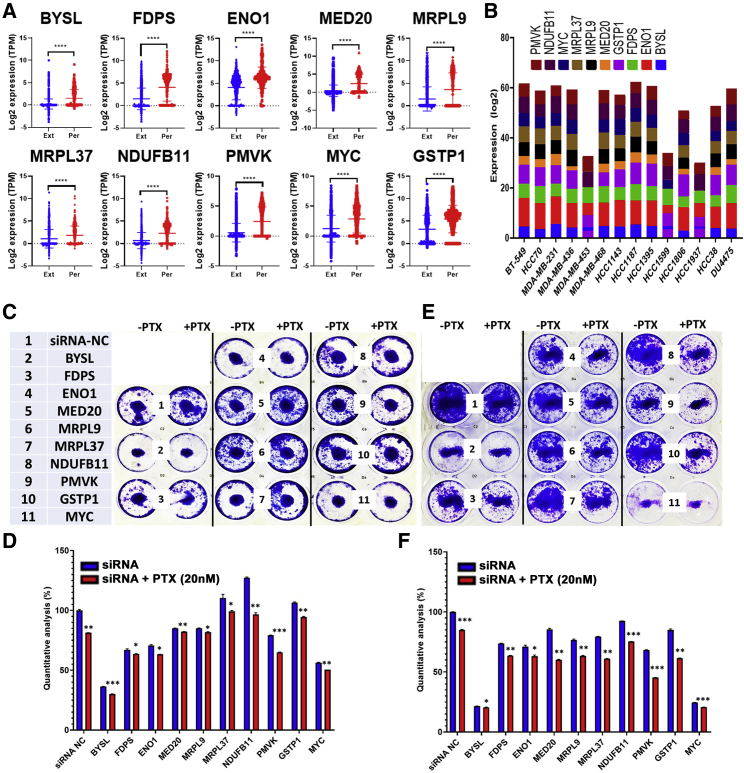
Triple-negative breast cancer (TNBC) resistance to neoadjuvant chemotherapy (NAC) represents a major clinical challenge; therefore, delineating tumor heterogeneity can provide novel insight into resistance mechanisms and potential therapeutic targets. Herein, we identified the transcriptional landscape associated with TNBC resistance to NAC at the single-cell level by analyzing publicly available transcriptome data from more than 5,000 single cells derived from four extinction (responders) and four persistence (non-responders) patients, revealing remarkable tumor heterogeneity. Employing iterative clustering and guide-gene selection (ICGS) and uniform manifold approximation and projection (UMAP), we classified TNBC single cells into several clusters based on their distinct gene signatures. The presence of clusters indicative of immune cell activation was a hallmark of the extinction group pre-NAC, while post NAC, the extinction tissue consisted mostly of breast, omental fat, and fibroblasts. The persistent gene signatures of pre-NAC resembled the gene signature of lung epithelial, mammary, and salivary glands and acute myeloid leukemia blast cells, which were associated with enhanced cellular movement and activation of FOXM1, NOTCH1, and MYC and suppression of tumor necrosis factor (TNF) and IFNG mechanistic networks. Multivariate survival analysis identified persistence-derived three-gene signature (KIF5BhighHLA-ClowIGHG2low) predictive of relapse-free survival (hazard ratio [HR]: 2.2 [1.6-3.2, p < 0.0001]) in a second cohort of 360 TNBC patients. Mechanistically, loss of function of several upregulated genes in the persistent group (BYSL, FDPS, ENO1, MED20, MRPL9, MRPL37, NDUFB11, PMVK, MYC, and GSTP1) inhibited MDA-MB-231 and BT-549 TNBC models' colony-forming unit (CFU) potential and enhanced their sensitivity to paclitaxel. Our data unraveled the transcriptional portrait associated with NAC resistance, identified several key genes, and suggested their potential utilization as prognostic markers and therapeutic targets in TNBC.

Keywords: NAC; TNBC; gene signature; neoadjuvant chemotherapy; resistance; single cell; triple-negative breast cancer.


Conflict of interest statement

The authors declare no competing interests.

Figures

None
Graphical abstract
Figure 1
Figure 1
Heterogeneity of TNBC single cells revealed through ICGS2 and UMAP dimensionality reduction analysis of TNBC-derived single cells pre- and post-NAC (A) Unsupervised single-cell population identification using ICGS2 algorithm conducted on 719 extinction (responders) and 525 persistence (non-responders) single cells pre-NAC and 894 extinction (responders) and 687 persistence (non-responders) single cells post-NAC. Data are presented as heatmap with the enriched cell population indicated on the left legend and the corresponding single-cell cluster on top. Color scale displays differential gene expression (log2). Lower legend indicated cell origin. (B) UMAP dimensionality reduction analysis revealing 13 cell clusters pre- and post-NAC. EXT_POST, extinction post-NAC; EXT_PRE, extinction pre-NAC; PER_PRE, persistence pre-NCA; PER_POST, persistence post-NAC.
Figure 2
Figure 2
Comparative analysis of the transcriptional landscape in persistence and extinction TNBC-derived single cells pre-NAC (A) Hierarchical clustering of TNBC-derived single cells from persistence (n = 534) and extinction (n = 781) group pre-NAC. Each column represents one cell, and each row represents a gene. Expression level of each gene (log2) in a single cell is depicted according to the color scale. (B) Volcano plot illustrating the upregulated (red) and downregulated (blue) genes in the persistence versus extinction group pre-NAC. Validation of top 10 upregulated (C) and top 10 downregulated (D) genes in a second cohort consisting of 782 extinction and 535 persistence TNBC-derived single cells.
Figure 3
Figure 3
Ingenuity pathway analysis (IPA) of differentially expressed genes in persistence versus extinction group Enriched canonical pathways based on upregulated (A) and downregulated (B) genes in persistence versus extinction TNBC groups. (C) Tree map (hierarchical heatmap) depicting affected functional categories based on upregulated genes where the major boxes represent a category of diseases and function. Illustration of cellular movement and cell growth and proliferation are shown in the lower panels. (D) Regulator effects network analysis based on IPA highlighting a role for activated (GNA12, PI3K family, IGFBP2, STAT3, and EGFR) and suppressed (COL18A1 and LONP1) upstream regulators and their roles in divining tumorigenic function.
Figure 4
Figure 4
Immune infiltration is the hallmark of the extinction group (A) Tree map (hierarchical heatmap) depicting affected functional categories based on downregulated genes in the persistence group (upregulated in the extinction group) where the major boxes represent a category of diseases and function. Illustration of immune cell trafficking and cell-to-cell signaling and interaction are shown in the lower panels. (B) The expression of CD19, CD8A, CD4, CD52, CD2, CD53, CD59, CD47, CD74, and CXCL9 in the extinction (EXT) compared with the persistence (PER) group pre- and post-NAC. ∗p < 0.01, ∗∗p < 0.001, ∗∗∗p < 0.0001. Tree map (hierarchical heatmap) depicting activation of immune cell trafficking (C) and hematological system development and function (D).
Figure 5
Figure 5
Univariate and multivariate recurrence-free survival analysis in 360 TNBC patients A cohort of 360 patients were divided into high and low based on median gene expression derived from the persistence (A) or extinction (B) groups using Kaplan-Meier survival analysis. Hazard ratio and log rank p value are indicated on each plot. (C) The prognostic value of three-gene signature (KIF5BhighHLA-ClowIGHG2low) is indicated.
Figure 6
Figure 6
Targeted depletion of selected persistence-derived genes inhibits TNBC CFU potential in vitro (A) Expression of BYSL, FDPS, ENO1, MED20, MRPL9, MRPL9, NDUFB11, PMVK, MYC, and GSTP1 in a second cohort of single cells derived from the persistence (782 cells) and the extinction (535 cells) TNBC. (B) Expression of the selected 10 genes in a panel of TNBC cell lines from the CCLE database. Clonogenic potential of MDA-MB-231 (C and D) or BT-549 (E and F) after transfection with the indicated siRNA as single agent or in combination with paclitaxel (PTX; 20 nM). Data are representative of two experiments conducted in duplicate.

References

    1. Siegel R.L., Miller K.D., Jemal A. Cancer statistics, 2015. CA Cancer J. Clin. 2015;65:5–29. - PubMed
    1. Paik S., Shak S., Tang G., Kim C., Baker J., Cronin M., Baehner F.L., Walker M.G., Watson D., Park T. A multigene assay to predict recurrence of tamoxifen-treated, node-negative breast cancer. N. Engl. J. Med. 2004;351:2817–2826. - PubMed
    1. Ellsworth R.E., Blackburn H.L., Shriver C.D., Soon-Shiong P., Ellsworth D.L. Molecular heterogeneity in breast cancer: State of the science and implications for patient care. Semin. Cell Dev. Biol. 2017;64:65–72. - PubMed
    1. Hamam R., Hamam D., Alsaleh K.A., Kassem M., Zaher W., Alfayez M., Aldahmash A., Alajez N.M. Circulating microRNAs in breast cancer: novel diagnostic and prognostic biomarkers. Cell Death Dis. 2017;8:e3045. - PMC - PubMed
    1. Sikov W.M., Berry D.A., Perou C.M., Singh B., Cirrincione C.T., Tolaney S.M., Kuzma C.S., Pluard T.J., Somlo G., Port E.R. Impact of the addition of carboplatin and/or bevacizumab to neoadjuvant once-per-week paclitaxel followed by dose-dense doxorubicin and cyclophosphamide on pathologic complete response rates in stage II to III triple-negative breast cancer: CALGB 40603 (Alliance) J. Clin. Oncol. 2015;33:13–21. - PMC - PubMed