No evidence for global decrease in CO2 concentration during the first wave of COVID-19 pandemic
- PMID: 34704116
- PMCID: PMC8548065
- DOI: 10.1007/s10661-021-09541-w
No evidence for global decrease in CO2 concentration during the first wave of COVID-19 pandemic
Abstract
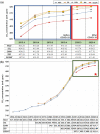
Numerous studies have reported that CO2 emissions have decreased because of global lockdown during the first wave of the COVID-19 pandemic. However, previous estimates of the global CO2 concentration before and after the outbreak of the COVID-19 pandemic are limited because they are based on energy consumption statistics or local specific in-situ observations. The aim of the study was to explore objective evidence for various previous studies that have claimed the global CO2 concentration decreased during the first wave of the COVID-19 pandemic. There are two ways to measure the global CO2 concentration: from the top-down using satellites and the bottom-up using ground stations. We implemented the time-series analysis by comparing the before and after the inflection point (first wave of COVID-19) with the long-term CO2 concentration data obtained from World Meteorological Organization Global Atmosphere Watch (WMO GAW) and Greenhouse Gases Observing Satellite (GOSAT). Measurements from the GOSAT and GAW global monitoring stations show that the CO2 concentrations in Europe, China, and the USA have continuously risen in March and April 2020 compared with the same months in 2019. These data confirm that the global lockdown during the first wave of the COVID-19 pandemic did not change the vertical CO2 profile at the global level from the ground surface to the upper layer of the atmosphere. The results of this study provide an important foundation for the international community to explore policy directions to mitigate climate change in the upcoming post-COVID-19 period.
Keywords: COVID-19; Carbon budget; CO2 profile; Corona; GOSAT (Greenhouse Gases Observing Satellite); Global Atmosphere Watch (GAW); World Meteorological Organization (WMO).
© 2021. The Author(s), under exclusive licence to Springer Nature Switzerland AG.
Conflict of interest statement
The authors declare no competing interests.
Figures


References
-
- Chatterjee, A., Gierach, M. M., Sutton, A. J., Feely, R. A., Crisp, D., Eldering, A., Gunson, M. R., O’Dell, C. W., Stephens, B. B., & Schimel, D. S. (2017). Influence of El Niño on atmospheric CO2 over the tropical Pacific Ocean: findings from NASA’s OCO-2 mission. Science, 358(6360), eaam5776. 10.1126/science.aam5776 - PMC - PubMed
-
- Dario Papale1, Antoniella, G., Nicolini, G., Gioli, B., Zaldei, A., Vogt, R., Feigenwinter, C., Stagakis, S., Chrysoulakis, N., Järvi, L., Nemitz, E., Helfter, C., Barlow, J., Meier, F., Velasco, E., Christen, A., & Masson, V. (2020). Clear evidence of reduction in urban CO2 emissions as a result of COVID-19 lockdown across Europe. ICOS. https://data.icos-cp.eu/objects/w6pTmRGYKqAm3c-siQrg5kgd
-
- Eggleston, S., Buendia, L., Miwa, K., Ngara, T., & Tanabe, K. (2006). 2006 IPCC guidelines for national greenhouse gas inventories (Vol. 5). Institute for Global Environmental Strategies Hayama, Japan.
MeSH terms
Substances
LinkOut - more resources
Full Text Sources
Medical
Miscellaneous

