. 2021 Oct 31;9(2):e0141621.
doi: 10.1128/Spectrum.01416-21. Epub 2021 Oct 27.

Mapping SARS-CoV-2 Antibody Epitopes in COVID-19 Patients with a Multi-Coronavirus Protein Microarray

Affiliations

Mapping SARS-CoV-2 Antibody Epitopes in COVID-19 Patients with a Multi-Coronavirus Protein Microarray

David Camerini et al. Microbiol Spectr. .

Abstract

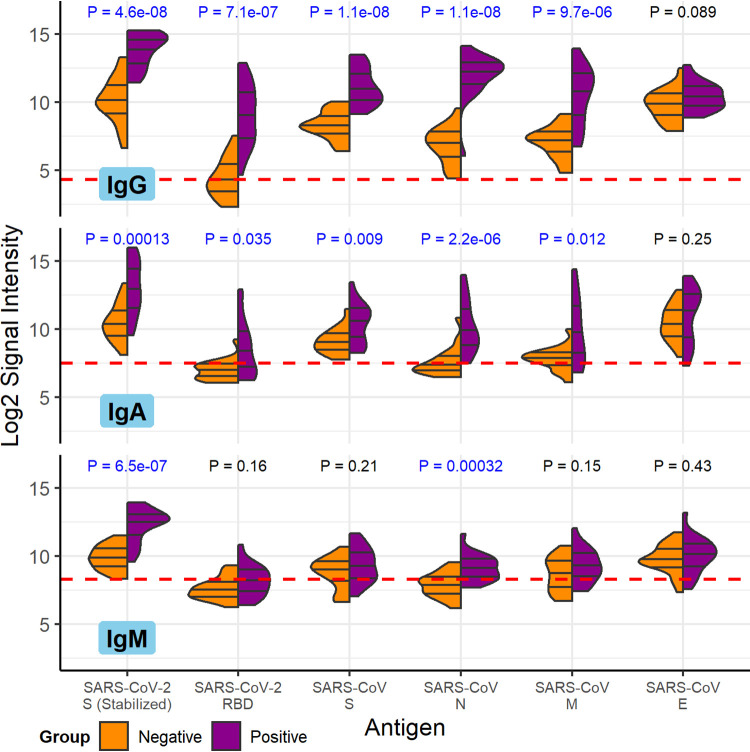
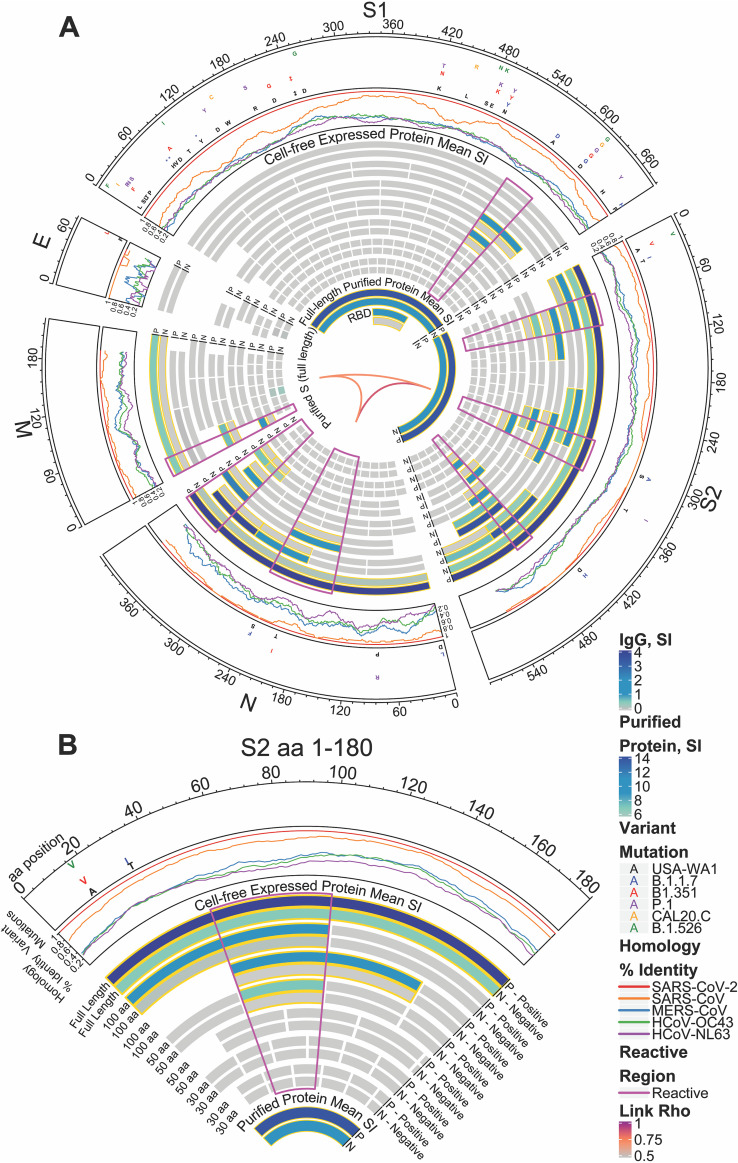
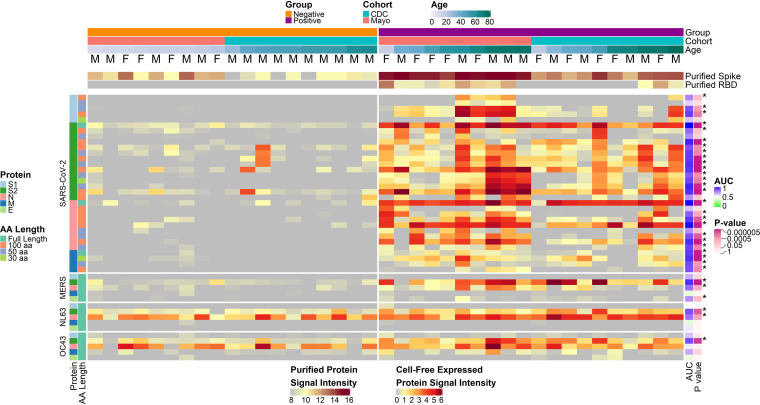
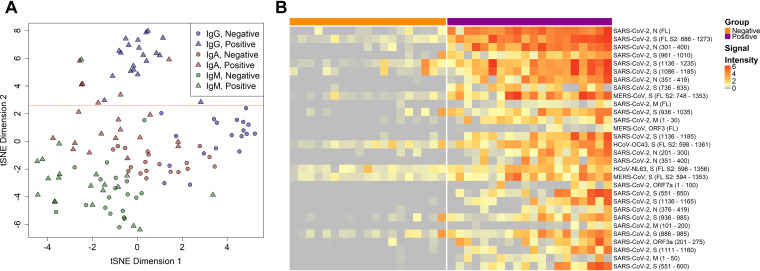
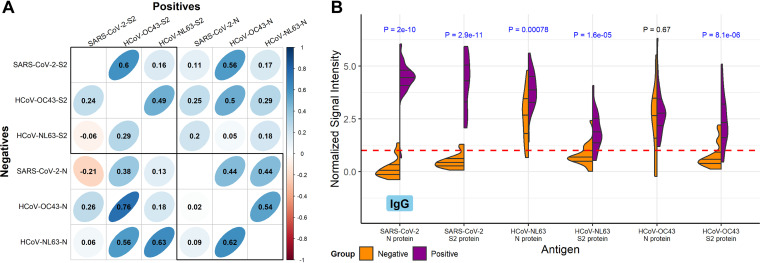
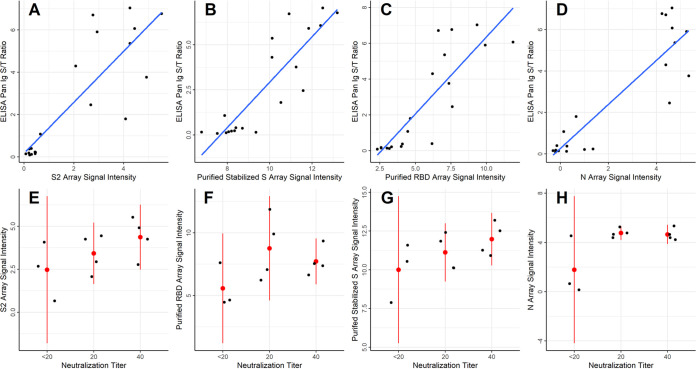
The rapid worldwide spread of SARS-CoV-2 has accelerated research and development for controlling the COVID-19 pandemic. A multi-coronavirus protein microarray was created containing full-length proteins, overlapping protein fragments of various lengths, and peptide libraries from SARS-CoV-2 and four other human coronaviruses. Sera from confirmed COVID-19 patients as well as unexposed individuals were applied to multicoronavirus arrays to identify specific antibody reactivity. High-level IgG, IgM, and IgA reactivity to structural proteins S, M, and N of SARS-CoV-2, as well as accessory proteins such as ORF3a and ORF7a, were observed that were specific to COVID-19 patients. Antibody reactivity against overlapping 100-, 50-, and 30-amino acid fragments of SARS-CoV-2 proteins was used to identify antigenic regions. Numerous proteins of SARS-CoV, Middle East respiratory syndrome coronavirus (MERS-CoV), and the endemic human coronaviruses HCoV-NL63 and HCoV-OC43 were also more reactive with IgG, IgM, and IgA in COVID-19 patient sera than in unexposed control sera, providing further evidence of immunologic cross-reactivity between these viruses. Whereas unexposed individuals had minimal reactivity against SARS-CoV-2 proteins that poorly correlated with reactivity against HCoV-NL63 and HCoV-OC43 S2 and N proteins, COVID-19 patient sera had higher correlation between SARS-CoV-2 and HCoV responses, suggesting that de novo antibodies against SARS-CoV-2 cross-react with HCoV epitopes. Array responses were compared with validated spike protein-specific IgG enzyme-linked immunosorbent assays (ELISAs), showing agreement between orthologous methods. SARS-CoV-2 microneutralization titers were low in the COVID-19 patient sera but correlated with array responses against S and N proteins. The multi-coronavirus protein microarray is a useful tool for mapping antibody reactivity in COVID-19 patients. IMPORTANCE With novel mutant SARS-CoV-2 variants of concern on the rise, knowledge of immune specificities against SARS-CoV-2 proteins is increasingly important for understanding the impact of structural changes in antibody-reactive protein epitopes on naturally acquired and vaccine-induced immunity, as well as broader topics of cross-reactivity and viral evolution. A multi-coronavirus protein microarray used to map the binding of COVID-19 patient antibodies to SARS-CoV-2 proteins and protein fragments as well as to the proteins of four other coronaviruses that infect humans has shown specific regions of SARS-CoV-2 proteins that are highly reactive with patient antibodies and revealed cross-reactivity of these antibodies with other human coronaviruses. These data and the multi-coronavirus protein microarray tool will help guide further studies of the antibody response to COVID-19 and to vaccination against this worldwide pandemic.

Keywords: COVID-19; HCoV; SARS-CoV-2; antibody binding sites.


Figures

FIG 1
FIG 1
COVID-19 patient and healthy control antibody reactivity with purified SARS-CoV-2 and SARS-CoV proteins. The split violin plot shows the log2-transformed fluorescence signal intensity distribution of antibodies bound to each purified protein on the multi-coronavirus protein microarray. Within each half-violin are three lines representing the interquartile range and the median. Above each split violin is the Wilcoxon rank sum P value, colored blue for significant P values below 0.05. The three panels are split by isotype (IgG, top; IgA, middle; IgM, bottom). Horizontal red dashed lines are drawn at the median of all signal intensities against purified proteins (n = 14) and peptides (n = 587) plus 1.0, i.e., double the global median; this threshold serves as a point of reference but not necessarily a seropositivity cutoff for each protein.
FIG 2
FIG 2
Reactivity of COVID-19 patient and healthy donor IgG to SARS-CoV-2 proteins and protein fragments. (A) The circular graphic maps the amino acid (aa) position of SARS-CoV-2 fragments, showing a heat map of IgG levels in each group for overlapping regions of different amino acid length. Proteins are indicated outside the circle plot, followed by a line graph showing the sequence homology of other CoVs with SARS-CoV-2 for each gene. Mutations, relative to the USA-WA1 strain, found in circulating mutant virus strains are shown in the next circular segment. Proteins and protein fragments produced in vitro are indicated by bars and show the length and position of each fragment in each protein. Each fragment is drawn twice and shows the group mean normalized log2 signal intensity of IgG binding to each fragment for COVID-19-positive samples (P) and negative-control sera (N). The purified full-length S protein and the receptor binding domain (RBD) are shown for comparison. IgG signal intensity is shown by color gradient, from gray to blue. Bar pairs shown with a gold outline represent significantly differential IgG binding between COVID-19 patients and healthy controls, defined as a mean log2 signal intensity of ≥0.1 in at least one group and a t test P value of ≤0.05. The regions of greatest reactivity for each protein are outlined in magenta. The Pearson’s correlation coefficients (“Rho”) between each full-length protein for IgG binding are shown as links between protein sectors in the center of the circle. (B) A slice of the circular graphic is amplified and labeled in more detail as a guide to interpreting the full figure. The first 180-aa sequence of S2 is shown.
FIG 3
FIG 3
COVID-19-positive and -negative sample IgG reactivity to coronavirus proteins and protein fragments produced in vitro. The heatmaps present the signals of IgG binding to individual proteins and protein fragments within the antigenic regions of SARS-CoV-2, as well as the full-length structural proteins of MERS-CoV, HCoV-NL63, and HCoV-OC43 for individual samples. Columns represent serum samples ordered by increasing age within group and cohort, and rows represent proteins or protein fragments, including 32 SARS-CoV-2 proteins or fragments and 5 proteins each of MERS-CoV, HCoV-OC43, and HCoV-NL63. IgG signal intensity is shown on a color scale from gray to red. Sample information is overlaid above the heatmaps and includes sex (M/F), group (negative or positive), cohort (CDC or Mayo), and age (years). Protein/fragment information is annotated to the left of the heatmaps and includes the virus, the full-length protein name, and the amino acid length of the protein fragments (“AA Length,” as full length, 100, 50, or 30 aa). The receiver operating characteristic area under the curve (AUC) and the unadjusted t test P value for each protein between negatives and positives are shown to the right of the heatmap. Asterisks next to the P values represent adjusted P values of <0.05.
FIG 4
FIG 4
IgG responses give the best delineation of COVID-19 patient sera from healthy donor sera. (A) The IgG, IgA, and IgM responses against the 30 most reactive IVTT proteins by means of all samples and isotypes were projected for each sample across two dimensions using t-distributed stochastic neighbor embedding (tSNE). Points represent individual samples and are colored according to the isotype measurement. The shape represents the group in which the sample belonged, either the negative healthy donor group or the positive COVID-19 patient group. The horizontal red dashed line (y = 2.6) separates the IgG responses in negative and positive individuals. (B) The heatmap shows the 30 most differentially reactive IgG responses to IVTT proteins between the negative and positive groups. Columns represent serum samples, separated by group with colored headers. Rows represent full-length or fragmented proteins produced by cell-free expression in vitro. The protein annotations to the right of the heatmap denote the virus, protein, and in parentheses, the amino acid range of the fragment or full-length “FL” protein. Normalized log2 signal intensity is displayed on a gray to red color scale.
FIG 5
FIG 5
Correlation and concordance between IgG responses to SARS-CoV-2 and endemic human coronavirus N and S2 proteins. (A) The correlogram shows the Pearson’s correlation coefficient (ρ) between IgG normalized signal intensity to SARS-CoV-2, HCoV-OC43, and HCoV-NL63 N and S2 full-length proteins produced in vitro. The lower half of the diagonal shows the correlation between reactivity of sera in the negative group, and the upper half of the diagonal shows the positive group serum correlations. The color scale indicates positive correlation in darker shades of blue and negative correlation in darker shades of red, and ρ is overlaid on each comparison. Additionally, the narrowness and slope of the ellipses represent increasing positive or negative correlation. Boxes are drawn around the intra-S2 and intra-N protein comparisons. (B) The split violin plot shows the normalized log2 IgG signal intensity distribution for each N and S2 protein produced in vitro. Within each half-violin are three lines representing the interquartile range and the median. Above each split violin is the Wilcoxon rank sum P value, colored blue for significant P values below 0.05. The red dashed line represents the 1.0 seropositivity cutoff.
FIG 6
FIG 6
Correlation of IVTT and purified protein microarray results with ELISA and virus neutralization assays. (A to D) The scatterplots show the SARS-CoV-2 S protein-based ELISA Pan Ig signal/threshold ratio (y axis) plotted against the protein microarray log2 normalized IgG signal intensity for S2 and N proteins produced in vitro, as well as for the stabilized, purified full-length S protein and the purified RBD fragment of S1 protein (x axis), respectively. The blue lines were fit to the data using linear regression. (E to H) The dot plots show individual values of each patient for the protein microarray log2 normalized IgG binding intensity (y axis) of the four proteins shown in panels A to D at each neutralization titer (x axis). Red dots are plotted at the means of each stratum, and the red lines represent the 95% confidence intervals.

References

    1. WHO Director-General's opening remarks at the media briefing on COVID-19 - 11 March 2020. https://www.who.int/director-general/speeches/detail/who-director-genera....
    1. Kissler S, Tedijanto C, Goldstein E, Grad Y, Lipsitch M. 2020. Projecting transmission dynamics of SARS-CoV-2 through the postpandemic period. Science 368:860–868. doi:10.1126/science.abb5793. - DOI - PMC - PubMed
    1. Verity R, Okell LC, Dorigatti I, Winskill P, Whittaker C, Imai N, Cuomo-Dannenburg G, Thompson H, Walker PGT, Fu H, Dighe A, Griffin JT, Baguelin M, Bhatia S, Boonyasiri A, Cori A, Cucunubá Z, FitzJohn R, Gaythorpe K, Green W, Hamlet A, Hinsley W, Laydon D, Nedjati-Gilani G, Riley S, van Elsland S, Volz E, Wang H, Wang Y, Xi X, Donnelly CA, Ghani AC, Ferguson NM. 2020. Estimates of the severity of coronavirus disease 2019: a model-based analysis. Lancet Infect Dis 20:669–677. doi:10.1016/S1473-3099(20)30243-7. - DOI - PMC - PubMed
    1. Long Q-X, Liu B-Z, Deng H-J, Wu G-C, Deng K, Chen Y-K, Liao P, Qiu J-F, Lin Y, Cai X-F, Wang D-Q, Hu Y, Ren J-H, Tang N, Xu Y-Y, Yu L-H, Mo Z, Gong F, Zhang X-L, Tian W-G, Hu L, Zhang X-X, Xiang J-L, Du H-X, Liu H-W, Lang C-H, Luo X-H, Wu S-B, Cui X-P, Zhou Z, Zhu M-M, Wang J, Xue C-J, Li X-F, Wang L, Li Z-J, Wang K, Niu C-C, Yang Q-J, Tang X-J, Zhang Y, Liu X-M, Li J-J, Zhang D-C, Zhang F, Liu P, Yuan J, Li Q, Hu J-L, Chen J, et al. . 2020. Antibody responses to SARS-CoV-2 in patients with COVID-19. Nat Med 26:845–848. doi:10.1038/s41591-020-0897-1. - DOI - PubMed
    1. Zhao J, Yuan Q, Wang H, Liu W, Liao X, Su Y, Wang X, Yuan J, Li T, Li J, Qian S, Hong C, Wang F, Liu Y, Wang Z, He Q, Li Z, He B, Zhang T, Fu Y, Ge S, Liu L, Zhang J, Xia N, Zhang Z. 2020. Antibody responses to SARS-CoV-2 in patients with novel coronavirus disease 2019. Clin Infect Dis 71:2027–2034. doi:10.1093/cid/ciaa344. - DOI - PMC - PubMed

MeSH terms

LinkOut - more resources