. 2021 Dec;78(23):7693-7707.
doi: 10.1007/s00018-021-03978-5. Epub 2021 Oct 27.

Metabolic regulation of RA macrophages is distinct from RA fibroblasts and blockade of glycolysis alleviates inflammatory phenotype in both cell types

Affiliations

Metabolic regulation of RA macrophages is distinct from RA fibroblasts and blockade of glycolysis alleviates inflammatory phenotype in both cell types

Sadiq Umar et al. Cell Mol Life Sci. 2021 Dec.

Abstract

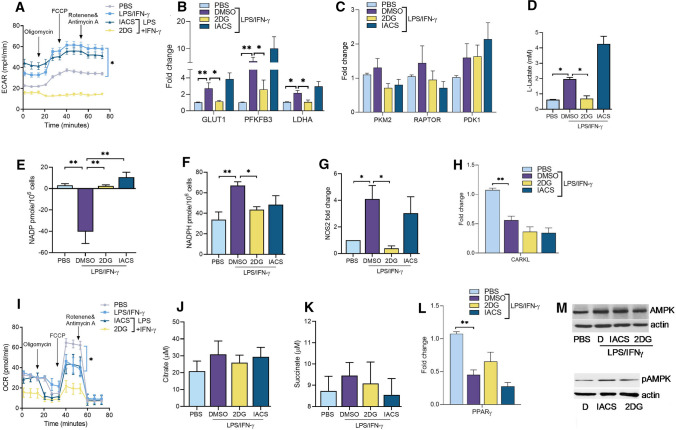
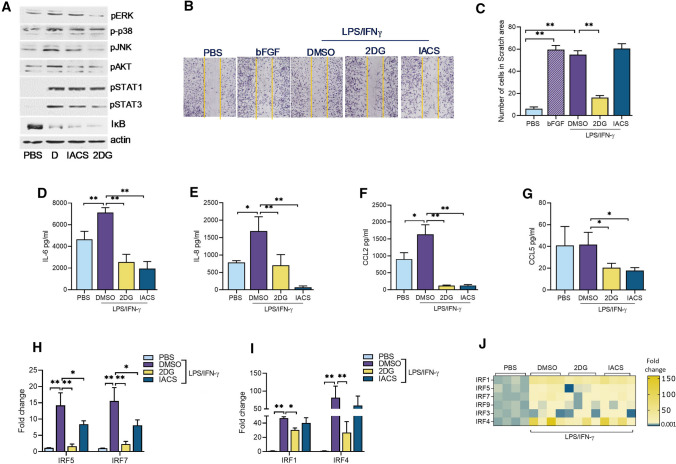
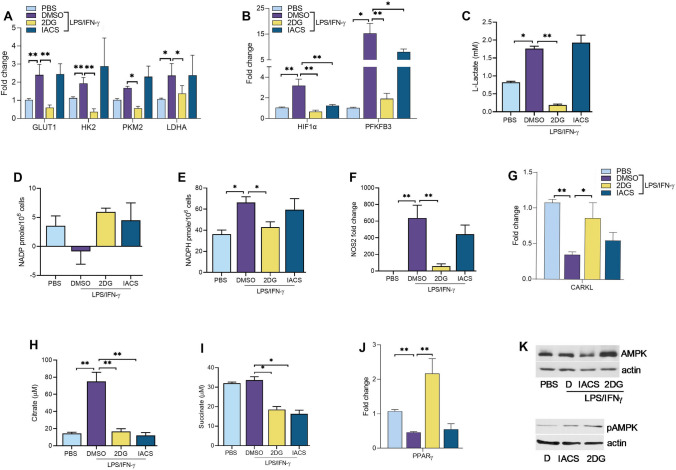
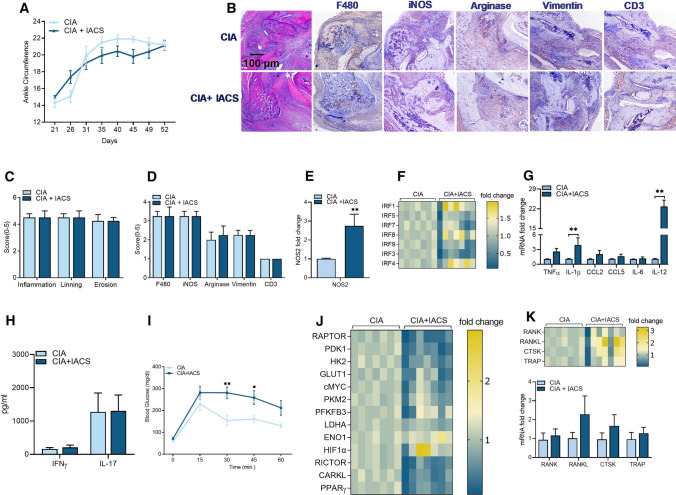
Recent studies have shown the significance of metabolic reprogramming in immune and stromal cell function. Yet, the metabolic reconfiguration of RA macrophages (MΦs) is incompletely understood during active disease and in crosstalk with other cell types in experimental arthritis. This study elucidates a distinct regulation of glycolysis and oxidative phosphorylation in RA MΦs compared to fibroblast (FLS), although PPP (Pentose Phosphate pathway) is similarly reconfigured in both cell types. 2-DG treatment showed a more robust impact on impairing the RA M1 MΦ-mediated inflammatory phenotype than IACS-010759 (IACS, complexli), by reversing ERK, AKT and STAT1 signaling, IRF8/3 transcription and CCL2 or CCL5 secretion. This broader inhibitory effect of 2-DG therapy on RA M1 MΦs was linked to dysregulation of glycolysis (GLUT1, PFKFB3, LDHA, lactate) and oxidative PPP (NADP conversion to NADPH), while both compounds were ineffective on oxidative phosphorylation. Distinctly, in RA FLS, 2-DG and IACS therapies constrained LPS/IFNγ-induced AKT and JNK signaling, IRF5/7 and fibrokine expression. Disruption of RA FLS metabolic rewiring by 2-DG or IACS therapy was accompanied by a reduction of glycolysis (HIF1α, PFKFB3) and suppression of citrate or succinate buildup. We found that 2-DG therapy mitigated CIA pathology by intercepting joint F480+iNOS+MΦ, Vimentin+ fibroblast and CD3+T cell trafficking along with downregulation of IRFs and glycolytic intermediates. Surprisingly, IACS treatment was inconsequential on CIA swelling, cell infiltration, M1 and Th1/Th17 cytokines (IFN-γ/IL-17) and joint glycolytic mediators. Collectively, our results indicate that blockade of glycolysis is more effective than inhibition of complex 1 in CIA, in part due to its effectiveness on the MΦ inflammatory phenotype.

Keywords: Glycolysis; Mitochondrial oxidative phosphorylation and CIA; RA FLS; RA macrophages.


Conflict of interest statement

The authors have declared that no commercial or financial conflict of interest exists.

Figures

Fig. 1
Fig. 1
2-DG therapy strongly reverses RA M1 MΦ differentiation. A RA MΦs were pretreated with DMSO (D), 2-DG (5 mM) or IACS (100 nM) o/n before treating the cells with PBS or LPS/IFNγ (100 ng/ml each) for 30 min (timepoint was selected based on the earlier findings shown in Suppl-C4). Lysates were probed for pERK, p-p38, pJNK, pAKT, pSTAT1, pSTAT3 or degradation of IκB (1:1000, Cell signaling) and normalized to actin (1:5000, Santa Cruz Biotechnology) (density quantified in Suppl-B1), n = 4. RA MΦs pretreated with DMSO (D), 2-DG (5 mM) or IACS (100 nM) o/n were untreated (PBS) or stimulated with LPS/IFNγ (100 ng/ml each) for 24 h before measuring the protein levels of TNFα (B), CCL2 (C), CCL5 (D), IL-6 (E) by ELISA or treated for 6 h before analyzing the transcription levels of IRF1/5 (F), IRF8/3 (G) and IRFs (H) by real-time RT-PCR, n = 5–6. The data are shown as mean ± SEM, *represents p < 0.05 and ** denotes p < 0.01
Fig. 2
Fig. 2
Treatment with 2-DG but not IACS negates glycolysis and PPP in RA M1 MΦs. The effect of 2-DG (10 mM) or IACS (1000 nM) was examined on the glycolytic capacity (ECAR, A) and oxygen consumption (OCR, I) of control and (1000 ng/ml each) LPS/IFNγ-stimulated RAW cells (5 × 103 cells/well) using the Cell Energy Phenotype Test Kit (103325-100; Agilent Technologies) as per manufacturer’s instructions, n = 5–6. Cells were preconditioned with the inhibitors and stimuli in 0% FBS/DMEM for 24 h before ECAR and OCR evaluation. RA MΦs pretreated o/n with DMSO, 2-DG (5 mM) or IACS (100 nM) were untreated (PBS) or stimulated with LPS/IFNγ (100 ng/ml each) for 6 h before determining the transcriptional regulation of GLUT1, PFKFB3, LDHA (B), PKM2, RAPTOR, PDK1 (C), NOS2 (G), CARKL (H), PPARγ (L), (HIF1α is presented in Suppl-A4), n = 7. Supernatants were harvested from RA MΦs pretreated with DMSO, 2-DG (5 mM) or IACS (100 nM) o/n; prior to being untreated (PBS) or stimulated with LPS/IFNγ (100 ng/ml each) for 24 h before measuring l-Lactate (MAK329, D), NADP or NADPH (MAK038, E, F), Citrate (MAK333, J) and Succinate (MAK335, K) by a Sigma Kit via colorimetric assay, (pyruvate is quantified in Suppl-A3), n = 6. RA MΦs were pretreated with DMSO, 2-DG (5 mM) or IACS (100 nM) o/n were either treated with PBS or LPS/IFNγ (100 ng/ml each) (M, upper panel) for 30 min. In a different experiment, normal MΦs were treated with DMSO, 2-DG (5 mM) or IACS (100 nM) o/n before Western blotting (M, lower panel). Lysates from different experiments were probed for AMPK, pAMPK (1:1000, Cell Signaling) or actin (1:5000) expression, (density quantified in Suppl-B2), n = 3. The data are shown as mean ± SEM, *represents p < 0.05 and ** denotes p < 0.01
Fig. 3
Fig. 3
2-DG and IACS nullify RA FLS-induced inflammatory response. A RA FLS were pretreated with DMSO, 2-DG (5 mM) or IACS (100 nM) o/n before treating the cells with PBS or LPS/IFNγ (100 ng/ml each) for 30 min (timepoint was selected based on the earlier findings shown in Suppl-C4). Lysates were probed for pERK, p-p38, pJNK, pAKT, pSTAT1, pSTAT3 or degradation of IκB (1:1000, Cell signaling) and normalized to actin (1:5000, Santa Cruz Biotechnology), (density quantified in Suppl-C1), n = 4. Representative images (B) and quantification of the number of cells in the scratch area (C) are shown for RA FLS scratch assay where cells were untreated (PBS) or were treated with bFGF (+ Ctl; 100 ng/ml) or pretreated with DMSO, 2-DG (5 mM) or IACS (100 nM) o/n before being untreated (PBS) or stimulated with LPS/IFNγ (100 ng/ml each) for 24 h, n = 4. RA FLS pretreated with DMSO, 2-DG (5 mM) or IACS (100 nM) o/n; were untreated (PBS) or stimulated with LPS/IFNγ (100 ng/ml each) for 24 h or 6 h before evaluating the protein levels of IL-6 (D), IL-8 (E), CCL2 (F) and CCL5 (G) by ELISA; or mRNA concentration of IRF5/7 (H), IRF1/4 (I) or all analyzed IRFs (J) by real-time RT-PCR, n = 5–6. The data are shown as mean ± SEM, *represents p < 0.05 and ** denotes p < 0.01
Fig. 4
Fig. 4
2-DG therapy intercepts glycolysis, PPP and oxidative phosphorylation, while IACS partially rescues these components in RA FLS. RA FLS pretreated with DMSO, 2-DG (5 mM) or IACS (100 nM) o/n were untreated (PBS) or stimulated with LPS/IFNγ (100 ng/ml each) for 6 h before determining the transcriptional regulation of GLUT1, HK2, PKM2, LDHA (A) HIF1α, PFKFB3 (B), NOS2 (F), CARKL (G) and PPARγ (J), n = 4. Supernatants were harvested from RA FLS pretreated with DMSO, 2-DG (5 mM) or IACS (100 nM) o/n; before being untreated (PBS) or stimulated with LPS/IFNγ (100 ng/ml each) for 24 h for measuring L-Lactate (MAK329, C), NADP or NADPH (MAK038, D, E), Citrate (MAK333, H) and Succinate (MAK335, I) by a Sigma Kit via colorimetric assay, (pyruvate is quantified in Suppl-C3), n = 6. RA FLS were pretreated with DMSO, 2-DG (5 mM) or IACS (100 nM) o/n with PBS or LPS/IFNγ (100 ng/ml each) (K, upper) treatment for 30 min. Alternatively, RA FLS were only treated with DMSO, 2-DG (5 mM) or IACS (100 nM) o/n before lysates were harvested (K, lower). Lysates were probed for AMPK or pAMPK (1:1000, Cell Signaling) or actin (1:5000) expression, (density quantified in Suppl-C2), n = 4. The data are shown as mean ± SEM, *represents p < 0.05 and ** denotes p < 0.01
Fig. 5
Fig. 5
2-DG and IACS therapies abrogate Th1 and Th17 cell polarization. Frequency of Th1 (A, B) and Th17 (A, C) was quantified in mouse splenocytes cultured with 0.25 µg/ml of CD3 Ab and CD28 Ab (Biolegend) and cells were untreated (PBS) or treated with IL-12 (10 ng/ml; Th1 + Ctl, Biolegend), TGFβ + IL-6 (1 + 20 ng/ml respectively; Th17 + Ctl, Biolegend) or LPS (100 ng/ml) in the presence or absence of IACS (100 nM) for 4 days, n = 6. Alternatively, splenocytes cultured with 0.25 µg/ml of CD3 Ab and CD28 Ab (Biolegend) were untreated (PBS) or treated with LPS (100 ng/ml), IL-12 (10 ng/ml) or TGFβ + IL-6 (1 + 20 ng/ml respectively) in the presence of DMSO, 2-DG (5 mM) or IACS (100 nM) for 4 days before measuring protein levels of IFNγ (D, E), IL-17 (F, J), IL-1β (G), IL-6 (H) and TGFβ (I), n = 6. The data are shown as mean ± SEM, *represents p < 0.05 and ** denotes p < 0.01
Fig. 6
Fig. 6
2-DG therapy mitigated CIA joint inflammation, glycolytic intermediates, M1 MΦ and erosive markers. A Ankle circumference was measured in the CIA mice treated with placebo or 2-DG (7.5 mg/kg BW) i.p. 3 ×/week from day 25–51, n = 7 mice (14 ankles). B Ankles harvested on day 52 were stained with H&E, F480, iNOS, Arginase, Vimentin and CD3, n = 5. Inflammation, lining and erosion (C) as well as F480, iNOS, Arginase, Vimentin and CD3 staining (D) was scored on a 0–5 scale, (higher magnification and quantification in Suppl-D). Harvested ankles were homogenized and mRNA or protein levels of NOS2 (E), IRF1/5/7/8/9/3/4 (F), TNF, IL-1β, CCL2, CCL5, IL-6 and IL-12 (G), IFNγ and IL-17 (H) were quantified by real-time RT-PCR or ELISA, n = 7. I Blood glucose was measured from 0 to 60 min by Accu-Chek in 18 h fasting CIA mice treated with placebo or 2-DG, n = 7 mice. Transcriptional regulation of glycolytic and oxidative factors (J) and osteoclastic mediators (K) was quantified in ankle joints of CIA treated with placebo or 2-DG and shown as heatmap plot and/or bar graph, n = 7. The data are shown as mean ± SEM, *represents p < 0.05 and **denotes p < 0.01
Fig. 7
Fig. 7
IACS treatment was ineffective in CIA pathology. Ankle circumference was measured in the CIA mice treated with placebo or IACS-010759 (10 mg/kg; ChemieTek) i.p. 3 ×/week from d 25–51, n = 7. B Ankles harvested on day 52 were stained with H&E, F480, iNOS, Arginase, Vimentin and CD3, n = 5. Inflammation, lining and erosion (C) as well as F480, iNOS, Arginase, Vimentin, CD3 staining (D) was scored on a 0–5 scale, (higher magnification and quantification in Suppl-D). Harvested ankles were homogenized and mRNA or protein levels of NOS2 (E), IRF1/5/7/8/9/3/4 (F), TNF, IL-1β, CCL2, CCL5, IL-6 and IL-12 (G), IFNγ and IL-17 (H) were quantified by real-time RT-PCR or ELISA, n = 7. I Blood glucose was measured from 0 to 60 min by Accu-Chek in 18 h fasting CIA mice treated with placebo or 2-DG, n = 7 mice. Transcriptional regulation of glycolytic and oxidative factors (J) and osteoclastic mediators (K) was determined in ankle joints from CIA and CIA + IACS and were shown as heatmap plot or bar graph, n = 7. The data are shown as mean ± SEM, *represents p < 0.05 and **denotes p < 0.01
Fig. 8
Fig. 8
Illustrates the misbalance of glycolysis over oxidative phosphorylation in RA MΦs and FLS and the mechanism by which blockade of glycolysis or complex1 modulates the function of each cell type as well as disease pathology in the CIA preclinical model

References

    1. McInnes IB, Schett G. Pathogenetic insights from the treatment of rheumatoid arthritis. Lancet. 2017;389(10086):2328–2337. - PubMed
    1. Elshabrawy HA, Essani AE, Szekanecz Z, Fox DA, Shahrara S. TLRs, future potential therapeutic targets for RA. Autoimmun Rev. 2017;16(2):103–113. - PMC - PubMed
    1. Kelly B, O'Neill LA. Metabolic reprogramming in macrophages and dendritic cells in innate immunity. Cell Res. 2015;25(7):771–784. - PMC - PubMed
    1. O'Neill LA. A broken krebs cycle in macrophages. Immunity. 2015;42(3):393–394. - PubMed
    1. Biniecka M, Canavan M, McGarry T, Gao W, McCormick J, Cregan S, Gallagher L, Smith T, Phelan JJ, Ryan J, O'Sullivan J, Ng CT, Veale DJ, Fearon U. Dysregulated bioenergetics: a key regulator of joint inflammation. Ann Rheum Dis. 2016;75(12):2192–2200. - PMC - PubMed

MeSH terms