Early cleaving embryos result in blastocysts with increased aspartate and glucose consumption, which exhibit different metabolic gene expression that persists in placental and fetal tissues
- PMID: 34705191
- PMCID: PMC8666392
- DOI: 10.1007/s10815-021-02341-8
Early cleaving embryos result in blastocysts with increased aspartate and glucose consumption, which exhibit different metabolic gene expression that persists in placental and fetal tissues
Abstract
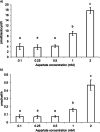
Objectives: Using time-lapse microscopy, previous research has shown that IVF mouse embryos that cleave earlier at the first division ('fast') develop into blastocysts with increased glucose consumption and lower likelihood of post-implantation loss as compared to slower cleaving embryos ('slow'). Further, metabolomics analysis employing LC-MS conducted on groups of 'fast' blastocysts revealed that more aspartate was consumed. With the worldwide adoption of single blastocyst transfer as the standard of care, the need for quantifiable biomarkers of viability, such as metabolism of specific nutrients, would greatly assist in embryo selection for transfer.
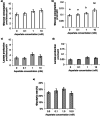
Methods: Here we describe the development of a targeted enzymatic assay to quantitate aspartate uptake of single blastocysts.
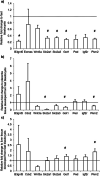
Results: Results demonstrate that the rates of aspartate and glucose consumption were significantly higher in individual 'fast' blastocysts. Blastocysts, together with placental and fetal liver tissue collected following transfer, were analysed for the expression of genes involved in aspartate and carbohydrate metabolism. In 'fast' blastocysts, expressions of B3gnt5, Slc2a1, Slc2a3, Got1 and Pkm2 were found to be significantly higher. In placental tissue derived from 'fast' blastocysts, expression of Slc2a1, Got1 and Pkm2 were significantly higher, while levels of Got1 and Pkm2 were lower in fetal liver tissue compared to tissue from 'slow' blastocysts.
Conclusions: Importantly, this study shows that genes regulating aspartate and glucose metabolism were increased in blastocysts that have higher viability, with differences maintained in resultant placentae and fetuses. Consequently, the analysis of aspartate uptake in combination with glucose represents biomarkers of development and may improve embryo selection efficacy and pregnancy rates.
Keywords: Amino acids; Embryo; Gene expression; Metabolism; Time-lapse.
© 2021. The Author(s), under exclusive licence to Springer Science+Business Media, LLC, part of Springer Nature.
Conflict of interest statement
The authors declare no competing interests.
Figures


Similar articles
-
Developmental kinetics of cleavage stage mouse embryos are related to their subsequent carbohydrate and amino acid utilization at the blastocyst stage.Hum Reprod. 2015 Mar;30(3):543-52. doi: 10.1093/humrep/deu334. Epub 2015 Jan 6. Hum Reprod. 2015. PMID: 25567621
-
Individual culture and atmospheric oxygen during culture affect mouse preimplantation embryo metabolism and post-implantation development.Reprod Biomed Online. 2019 Jul;39(1):3-18. doi: 10.1016/j.rbmo.2019.03.102. Epub 2019 Mar 11. Reprod Biomed Online. 2019. PMID: 31122833
-
Longitudinal surface measurements of human blastocysts show that the dynamics of blastocoel expansion are associated with fertilization method and ongoing pregnancy.Reprod Biol Endocrinol. 2022 Mar 19;20(1):53. doi: 10.1186/s12958-022-00917-2. Reprod Biol Endocrinol. 2022. PMID: 35305653 Free PMC article.
-
Should extended blastocyst culture include Day 7?Hum Reprod. 2018 Jun 1;33(6):991-997. doi: 10.1093/humrep/dey091. Hum Reprod. 2018. PMID: 29648640 Review.
-
Culture and selection of viable blastocysts: a feasible proposition for human IVF?Hum Reprod Update. 1997 Jul-Aug;3(4):367-82. doi: 10.1093/humupd/3.4.367. Hum Reprod Update. 1997. PMID: 9459282 Review.
Cited by
-
Developmental, cytogenetic and epigenetic consequences of removing complex proteins and adding melatonin during in vitro maturation of bovine oocytes.Front Endocrinol (Lausanne). 2023 Oct 23;14:1280847. doi: 10.3389/fendo.2023.1280847. eCollection 2023. Front Endocrinol (Lausanne). 2023. PMID: 38027209 Free PMC article.
-
CDK1 mediates the metabolic regulation of DNA double-strand break repair in metaphase II oocytes.BMC Biol. 2025 Feb 6;23(1):37. doi: 10.1186/s12915-025-02142-w. BMC Biol. 2025. PMID: 39915808 Free PMC article.
-
Sirt6 loss activates Got1 and facilitates cleft palate through abnormal activating glycolysis.Cell Death Dis. 2025 Mar 6;16(1):159. doi: 10.1038/s41419-025-07465-8. Cell Death Dis. 2025. PMID: 40050262 Free PMC article.
-
Non-invasive evaluation of embryo quality for the selection of transferable embryos in human in vitro fertilization-embryo transfer.Clin Exp Reprod Med. 2022 Dec;49(4):225-238. doi: 10.5653/cerm.2022.05575. Epub 2022 Nov 29. Clin Exp Reprod Med. 2022. PMID: 36482497 Free PMC article.
References
-
- Gardner DK, Lane M. Culture and selection of viable blastocysts: a feasible proposition for human IVF? Hum Reprod Update. 1997:3(4):367–82. 10.1093/humupd/3.4.367. - PubMed
-
- Gardner DK, Leese HJ. Concentrations of nutrients in mouse oviduct fluid and their effects on embryo development and metabolism in vitro, (in eng). J Reprod Fertil. 1990;88(1): 361–8, [Online]. Available: http://www.ncbi.nlm.nih.gov/entrez/query.fcgi?cmd=Retrieve&db=PubMed&dop.... - PubMed
-
- Gardner DK. Changes in requirements and utilization of nutrients during mammalian preimplantation embryo development and their significance in embryo culture, (in eng), Theriogenology. 1998;49(1): 83–102, [Online]. Available: http://www.ncbi.nlm.nih.gov/entrez/query.fcgi?cmd=Retrieve&db=PubMed&dop.... - PubMed
-
- Adashi EY, et al. Infertility therapy-associated multiple pregnancies (births): an ongoing epidemic. (in eng), Reprod Biomed Online. 2003:7(5): 515–42, [Online]. Available: http://www.ncbi.nlm.nih.gov/entrez/query.fcgi?cmd=Retrieve&db=PubMed&dop.... - PubMed
-
- Templeton A. The multiple gestation epidemic: the role of the assisted reproductive technologies, (in eng). Am J Obstet Gynecol. 2004;190(4): 894–8. 10.1016/j.ajog.2004.02.017. - PubMed
MeSH terms
Substances
LinkOut - more resources
Full Text Sources
Miscellaneous

