. 2021 Oct 29;7(44):eabh4503.
doi: 10.1126/sciadv.abh4503. Epub 2021 Oct 27.

Ectopic expression of Irx3 and Irx5 in the paraventricular nucleus of the hypothalamus contributes to defects in Sim1 haploinsufficiency

Affiliations

Ectopic expression of Irx3 and Irx5 in the paraventricular nucleus of the hypothalamus contributes to defects in Sim1 haploinsufficiency

Joe Eun Son et al. Sci Adv. .

Abstract

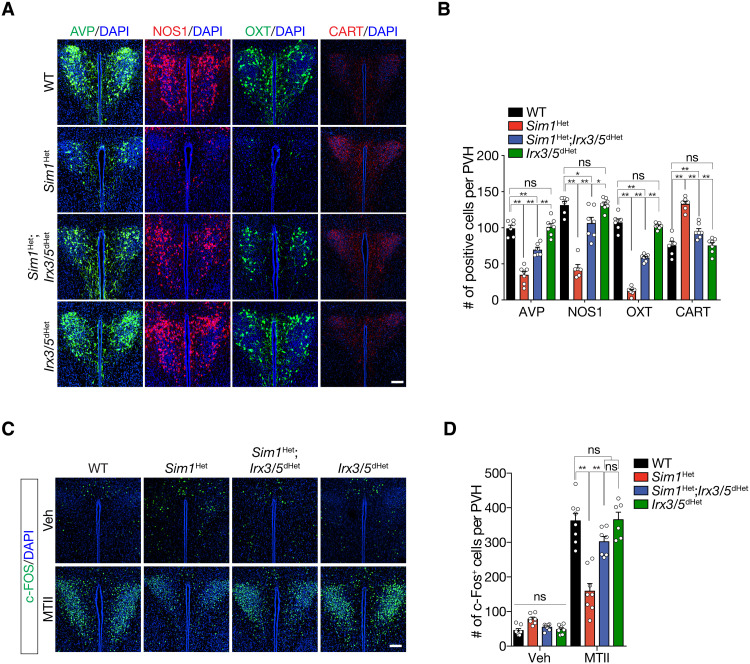
The paraventricular nucleus of the hypothalamus (PVH) contains a heterogeneous cluster of Sim1-expressing neurons critical for feeding regulation. Sim1 haploinsufficiency results in hyperphagic obesity with disruption of PVH neurons, yet the molecular profiles of PVH neurons and the mechanism underlying the defects of Sim1 haploinsufficiency are not well understood. By single-cell RNA sequencing, we identified two major populations of Sim1+ PVH neurons, which are differentially affected by Sim1 haploinsufficiency. The Iroquois homeobox genes Irx3 and Irx5 have been implicated in the hypothalamic control of energy homeostasis. We found that Irx3 and Irx5 are ectopically expressed in the Sim1+ PVH cells of Sim1+/− mice. By reducing their dosage and PVH-specific deletion of Irx3, we demonstrate that misexpression of Irx3 and Irx5 contributes to the defects of Sim1+/− mice. Our results illustrate abnormal hypothalamic activities of Irx3 and Irx5 as a central mechanism disrupting PVH development and feeding regulation in Sim1 haploinsufficiency.


Figures

Fig. 1.
Fig. 1.. scRNA-seq analysis of Sim1-Cre+ cells reveal characteristics of PVH neurons and their disruption in Sim1 haploinsufficiency.
(A) Schematic illustration of live (Sytox blue) tdTomato+ cells prepared from hypothalami of P1-P4 Sim1-Cre;Ai14 tdTomato mice for scRNA-seq analysis. DAPI, 4′,6-diamidino-2-phenylindole. (B) UMAP plot of sequenced tdTomato+ cells annotated according to known cell type markers. (C) Heatmap of top marker genes for each cell cluster and annotation. (D) Dot plot showing the expression levels (color) and percentages (size) of cells expressing TFs and neuropeptides/enzymes enriched in each cluster. (E) Proportional distribution of cell types as revealed by scRNA-seq analysis. (F) Cell type proportional changes in Sim1Het versus control samples based on marker gene expression. (G) Representative images and (H) quantification of the number of AVP+ cells, NOS1+ cells, OXT+ cells, and CART+ cells in the PVH of P0 mice (n = 7/7 for AVP+; n = 6/6 for NOS1+; n = 7/7 for OXT+; n = 8/5 for CART+). Data are represented as means ± SEM values. *P < 0.05; **P < 0.01. WT, wild type. Scale bars, 100 μm.
Fig. 2.
Fig. 2.. Ectopic expression of Irx3 and Irx5 in the Sim1-Cre+ PVH cells of Sim1Het mice.
(A) Histological maps illustrating the expression pattern of Irx3 and Irx5 in the WT and Sim1Het hypothalamus. Section (i) for the PVH and section (ii) for the ARC-ME. 3V, third ventricle. (B) In situ hybridization of Irx3 and Irx5 mRNA in the anterior hypothalamus (black arrows) of E11.5 embryos and PVH (black arrows) of P0 mice. (C) In situ hybridization of Irx3 and Irx5 mRNA in the ARC-ME (dashed lines) of P0 and adult mice. (D) Fluorescence in situ hybridization of Irx3, Irx5, and tdTomato RNA in the PVH of P0 Sim1-Cre;Ai14 tdTomato and Sim1-Cre;Ai14 tdTomato;Sim1Het mice. (E) Top: Isolation of Sim1-Cre+ cells from P0 hypothalami using the Sim1-Cre;Ai14 tdTomato system. Bottom: Gene expression analysis in Sim1-Cre+ cells from control and Sim1Het mice (Cont/Sim1Het: n = 3/3). Data are represented as means ± SEM values. **P < 0.01. Scale bars, 100 μm.
Fig. 3.
Fig. 3.. Reduced dosage of Irx3 or Irx5 in Sim1Het mice partially suppresses hyperphagic obesity.
(A) Gross appearance of WT, Sim1Het, and Sim1Het;Irx3Het mice at 11 weeks old. Photo credit: Joe Eun Son, The Hospital for Sick Children. (B) Body weight and the inset bar graph show body weight of 11-week-old mice (WT, Sim1Het, and Sim1Het;Irx3Het; n = 13/11/10). (C) Body composition analysis of 12-week-old mice (n = 13/11/8). (D) Tissue weight of perigonadal white adipose tissue (PWAT), inguinal WAT (IWAT), brown adipose tissue (BAT), and liver (n = 13/13/11). (E) Glucose tolerance tests (GTTs). The inset bar graph shows area under curve (AUC). n = 9/7/6. (F) Hematoxylin and eosin (H&E) staining of PWAT, BAT, and liver sections. (G) Daily energy expenditure adjusted with lean mass of 29.0 g using analysis of covariance (ANCOVA) of WT, Sim1Het, and Sim1Het;Irx3Het mice (n = 12/10/12). (H) Food intake. The inset bar graph shows total food intake until 11 weeks of age (n = 9/6/6). (I) Gross appearance of WT, Sim1Het, and Sim1Het;Irx5Het mice at 11 weeks old. Photo credit: Joe Eun Son, The Hospital for Sick Children. (J) Body weight. The inset bar graph shows body weight of 11-week-old mice (WT, Sim1Het, and Sim1Het;Irx5Het; n = 15/11/21). (K) Body composition analysis at 12 weeks of age (n = 9/8/9). (L) Tissue weight of PWAT, IWAT, BAT, and liver (n = 6/8/13). (M) GTTs. The inset bar graph shows AUC. n = 9/7/10. (N) H&E staining of PWAT, BAT, and liver sections. (O) Daily energy expenditure adjusted with a lean mass of 29.6 g using ANCOVA of WT, Sim1Het, and Sim1Het;Irx5Het mice (n = 9/5/6). (P) Food intake. The inset bar graph shows total food intake until 11 weeks of age (n = 7/6/7). Data are represented as means ± SEM values. *P < 0.05; **P < 0.01, ns, not significant. Scale bars, 100 μm.
Fig. 4.
Fig. 4.. A simultaneous reduction of Irx3 and Irx5 in Sim1Het mice overrides hyperphagia.
(A) Gross appearance of 11-week-old mice. Photo credit: Joe Eun Son, The Hospital for Sick Children. (B) Body weight of WT, Sim1Het, Sim1Het;Irx3/5dHet, and Irx3/5dHet mice. The inset bar graph shows body weight of 11-week-old mice (n = 18/13/17/21). (C) Body composition analysis of WT, Sim1Het, Sim1Het;Irx3/5dHet, and Irx3/5dHet mice at 12 weeks of age (n = 11/13/8/13). (D) Tissue weight of PWAT, IWAT, BAT, and liver (n = 13/12/11/14). (E) H&E staining of PWAT, BAT, and liver sections. (F) GTTs. The inset bar graph shows AUC (n = 10/12/17/11). (G) Daily energy expenditure adjusted with a lean mass of 26.1 g using ANCOVA (n = 10/11/10/9). (H) Food intake. The inset bar graph shows total food intake until 11 weeks of age (n = 8/10/12/14). Data are represented as means ± SEM values. *P < 0.05; **P < 0.01. Scale bars, 100 μm.
Fig. 5.
Fig. 5.. Reduction of Irx3 and Irx5 in Sim1Het mice restores the PVH neuronal population.
(A) Representative images and (B) quantification of the number of AVP+ cells, NOS1+ cells, OXT+ cells, and CART+ cells in the PVH (n = 6/7/6/7 for AVP+; n = 6/6/7/7 for NOS1+; n = 6/7/7/10 for OXT+; n = 6/6/7/7 for CART+). (C) Representative images and (D) quantification of the number of c-Fos+ cells in the PVH following MTII injection (vehicle: n = 7/7/7/7; MTII: n = 8/8/7/6). Data are represented as means ± SEM values. *P < 0.05; **P < 0.01. Scale bars, 100 μm.
Fig. 6.
Fig. 6.. Deletion of Irx3 in Sim1-Cre+ cells of Sim1Het mice suppresses hyperphagic obesity and restores PVH neuron formation.
(A) Breeding scheme for the generation of Sim1Het;Sim1-Cre;Irx3Fl/Fl (Sim1Het;PVH-Irx3KO) mice. (B) Body weight of control, Sim1Het, Sim1Het;PVH-Irx3Het, and Sim1Het;PVH-Irx3KO mice. The inset bar graph shows body weight of 11-week-old mice (n = 24/11/15/16). (C) Body composition analysis (n = 15 Cont, n = 12 Sim1Het, n = 9 Sim1Het;PVH-Irx3Het, n = 15 Sim1Het;PVH-Irx3KO). (D) Tissue weight of PWAT, IWAT, BAT, and liver (n = 15/12/9/14). (E) GTTs. The inset bar graph shows AUC (n = 13/10/6). (F) H&E staining of PWAT, BAT, and liver sections. (G) Daily energy expenditure adjusted with lean mass of 27.6 g using ANCOVA (n = 11/12/8). (H) Food intake. The inset bar graph shows accumulated food intake until 11 weeks of age (n = 9/9/13). (I) Representative images and (J) quantification of the number of AVP+ cells, NOS1+ cells, OXT+ cells, and CART+ cells in the PVH (n = 8/9/10 for AVP+ or NOS1+ or OXT+; n = 6/7/8 for CART+). (K) Representative images and (L) quantification of the number of c-Fos+ cells in the PVH following MTII injection (vehicle: n = 4/3/4; MTII: n = 5/4/5). Data are represented as means ± SEM values. *P < 0.05; **P < 0.01. Scale bars, 100 μm.
Fig. 7.
Fig. 7.. Model depicting abnormal expression of Irx3 and Irx5 in the PVH leads to neurodevelopmental defects and hyperphagic obesity in Sim1 haploinsufficiency.
Two major subpopulations (neuron 1 and neuron 2) of Sim1-Cre+ PVH neurons are differentially affected by Sim1 haploinsufficiency. Irx3 and Irx5 are ectopically expressed in the Sim1-Cre+ PVH cells of Sim1Het mice and contribute to the PVH neuronal disruption and hyperphagic obesity of Sim1 haploinsufficiency. Reduction of Irx3 or/and Irx5 dosage in Sim1Het mice restores the formation of PVH neurons rescuing the hyperphagic obesity phenotype.

Similar articles

Cited by

References

    1. Coll A. P., Farooqi I. S., O’Rahilly S., The hormonal control of food intake. Cell 129, 251–262 (2007). - PMC - PubMed
    1. Gao Q., Horvath T. L., Neuronal control of energy homeostasis. FEBS Lett. 582, 132–141 (2008). - PMC - PubMed
    1. Sutton A. K., Myers M. G. Jr., Olson D. P., The role of PVH circuits in leptin action and energy balance. Annu. Rev. Physiol. 78, 207–221 (2016). - PMC - PubMed
    1. Karim M. A., Sloper J. C., Histogenesis of the supraoptic and paraventricular neurosecretory cells of the mouse hypothalamus. J. Anat. 130, 341–347 (1980). - PMC - PubMed
    1. Michaud J. L., Rosenquist T., May N. R., Fan C. M., Development of neuroendocrine lineages requires the bHLH-PAS transcription factor SIM1. Genes Dev. 12, 3264–3275 (1998). - PMC - PubMed