. 2021 Oct 27;16(10):e0259158.
doi: 10.1371/journal.pone.0259158. eCollection 2021.

B cell activating factor (BAFF) from neutrophils and dendritic cells is required for protective B cell responses against Salmonella typhimurium infection

Affiliations

B cell activating factor (BAFF) from neutrophils and dendritic cells is required for protective B cell responses against Salmonella typhimurium infection

Runa Kuley et al. PLoS One. .

Abstract

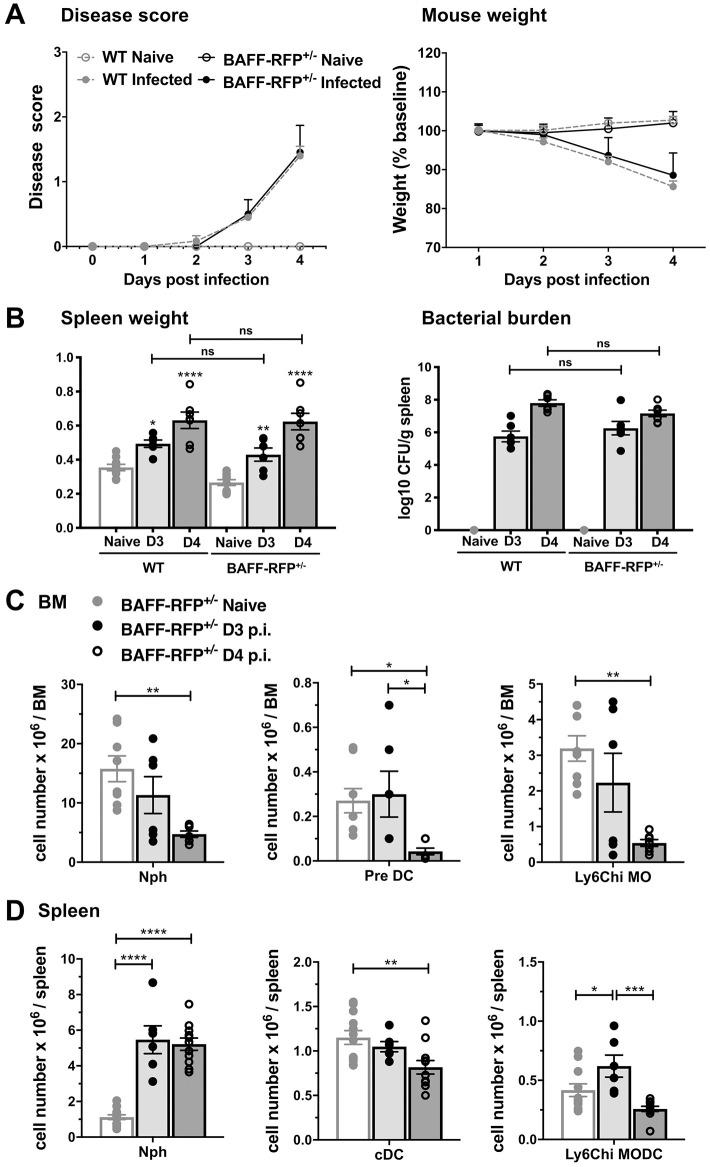
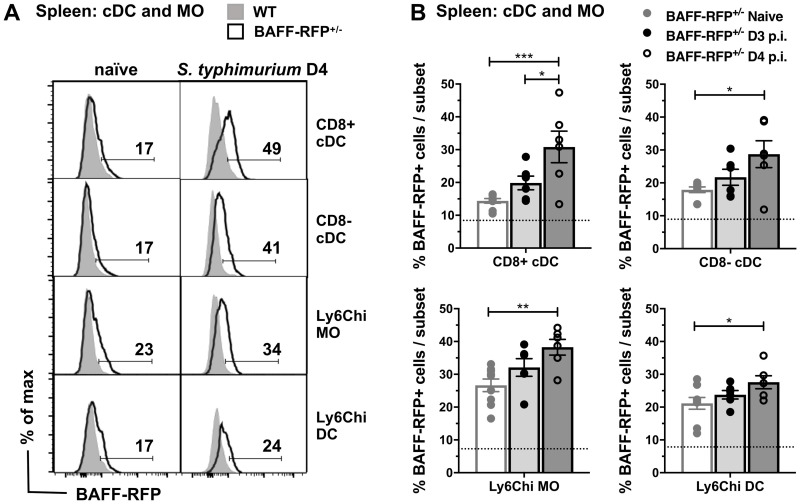
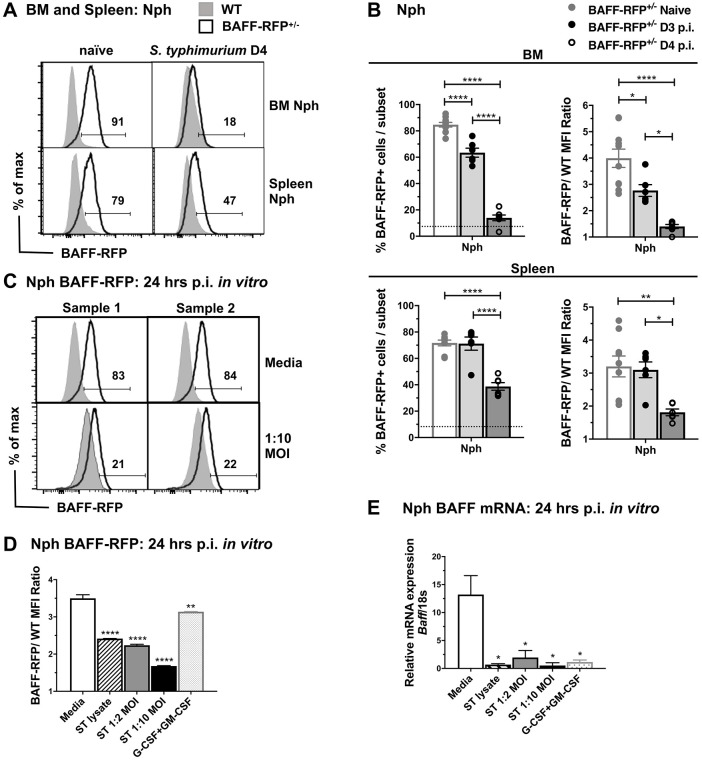
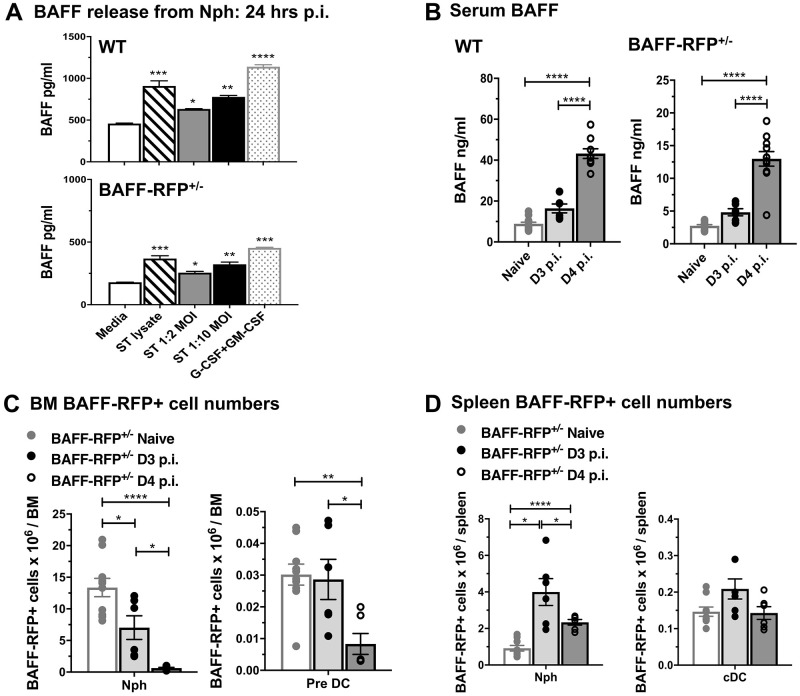
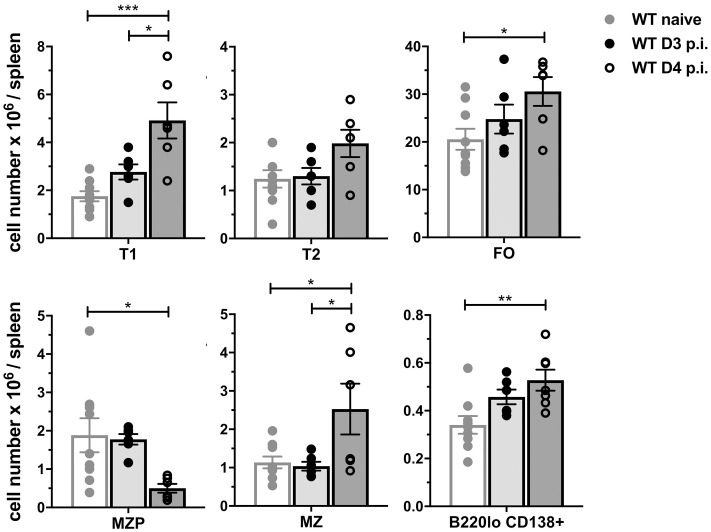
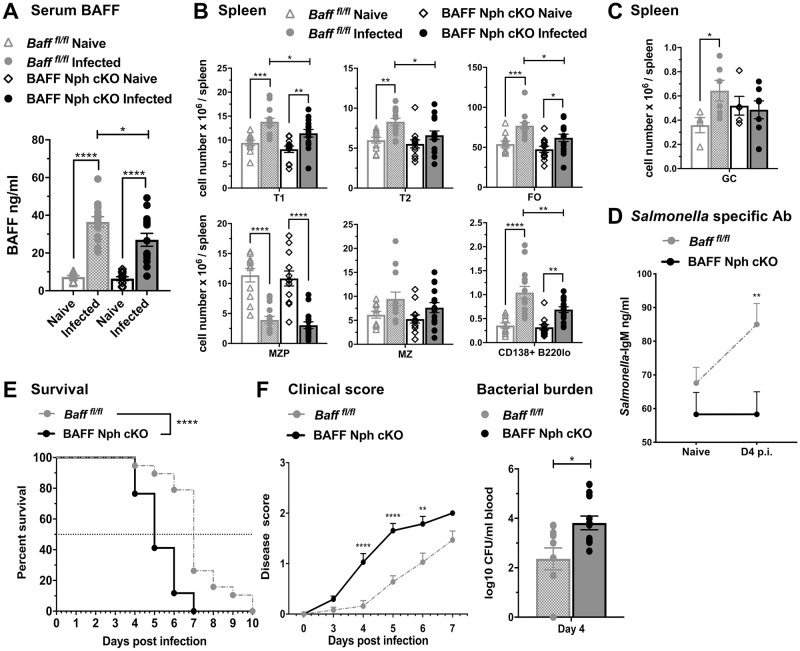
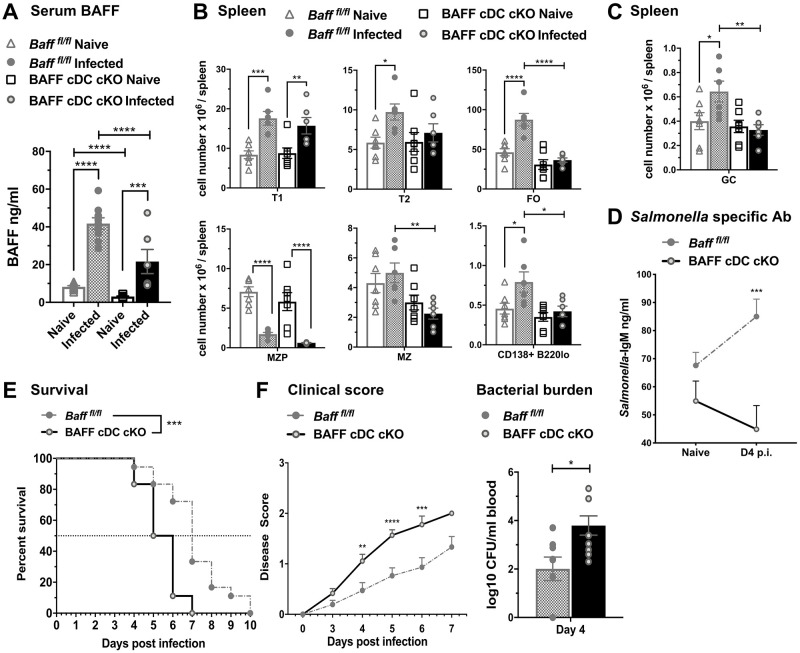
Mice lacking B cells are more susceptible to S. typhimurium infection. How B cells contribute to protective immunity against Salmonella and what signals drive their activation are still unclear. Neutrophils (Nphs), monocytes (MOs), and dendritic cells (DCs) are involved in early immune responses to control the initial replication of S. typhimurium. These cells can produce B cell activating factor (BAFF) required for mature B cell survival and may help regulate B cell responses during Salmonella infection. Using BAFF reporter mice (BAFF-RFP+/-), we discovered that an i.p. infection with a virulent strain of S. typhimurium increased BAFF expression in splenic conventional DCs (cDC) and inflammatory Ly6Chi MOs/DCs four days post-infection. S. typhimurium infection induced the release of BAFF from Nphs, a decrease of BAFF-RFP expression and expansion of BAFF-RFP+ Nphs in the spleen and peritoneal cavity. After S. typhimurium infection, serum BAFF levels and immature and mature B cell subsets and plasma cells increased substantially. Conditional knockout (cKO) mice lacking BAFF in either Nphs or cDCs compared to control Bafffl/fl mice had reduced up-regulation of systemic BAFF levels and reduced expansion of mature and germinal center B cell subsets after infection. Importantly, the cKO mice lacking BAFF from either Nphs or cDCs had impaired induction of Salmonella-specific IgM Abs, and were more susceptible to S. typhimurium infection. Thus, Nphs and cDCs are major cellular sources of BAFF driving B cell responses, required for mounting optimal protective immunity against lethal Salmonella infection.


Conflict of interest statement

The authors have declared that no competing interests exist.

Figures

Fig 1
Fig 1. Clinical outcome and early myeloid cellular responses in BAFF-RFP+/- mice after S. typhimurium infection.
WT mice and BAFF-RFP+/- mice were infected i.p. with 500 CFU S. typhimurium. (A) Clinical scores and mouse weights were taken daily. (B) Spleen weights and splenic bacterial burdens were measured at day 3 and 4 p.i. Data are combined from three independent experiments (n = 6–10). (C and D) Cells from BMs and spleens were harvested at day 3 and 4 p.i., and myeloid cell subsets were determined by flow cytometry. (C) Numbers of BM Nphs (CD11b+Ly6GhiLy6CintSSCint-), Pre DCs (CD11b+CD11c+Ly6C-CD115+CX3CR1hiCCR2+ MHCII+Ly6G-SSC-) and Ly6Chi MOs (CD11b+CD11c-CD115+CX3CR1+CCR2hi MHCII-Ly6G-SSC-) from BAFF-RFP+/- mice after S. typhimurium infection. Graphs summarize data from three independent experiments (n = 6–8). (D) Numbers of splenic Nphs (CD11bhiLy6GhiLy6Cint SSCint-NK1.1-), cDCs (CD11chiCD8+/-B220-Ly6G-NK1.1-) and Ly6Chi MO/DCs (CD11bhi Ly6ChiCD11chi/-SSC-Ly6G-NK1.1-) from BAFF-RFP+/- mice after S. typhimurium infection. Data are combined from four independent experiments (n = 6–12). (A) Timeline data of clinical scores and mouse weights were analyzed by Two-Way ANOVA with Holm-Sidak’s multiple comparison test. (B-D) Bar graphs show means ± SEM; * p <0.05, ** p <0.01, *** p <0.001, **** p <0.0001, as determined by One-Way Anova with Holm-Sidak multiple comparisons test.
Fig 2
Fig 2. Upregulation of BAFF-RFP in cDC and MO myeloid subsets after S. typhimurium infection.
WT and BAFF-RFP+/- mice were infected i.p. with 500 CFU S. typhimurium and BAFF-RFP+ cell populations from naïve, day 3 and day 4 infected spleens were analyzed by flow cytometry. (A) BAFF-RFP expression from cDC subsets (CD8+ cDC and CD8- cDC) and MO subsets (Ly6Chi MO and Ly6Chi DC) from naïve and day 4 S. typhimurium infected mice are shown as representative histograms from three independent experiments. Numbers in the plots indicate the percentage of BAFF-RFP+ cells. (B) Bar graphs (means ± SEM) indicate the percentage of BAFF-RFP+ cells and dotted lines show the percentage of RFP background signal in WT cells. Data are combined from three independent experiments (n = 6–9). Statistics were determined with one-way ANOVA with Holm–Sidak method for multiple comparisons test. * p <0.05, ** p <0.01, *** p <0.001.
Fig 3
Fig 3. Downregulation of BAFF-RFP in Nphs after S. typhimurium infection.
(A and B) WT and BAFF-RFP+/- mice were infected i.p. with 500 CFU S. typhimurium, BM and splenic cell subsets were analyzed by flow cytometry. (C-E) BM Nphs were isolated from WT and BAFF-RFP+/- mice and stimulated for 24 hrs with live S. typhimurium or bacterial lysates in vitro. (A) BAFF-RFP expression in BM and splenic Nphs are shown as representative histograms from three independent experiments. Numbers in the plots indicate the percentage of BAFF-RFP+ cells. (B) Graphs show the percentage of BAFF-RFP+ cells (left panels) and BAFF-RFP mean fluorescence intensity (MFI) expressed as BAFF-RFP/WT ratio (right panels) and summarize data from three independent experiments (n = 6–10). Dotted lines show percentage of RFP+ cells background in WT control. (C) BAFF-RFP expression of unstimulated BM Nphs and BM Nphs stimulated with live S. typhimurium (1:10 MOI). Data are shown as duplicate representative histograms from three independent experiments. (D) Flow cytometry data show BAFF-RFP expression as a BAFF-RFP/WT ratio of the MFI and are from one representative experiment of three independent experiments. (E) Baff mRNA expression analyzed by quantitative PCR and shown as arbitrary units relative to 18S. Data show one representative experiment of two independent experiments. (C-E). In vitro experiments with purified BM Nphs were done pooling 6–10 mice per group. In D and E, G-CSF plus GM-CSF were used as positive controls. (D and E). Bar graphs show means ± SEM; * p <0.05, ** p <0.01, **** p <0.0001, as determined by One-Way Anova with Holm-Sidak multiple comparisons test. (ST refers to S. typhimurium).
Fig 4
Fig 4. S. typhimurium induces release of BAFF from Nphs, increase in systemic BAFF levels and expansion of splenic BAFF-RFP+ Nphs.
(A) WT and BAFF-RFP+/- mice BM Nphs were isolated and BAFF was measured from supernatants of Nphs stimulated for 24 hrs with live S. typhimurium or bacterial lysates. G-CSF plus GM-CSF was used as a positive control. Data show one representative experiment of four independent experiments. (B-D) BAFF-RFP+/- mice were infected i.p. with 500 CFU S. typhimurium. (B) BAFF titers in the serum of naïve and infected WT and BAFF-RFP+/- mice were measured by ELISA. Graphs summarize data from four independent experiments (n = 6–14). BM (C) and spleens (D) from naïve and infected mice were analyzed by flow cytometry. Graphs show total numbers of BAFF-RFP+ Nphs and cDCs and summarize data from three independent experiments (n = 6–10). Bar graphs show means ± SEM; * p <0.05, ** p <0.01, *** p <0.001, **** p <0.0001, as determined by One-Way Anova with Holm-Sidak multiple comparisons test. (ST refers to S. typhimurium).
Fig 5
Fig 5. S. typhimurium induces expansion of T1, FO B cells and plasma cells.
WT mice were infected i.p. with 500 CFU S. typhimurium and absolute numbers of splenic B cell subsets from naïve and infected mice were determined by flow cytometry. For gating strategy of B cell subsets see Methods and S3A Fig in S1 File. T1, T1 B cells; T2, T2 B cells; FO, follicular B cells; MZ, marginal zone, MZP, MZ precursors; B220lo CD138+, plasma cells. Graphs summarize data from three independent experiments (n = 6–9). Bar graphs show means ± SEM; * p <0.05, ** p <0.01, *** p <0.001, **** p <0.0001, as determined by One-Way Anova with Holm-Sidak multiple comparisons test.
Fig 6
Fig 6. BAFF from Nphs is required for protective immune responses to S. typhimurium infection.
(A-C) Bafffl/fl and Bafffl/fl MRP8Cre (BAFF Nph cKO) mice were infected i.p. with 500 CFU S. typhimurium. Serum (A) and spleens (B and C) were harvested from naïve mice and mice infected for 4 days. (A) BAFF titers in the serum were measured by ELISA. (B and C) Absolute numbers of total splenic B cell subsets (T1, T2, FO, MZP, MZ and B220lo CD138+ plasma cells) (B) and GC B cells (C) were analyzed by flow cytometry. (A and B) Data are combined from four independent experiments (n = 11–15). (C) Data are combined from two independent experiments (n = 4–6). (D-F) Bafffl/fl and BAFF Nph cKO mice were infected i.p. with 25 CFU S. typhimurium. (D) Salmonella specific IgM Abs in the serum were analyzed by ELISA. Data shown in (D) are combined from three independent experiments (n = 17–24). (E-F) Data show survival (E), clinical scores (F, left panel) and bacterial burdens (F, right panel) measured at day 4 p.i. by plating blood collected via the retro-orbital route. (E and F, left panel) Survival and clinical scores data are combined from three independent experiments: Baff fl/fl, n = 19; BAFF Nph cKO, n = 17. (F, right panel) Data of bacterial burdens were summarized from two independent experiments (n = 10–11). (A-D) Statistics were determined by Two-Way Anova with Holm-Sidak multiple comparisons test. (E) Survival data were analyzed using a log-rank test for significance. (F, left panel) Significance of clinical scores were determined by Two-Way Anova with Holm-Sidak’s multiple comparisons test. (F, right panel) Unpaired Student t test was used to determine significance in bacterial burdens. Bar graphs show means ± SEM; * p <0.05, ** p <0.01, *** p <0.001, **** p <0.0001.
Fig 7
Fig 7. BAFF from cDCs is required for protective immune responses to S. typhimurium infection.
(A-C) Bafffl/fl and Bafffl/fl zDCCre (BAFF cDC cKO) mice were infected i.p. with 500 CFU S. typhimurium. Serum (A) and spleens (B and C) were harvested from naïve and day 4 infected mice. (A) BAFF titers in the serum were measured by ELISA. (B) Absolute numbers of total splenic B cell subsets (T1, T2, FO, MZP, MZ and B220lo CD138+ plasma cells) and (C) GC B cells were determined by flow cytometry. (A-C) Data are combined from two independent experiments (n = 6–14). (D-F) Bafffl/fl and BAFF cDC cKO mice were infected i.p. with 25 CFU S. typhimurium. (D) Salmonella specific IgM Abs in the serum were measured by ELISA. (D) Data are combined from three independent experiments (n = 17–19). (E and F) Data show survival (E), clinical scores (F, left panel) and bacterial burdens (F, right panel) were measured at day 4 p.i. by plating blood collected via the retro-orbital route. (E and F, right panel)) For survival studies and clinical scores, data were combined from two independent experiments: Baff fl/fl and BAFF cDC cKO n = 18. (F) Data of bacterial burdens were summarized from two independent experiments (n = 8–9). (A-D) Statistics were determined by Two-Way Anova with Holm-Sidak multiple comparisons test. (E) A log-rank test for significance was performed to analyze survival data. (F, left panel) Significance in clinical scores were determined by Two-Way Anova with Holm-Sidak’s multiple comparisons test. (F, right panel) unpaired Student t test was used to determine significance in bacterial burdens. Bar graphs show means ± SEM; * p <0.05, ** p <0.01, *** p <0.001, **** p <0.0001.

Similar articles

Cited by

References

    1. Mackay F, Schneider P. Cracking the BAFF code. Nat Rev Immunol. 2009;9: 491–502. doi: 10.1038/nri2572 - DOI - PubMed
    1. Rickert RC, Jellusova J, Miletic AV. Signaling by the TNFR superfamily in B-cell biology and disease. Immunol Rev. 2011;244: 115–133. doi: 10.1111/j.1600-065X.2011.01067.x - DOI - PMC - PubMed
    1. Goenka R, Scholz JL, Sindhava VJ, Cancro MP. New roles for the BLyS/BAFF family in antigen-experienced B cell niches. Cytokine Growth Factor Rev. 2014;25: 107–113. doi: 10.1016/j.cytogfr.2014.01.001 - DOI - PMC - PubMed
    1. Hsu BL, Harless SM, Lindsley RC, Hilbert DM, Cancro MP. Cutting edge: BLyS enables survival of transitional and mature B cells through distinct mediators. J Immunol Baltim Md 1950. 2002;168: 5993–5996. doi: 10.4049/jimmunol.168.12.5993 - DOI - PubMed
    1. Varfolomeev E, Kischkel F, Martin F, Seshasayee D, Wang H, Lawrence D, et al.. APRIL-Deficient Mice Have Normal Immune System Development. Mol Cell Biol. 2004;24: 997–1006. doi: 10.1128/MCB.24.3.997-1006.2004 - DOI - PMC - PubMed

Publication types

Substances