. 2022 Jan 5;110(1):51-69.e7.
doi: 10.1016/j.neuron.2021.10.007. Epub 2021 Oct 26.

An active vesicle priming machinery suppresses axon regeneration upon adult CNS injury

Affiliations

An active vesicle priming machinery suppresses axon regeneration upon adult CNS injury

Brett J Hilton et al. Neuron. .

Abstract

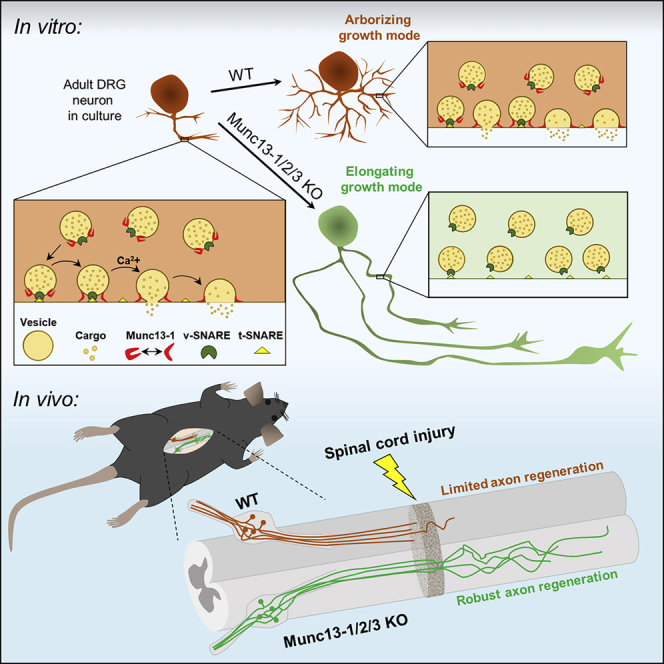
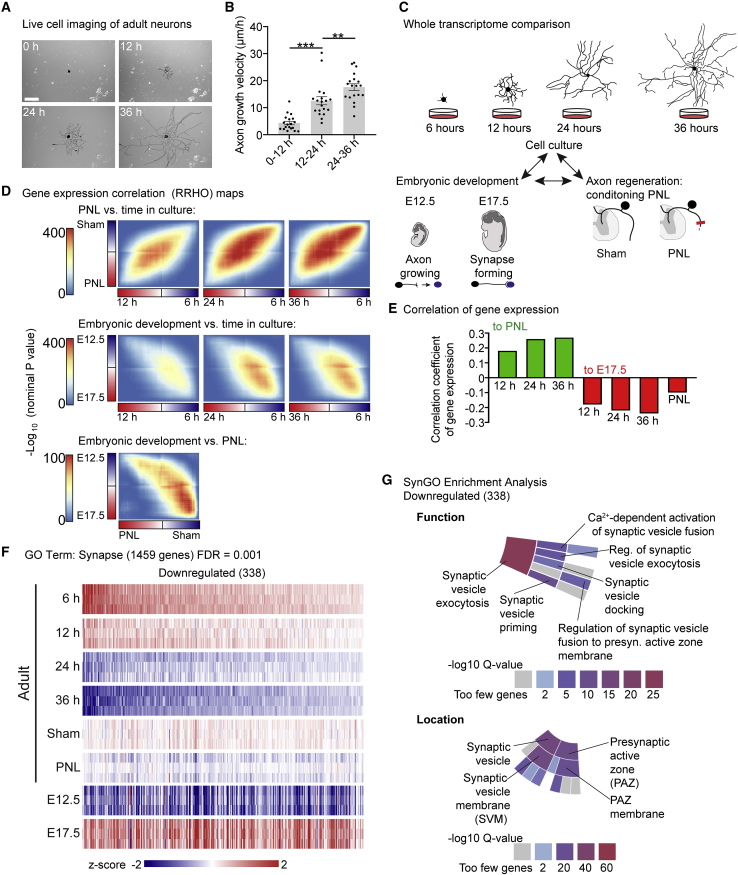
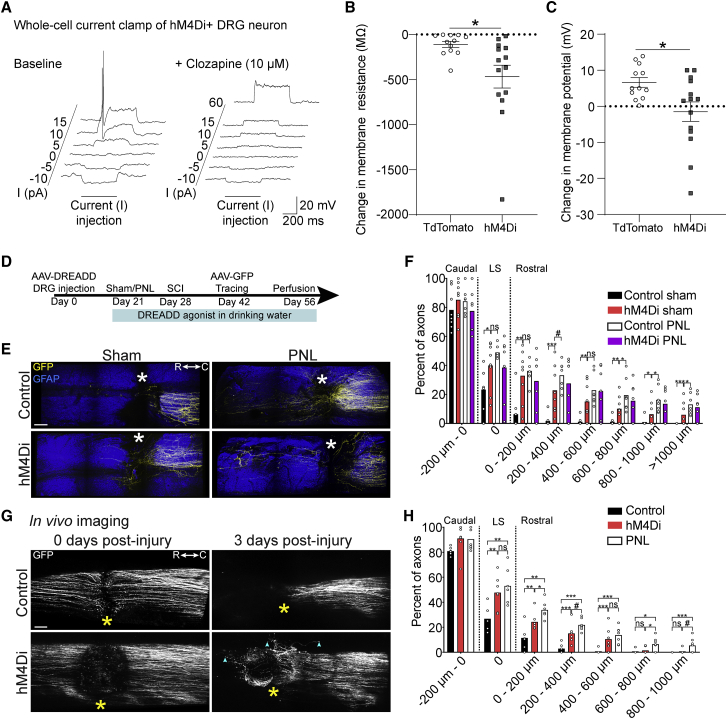
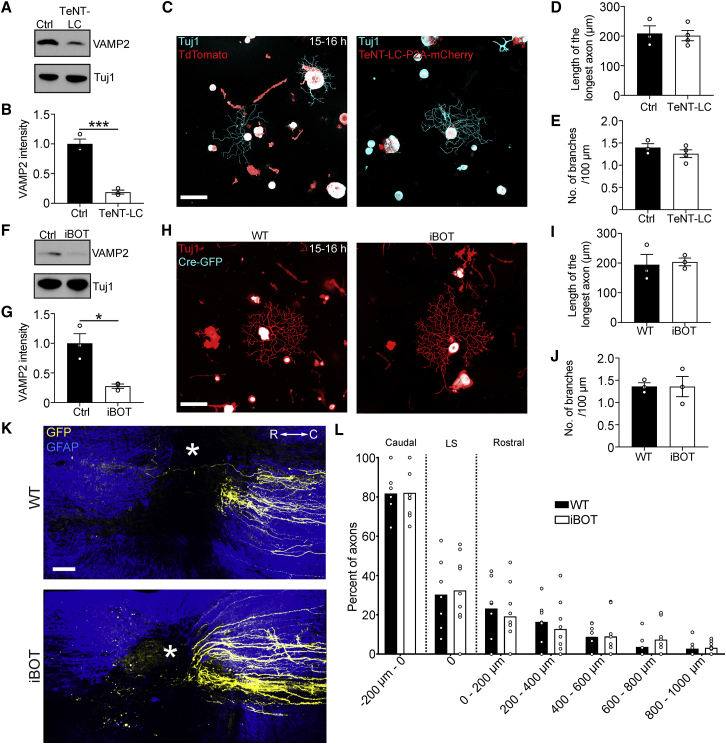
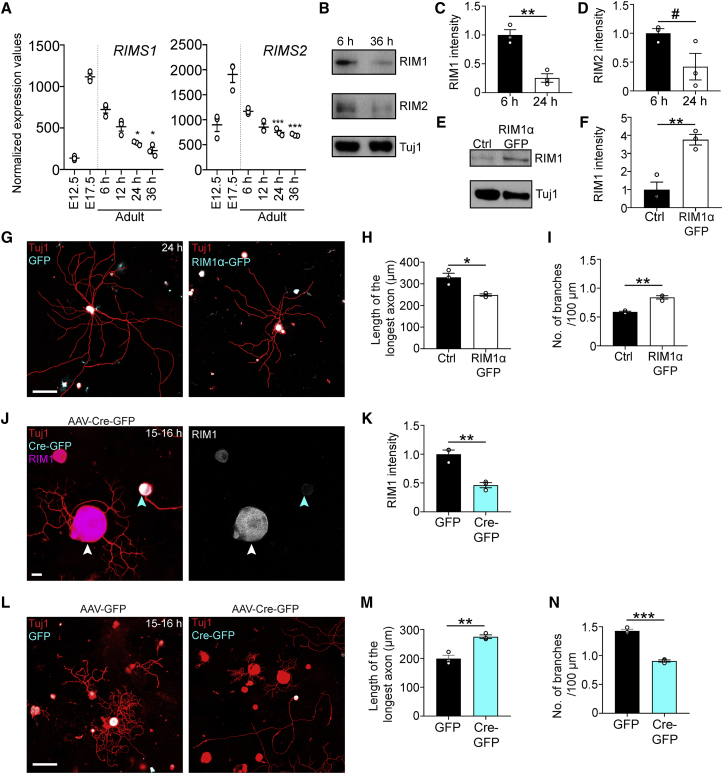
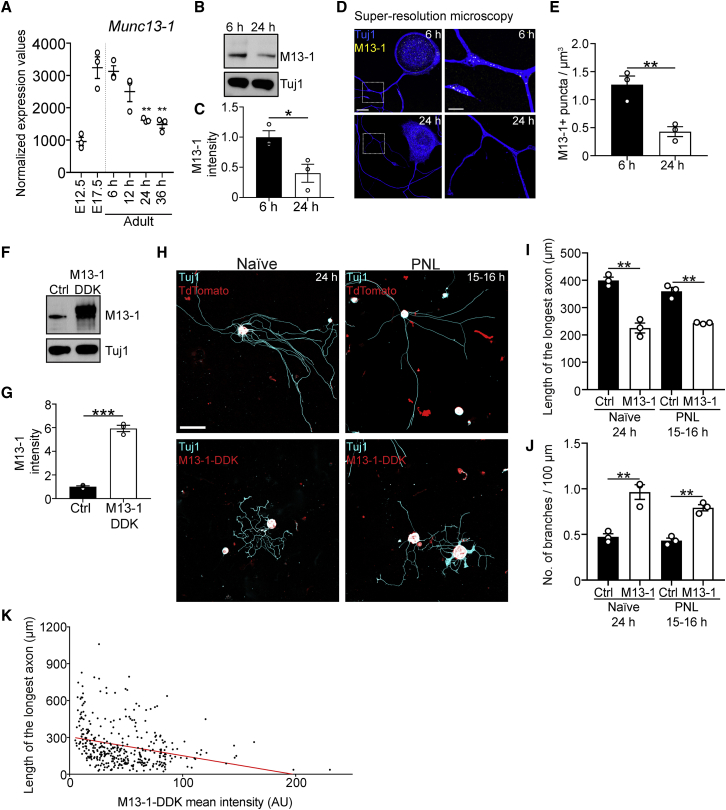
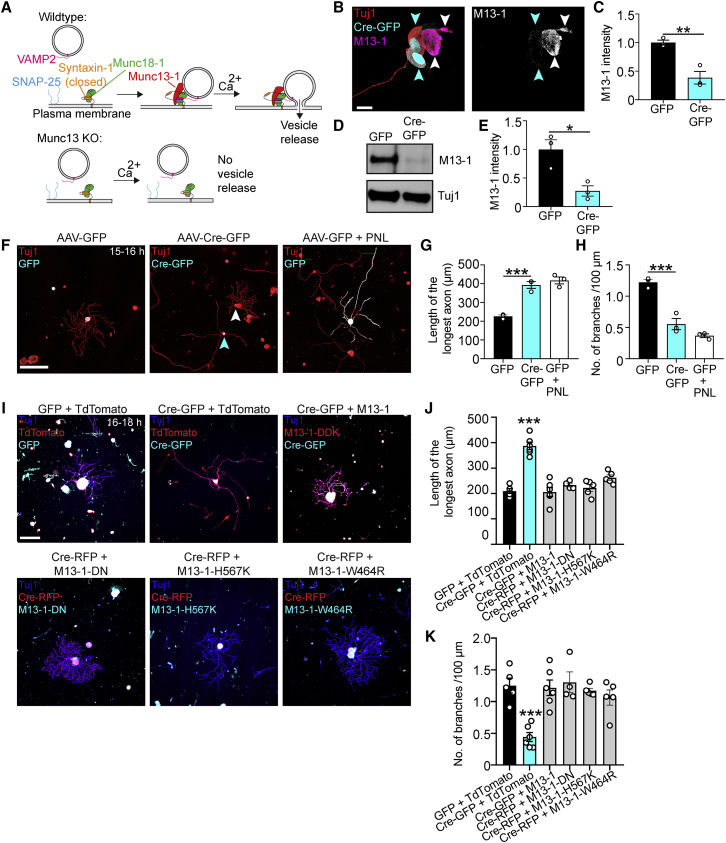
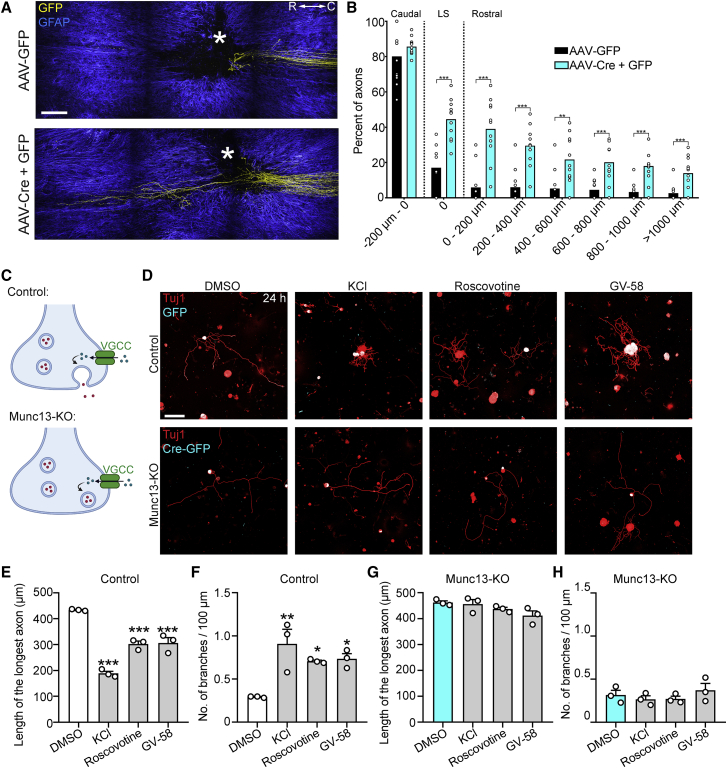
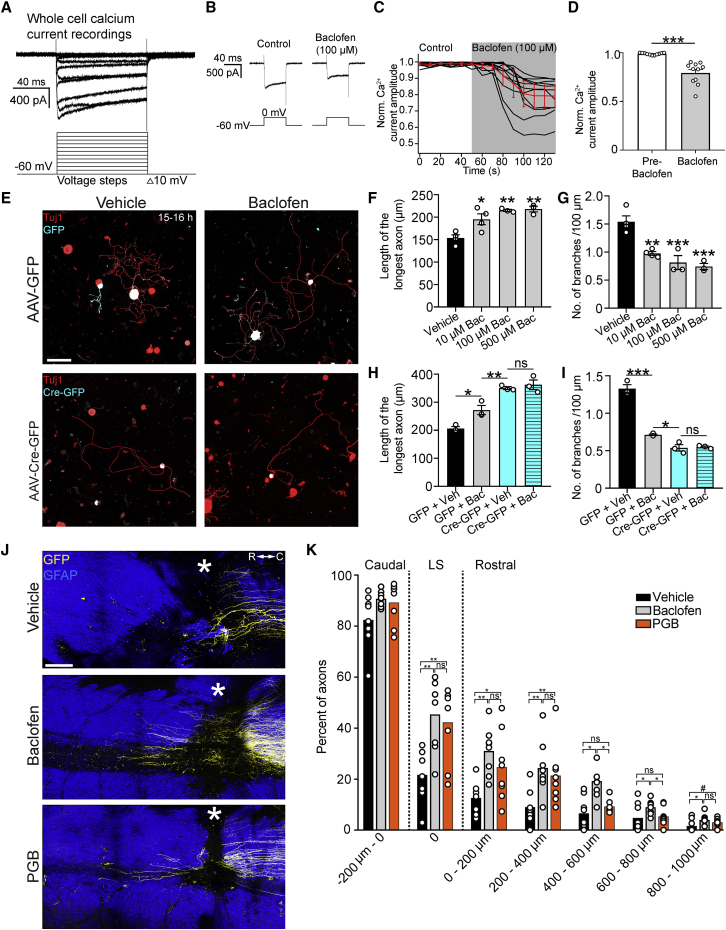
Axons in the adult mammalian central nervous system fail to regenerate after spinal cord injury. Neurons lose their capacity to regenerate during development, but the intracellular processes underlying this loss are unclear. We found that critical components of the presynaptic active zone prevent axon regeneration in adult mice. Transcriptomic analysis combined with live-cell imaging revealed that adult primary sensory neurons downregulate molecular constituents of the synapse as they acquire the ability to rapidly grow their axons. Pharmacogenetic reduction of neuronal excitability stimulated axon regeneration after adult spinal cord injury. Genetic gain- and loss-of-function experiments uncovered that essential synaptic vesicle priming proteins of the presynaptic active zone, but not clostridial-toxin-sensitive VAMP-family SNARE proteins, inhibit axon regeneration. Systemic administration of Baclofen reduced voltage-dependent Ca2+ influx in primary sensory neurons and promoted their regeneration after spinal cord injury. These findings indicate that functional presynaptic active zones constitute a major barrier to axon regeneration.

Keywords: Baclofen; Munc13; RIM1/2; active zone; axon injury; axon regeneration; spinal cord injury.


Conflict of interest statement

Declaration of interests The authors declare no competing interests. N.B. is a member of the Neuron advisory board.

Figures

None
Graphical abstract
Figure 1
Figure 1
DRG neurons downregulate core synaptic transmission genes as they acquire axon growth competence (A) Live-cell images of a pseudocolored (black) adult DRG neuron 0–36 h after plating. Scale bar, 200 μm. (B) Axon growth velocity of (A). Values are plotted as mean ± SEM; ∗∗∗p < 0.0001, ∗∗p < 0.01 by one-way ANOVA followed by Tukey’s post hoc test; n = 3 independent experiments with 14, 17, and 19 neurons per experiment. (C) Scheme of RRHO analysis: comparing whole-transcriptome changes in developing, regenerating, and cultured DRG. (D) Heatmaps of –log10 p values comparing overlap between whole-genome gene-expression changes in PNL/Sham, E12.5/E17.5, and time in cell culture (6, 12, 24, and 36 h). (E) Correlation analysis of gene-expression profiles of the 3 paradigms. (F) Heatmap of differentially expressed genes in DRG at E12.5, E17.5, and adult with PNL, Sham, or after 6–36 h in culture from RNA-seq with GO term “synapse” downregulated from 6 to 36 h (338 genes; FDR = 0.001; FDR-adjusted p < 1 × 10−5). (G) Sunburst plot insets of SynGO-enrichment analyses showing the locations synaptic vesicle and presynaptic active zone and the function synaptic vesicle exocytosis enriched for in synapse-related genes downregulated in adult DRG neurons after 36 h in cell culture. Color code denotes the –log10 Q-value score. See also Figures S1–S3 and Tables S1 and S2.
Figure 2
Figure 2
Pharmacogenetic reduction of neuronal excitability stimulates axon regeneration (A) Representative whole-cell recordings from an hM4Di-mCherry+ adult mouse DRG neuron injected with current before (baseline) and after administration of 10 μM clozapine dihydrochloride. (B and C) Change in membrane resistance (B) and membrane potential (C) of DRG neurons. Values are plotted as mean ± SEM; p < 0.05 in (B) and (C), tdTomato+ versus hM4Di-mCherry+ by Student’s t test (n = 12 tdTomato+ and 14 hM4Di+ neurons). (D) Timeline of (E) and (F). (E) Multiphoton tile scan of GFP+ sensory axons (yellow) and GFAP+ astrocytes (blue) in the unsectioned spinal cord after complete dorsal column SCI in the given conditions. Asterisks indicate lesion centers. Scale bar, 200 μm. (F) Quantification of (E). Scatterplot with means; ∗∗∗p < 0.001, ∗∗p < 0.01, p < 0.05, and #p < 0.1 by permutation test. n = 8, 8, 7, and 7 for control sham, hM4Di sham, control PNL, and hM4Di PNL, respectively. (G) In vivo tile scan images of GFP+ sensory axons 0 and 3 days after SCI. Asterisks indicate the lesion epicenters; cyan arrowheads point to distal tips of regenerating axons. Scale bar, 100 μm. (H) Quantification of (G) and comparison with the conditioning paradigm. Scatterplot with means; ∗∗∗p < 0.001, ∗∗p < 0.01, p < 0.05, and #p < 0.1 by permutation test. n = 6, 7, and 7 for control, hM4Di, and PNL, respectively. See also Figure S4 and Video S1.
Figure 3
Figure 3
TeNT-LC or BoNT/B overexpression does not promote axon growth in adult DRG neurons (A) Immunoblot of VAMP2 and Tuj1 in L3–L5 DRG extracts 3 weeks after AAV-TeNT-LC-P2A-mCherry or AAV-tdTomato injection into wild-type mice. (B) Quantification of (A). Values are plotted as mean ± SEM; ∗∗∗p < 0.001 by Student’s t test; n = 3 independent experiments. (C) Representative fluorescence images of Tuj1 (cyan) and TeNT-LC-P2A-mCherry/tdTomato (red) immunolabeled DRG neurons 3 weeks after AAV administration and plated for 15–16 h. Scale bar, 100 μm. (D and E) Length of the longest axon (D) and branching frequency (E) of (C). Values are plotted as mean ± SEM; n = 3–4 independent experiments with 145 tdTomato+ neurons, 133 TeNT-LC-P2A-mCherry+ neurons. (F) Immunoblot of VAMP2 and Tuj1 in L3–L5 DRG extracts 3 weeks after AAV-Cre-GFP injection into iBOT and wild-type control mice. (G) Quantification of (F). Values are plotted as mean ± SEM;p < 0.05 by Student’s t test. n = 3 independent experiments. (H) Representative fluorescence images of Tuj1 (red) and Cre-GFP (cyan) immunolabeled DRG neurons 3 weeks after AAV-Cre-GFP administration and plated for 15–16 h. Scale bar, 100 μm. (I and J) Length of the longest axon (I) and branching frequency (J) of (H). Values are plotted as mean ± SEM; n = 3 independent experiments with 100 Cre-GFP+ wild-type neurons, 164 Cre-GFP+ iBOT neurons. (K) Multiphoton tile scan of GFP+ sensory axons (yellow) and GFAP+ astrocytes (blue) in the unsectioned spinal cord after complete dorsal column SCI in the given conditions. R, rostral; C, caudal. Asterisks indicate lesion centers. Scale bar, 200 μm. (L) Quantification of (K). Scatterplot with means. n = 7 WT mice and 9 iBOT mice.
Figure 4
Figure 4
RIM1/2 deletion promotes axon growth in adult DRG neurons (A) Normalized expression values of RIMS1 and RIMS2 in DRG at E12.5, E17.5, and adult from 6 to 36 h in culture. ∗∗∗p < 0.001 6 versus 24 or 36 h, p < 0.05 6 versus 24 or 36 h in culture by one-way ANOVA followed by Tukey’s post hoc test; n = 3 technical replicates per condition. (B) Immunoblot of RIM1, RIM2, and Tuj1 in L3–L5 DRG extracts after 6 or 36 h in culture. (C and D) Quantification of RIM1 (C) and RIM2 (D) in (B). Values are plotted as mean ± SEM; ∗∗p < 0.01, #p < 0.10 by Student’s t test; n = 3 independent experiments. (E) Immunoblot of RIM1 and Tuj1 in L3–L5 DRG extracts electroporated with Rim1α-GFP or GFP (control)-expressing plasmids and cultured for 24 h. (F) Quantification of (E). Values are plotted as mean ± SEM; ∗∗p < 0.01 by Student’s t test. n = 3 independent experiments. (G) Representative fluorescence images of naive DRG neurons electroporated with RIM1α-GFP or GFP-expressing plasmids and cultured for 24 h. Scale bar, 100 μm. (H and I) Length of the longest axon (H) and branching frequency (I) of (G). Values are plotted as mean ± SEM; ∗∗p < 0.01, p < 0.05 control GFP versus RIM1α-GFP by Student’s t test; n = 3 independent experiments with 103 control GFP+ neurons, 141 RIM1α-GFP+ neurons. (J) Representative images of cultured DRG neurons after AAV-Cre-GFP administration into RIM1fl/flRIM2fl/fl mice. Cyan arrowhead points to Cre-GFP+ neuron and white arrowhead points to Cre-GFP neuron. Scale bar, 15 μm. (K) Quantification of (J). Values are plotted as mean ± SEM; ∗∗p < 0.01 by Student’s t test; n = 3 independent experiments, 106 GFP+ neurons, and 98 Cre-GFP+ neurons. (L) Representative fluorescence images of Tuj1 (red) and GFP/Cre-GFP (cyan)-immunolabeled DRG neurons 3 weeks after AAV-GFP or AAV-Cre-GFP administration into RIM1fl/flRIM2fl/fl mice and plated for 15–16 h. The AAV-Cre-GFP image shows the same neurons as in (J). Scale bar, 100 μm. (M and N) Length of the longest axon (M) and branching frequency (N) of (L). Values are plotted as mean ± SEM; ∗∗∗p < 0.001, ∗∗p < 0.01 by Student’s t test. n = 3 independent experiments, 108 GFP+ neurons, 101 Cre-GFP+ neurons.
Figure 5
Figure 5
Munc13-1 suppresses axon growth in adult DRG neurons (A) Normalized expression values of Munc13-1 in DRG at E12.5, E17.5, and adult from 6 to 36 h in culture. ∗∗p < 0.01 6 versus 24 h, ∗∗p < 0.01 6 versus 36 h in culture by one-way ANOVA followed by Tukey’s post hoc test; n = 3 technical replicates per condition. (B) Immunoblot of Munc13-1 and Tuj1 in L3-L5 DRG extracts after 6 or 24 h in culture. (C) Quantification of (B). Values are plotted as mean ± SEM; p < 0.05 by Student’s t test; n = 3 independent experiments. (D) Representative fluorescence images of adult DRG neurons cultured for 6 or 24 h and stained with Munc13-1 and Tuj1 antibodies. Scale bars, 10 μm in outset and 3 μm in inset. (E) Quantification of (D). Values are plotted as mean ± SEM; ∗∗p < 0.01 by Student’s t test; n = 21 neurons at 6 h, 18 neurons at 24 h from 3 independent experiments. (F) Immunoblot of Munc13-1 and Tuj1 in L3-L5 DRG extracts electroporated with Munc13-1 or tdTomato-expressing plasmids and cultured for 24 h. (G) Quantification of (F). Values are plotted as mean ± SEM; ∗∗∗p < 0.001 by Student’s t test. n = 3 independent experiments. (H) Representative fluorescence images of uninjured/naive or conditioned/PNL DRG neurons electroporated with Munc13-1-DDK or tdTomato-expressing plasmids. Scale bar, 100 μm. (I and J) Length of the longest axon (I) and branching frequency (J) of (H). Values are plotted as mean ± SEM; ∗∗p < 0.01 naive tdTomato versus naive Munc13-1-DDK and PNL tdTomato versus PNL Munc13-1-DDK by Student’s t test in (I) and ∗∗p < 0.01 naive tdTomato versus naive Munc13-1-DDK and PNL tdTomato versus PNL Munc13-1-DDK by Student’s t test in (J); n = 3 independent experiments with 94 naive tdTomato+ neurons, 224 naive Munc13-1-DDK+ neurons, 125 PNL tdTomato+ neurons, 145 PNL Munc13-1-DDK+ neurons. (K) XY plot of Munc13-1-DDK mean intensity (arbitrary units) and length of the longest axon for all Munc13-1-DDK+ neurons analyzed in (H)–(J). Red line shows linear regression (p < 0.0001).
Figure 6
Figure 6
Munc13 deletion promotes axon growth in adult DRG neurons (A) Scheme of Munc13’s function. (B) Representative images of cultured DRG neurons after AAV-Cre-GFP administration into Munc13-1fl/flMunc13-2KO/KOMunc13-3KO/KO mice. Cyan arrowheads point to Cre-GFP+ neurons, and the white arrowhead points to Cre-GFP neuron. Scale bar, 15 μm. (C) Quantification of (B). Values are plotted as mean ± SEM; ∗∗p < 0.01 by Student’s t test; n = 3 independent experiments, 18 GFP+ neurons, 22 Cre-GFP+ neurons. (D) Immunoblot of Munc13-1 and Tuj1 in L3-L5 DRG extracts 3 weeks after AAV-Cre-GFP injection into Munc13-1fl/flMunc13-2KO/KOMunc13-3KO/KO mice. (E) Quantification of (D). Values are plotted as mean ± SEM; p = 0.0192 by Student’s t test; n = 3 independent experiments. (F) Representative fluorescence images of Tuj1 (red) and GFP/Cre-GFP (cyan)-immunolabeled DRG neurons 3 weeks after AAV-GFP or AAV-Cre-GFP administration and plated for 15–16 h. Cyan arrowhead points to Cre-GFP+ neuron and white arrowhead points to Cre-GFP neuron. Scale bar, 200 μm. (G and H) Length of the longest axon (G) and branching frequency (H) of (F). Values are plotted as mean ± SEM; ∗∗∗p < 0.001 by Student’s t test. n = 3 independent experiments, 102 GFP neurons, 125 Cre-GFP neurons, 116 GFP + PNL neurons. (I) Representative fluorescence images of Tuj1, GFP/Cre-GFP/Cre-RFP, and tdTomato/Munc13-1-DDK/Munc13-1-DN/Munc13-1-H567K/Munc13-1-W464R immunolabeled DRG neurons from Munc13-1fl/flMunc13-2KO/KOMunc13-3KO/KO mice administered AAV-GFP, AAV-Cre-GFP or AAV-Cre-RFP, transfected with plasmids and cultured for 16–18 h. Scale bar, 200 μm. (J and K) Length of the longest axon (J) and branching frequency (K) of (I). Values are plotted as mean ± SEM; ∗∗∗p < 0.0001 by one-way ANOVA followed by Tukey’s post hoc test; n = 80 GFP + tdTomato neurons from 5 independent experiments, 64 Cre-GFP + tdTomato neurons from 6 independent experiments, 78 Cre-GFP + Munc13-1 (DDK) neurons from 6 independent experiments, 71 Cre-RFP + Munc13-1-DN neurons from 4 independent experiments, 80 Cre-RFP + Munc13-1-H567K neurons from 5 independent experiments, 81 Cre-RFP + Munc13-1-W464R neurons from 5 independent experiments.
Figure 7
Figure 7
Munc13 deletion promotes axon regeneration following adult CNS injury (A) Multiphoton tile scan of GFP+ sensory axons (yellow) and GFAP+ astrocytes (blue) in the unsectioned spinal cord after complete dorsal column SCI in the given conditions. R, rostral; C, caudal. Asterisks indicate lesion centers. Scale bar, 200 μm. (B) Quantification of (A). Scatterplot with means; ∗∗∗p < 0.001, ∗∗p < 0.01 by permutation test. n = 11 animals per group. (C) Scheme of VGCC activation, presynaptic Ca2+ influx, and vesicle release. (D) Representative fluorescence images of Tuj1 (red) and GFP/Cre-GFP (cyan) immunolabeled DRG neurons from Munc13-1fl/flMunc13-2KO/KOMunc13-3KO/KO mice administered AAV-GFP or AAV-Cre-GFP and cultured for 24 h in the presence of DMSO, KCl (40 mM), Roscovotine (20 μM), or GV-58 (20 μM). Scale bar, 200 μm. (E and F) Length of the longest axon (E) and branching frequency (F) of AAV-GFP+ neurons in (D). Values are plotted as mean ± SEM; ∗∗∗p < 0.001 GFP DMSO versus GFP KCl, GFP Roscovotine, GFP GV-58 in (E) and ∗∗p < 0.01 GFP DMSO versus GFP KCl, p < 0.05 GFP DMSO versus GFP Roscovotine, GFP DMSO versus GFP GV-58 in (F) by one-way ANOVA followed by Tukey’s post hoc test; n = 72 GFP DMSO, 86 GFP GV-58, 37 GFP KCl, 53 GFP Roscovotine-treated neurons from 3 independent experiments. (G and H) Length of the longest axon (G) and branching frequency (H) of AAV-Cre-GFP+ neurons in (D). Values are plotted as mean ± SEM n = 82 Cre-GFP DMSO, 92 Cre-GFP GV-58, 48 Cre-GFP KCl, 23 Cre-GFP Roscovotine-treated neurons from 3 independent experiments.
Figure 8
Figure 8
Baclofen promotes axon regeneration following spinal cord injury (A) Whole-cell recording of voltage-activated calcium currents in a cultured DRG neuron one day in vitro. The holding potential was −60 mV, and the calcium current was evoked by 100 ms voltage steps from −60 to 50 mV in 10 mV increments. (B) Raw traces of calcium currents in cultured DRG neurons before and after bath application of Baclofen (100 μM). (C) Plot of all DRG neurons indicating the reduction of the voltage-activated calcium current in response to Baclofen administration. (D) Quantification of (C). Values are plotted as mean ± SEM; ∗∗∗p = 0.001 by Wilcoxon matched-pairs signed-rank test; n = 11 neurons. (E) Representative fluorescence images of Tuj1 (red) and GFP/Cre-GFP (cyan)-immunolabeled DRG neurons from Munc13-1fl/flMunc13-2KO/KOMunc13-3KO/KO mice administered AAV-GFP or AAV-Cre-GFP and cultured for 15–16 h in the presence of vehicle or Baclofen (100 μM). Scale bar, 100 μm. (F and G) Length of the longest axon (F) and branching frequency (G) of DRG neurons cultured for 15–16 h in the presence of vehicle or Baclofen (10 μM, 100 μM, or 500 μM). Values are plotted as mean ± SEM; p < 0.05 vehicle versus 10 μM, ∗∗p < 0.01 vehicle versus 100 μM, vehicle versus 500 μM by one-way ANOVA followed by Tukey’s post hoc test in (F); ∗∗p < 0.01 vehicle versus 10 μM, ∗∗∗p < 0.001 vehicle versus 100 μM, vehicle versus 500 μM by one-way ANOVA followed by Tukey’s post hoc test in (G); n = 235 vehicle, 136 10 μM, 122 100 μM, 156 500 μM Baclofen-treated neurons from 3–4 independent experiments. (H and I) Length of the longest axon (H) and branching frequency (I) of (E). Values are plotted as mean ± SEM; p < 0.05 GFP + vehicle versus GFP + Baclofen, ∗∗p < 0.01 GFP + Baclofen versus Cre-GFP + vehicle, p = 0.9024 Cre-GFP + vehicle versus Cre-GFP + Baclofen in (H), ∗∗∗p < 0.0001 GFP + vehicle versus GFP + Baclofen, p < 0.05 GFP + Baclofen versus Cre-GFP + vehicle in (I) by one-way ANOVA followed by Tukey’s post hoc test; n = 68 GFP + vehicle, 73 GFP + Baclofen, 62 Cre-GFP + vehicle, 58 Cre-GFP + Baclofen neurons from 3 independent experiments. (J) Multiphoton tile scan of GFP+ sensory axons (yellow) and GFAP+ astrocytes (blue) in the unsectioned spinal cord after complete dorsal column SCI in the given conditions. R, rostral; C, caudal. Asterisks indicate lesion centers. Scale bar, 200 μm. (K) Quantification of (J). Scatterplot with means; ∗∗p < 0.01, p < 0.05, #p < 0.1 by permutation test. n = 8 animals per group. See also Figure S5.

References

    1. Albright A.L., Cervi A., Singletary J. Intrathecal baclofen for spasticity in cerebral palsy. JAMA. 1991;265:1418–1422. - PubMed
    1. Augustin I., Rosenmund C., Südhof T.C., Brose N. Munc13-1 is essential for fusion competence of glutamatergic synaptic vesicles. Nature. 1999;400:457–461. - PubMed
    1. Augustin I., Korte S., Rickmann M., Kretzschmar H.A., Südhof T.C., Herms J.W., Brose N. The cerebellum-specific Munc13 isoform Munc13-3 regulates cerebellar synaptic transmission and motor learning in mice. J. Neurosci. 2001;21:10–17. - PMC - PubMed
    1. Banerjee A., Imig C., Balakrishnan K., Kershberg L., Lipstein N., Uronen R.-L., Wang J., Cai X., Benseler F., Rhee J.S. Molecular and functional architecture of striatal dopamine release sites. bioRxiv. 2020 doi: 10.1101/2020.11.25.398255. Published online November 20, 2020. - DOI - PMC - PubMed
    1. Bareyre F.M., Garzorz N., Lang C., Misgeld T., Büning H., Kerschensteiner M. In vivo imaging reveals a phase-specific role of STAT3 during central and peripheral nervous system axon regeneration. Proc. Natl. Acad. Sci. USA. 2011;108:6282–6287. - PMC - PubMed

Publication types