. 2021 Nov 9;54(11):2465-2480.e5.
doi: 10.1016/j.immuni.2021.10.001. Epub 2021 Oct 26.

DNA methylation signatures reveal that distinct combinations of transcription factors specify human immune cell epigenetic identity

Affiliations

DNA methylation signatures reveal that distinct combinations of transcription factors specify human immune cell epigenetic identity

Roshni Roy et al. Immunity. .

Erratum in

Abstract

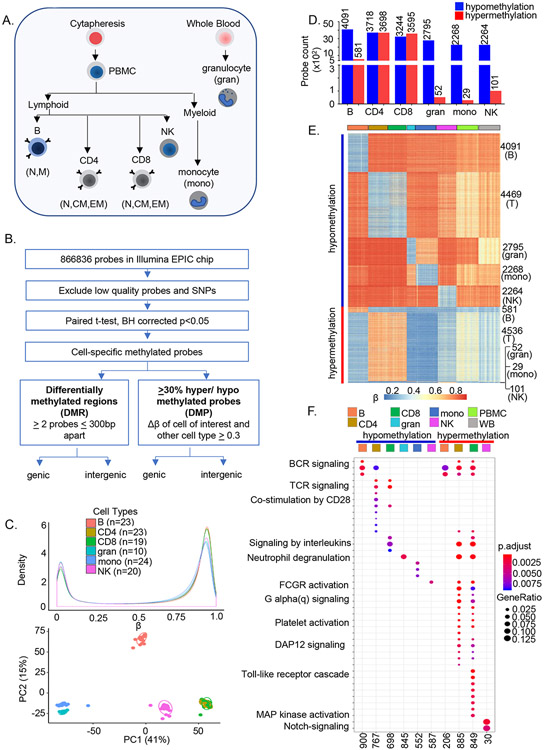
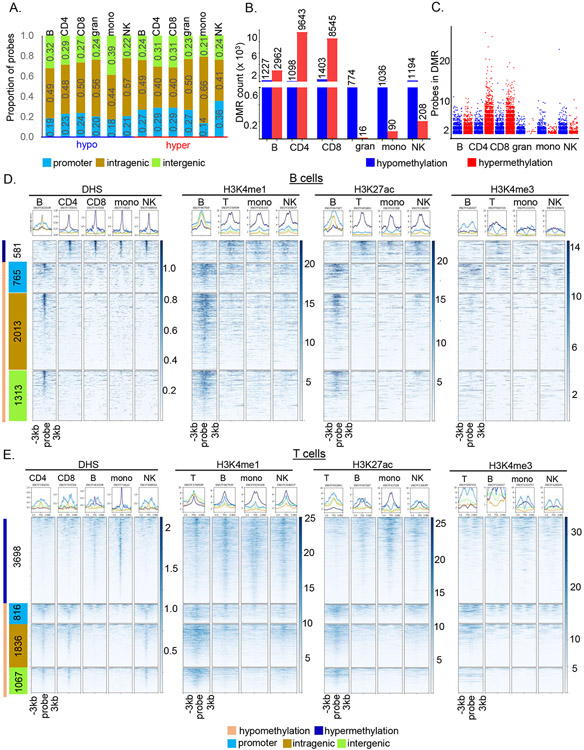
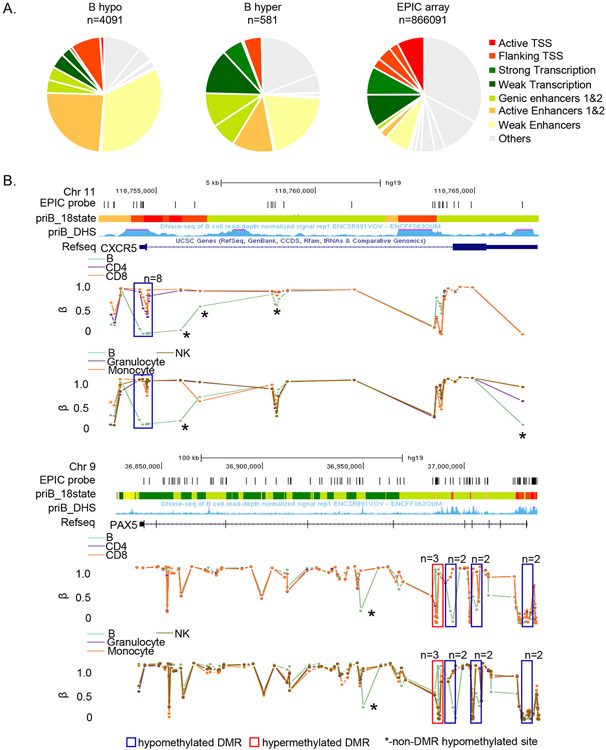
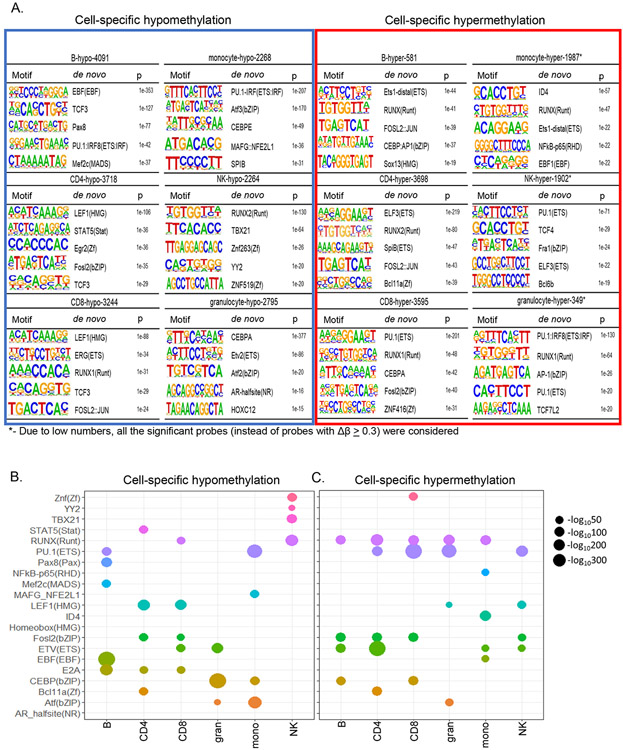
Epigenetic reprogramming underlies specification of immune cell lineages, but patterns that uniquely define immune cell types and the mechanisms by which they are established remain unclear. Here, we identified lineage-specific DNA methylation signatures of six immune cell types from human peripheral blood and determined their relationship to other epigenetic and transcriptomic patterns. Sites of lineage-specific hypomethylation were associated with distinct combinations of transcription factors in each cell type. By contrast, sites of lineage-specific hypermethylation were restricted mostly to adaptive immune cells. PU.1 binding sites were associated with lineage-specific hypo- and hypermethylation in different cell types, suggesting that it regulates DNA methylation in a context-dependent manner. These observations indicate that innate and adaptive immune lineages are specified by distinct epigenetic mechanisms via combinatorial and context-dependent use of key transcription factors. The cell-specific epigenomics and transcriptional patterns identified serve as a foundation for future studies on immune dysregulation in diseases and aging.

Keywords: DNA methylation; epigenetics; gene expression; human immunity; innate cells; lymphocytes; transcription factors.


Conflict of interest statement

Declaration of interests A. Battle holds stock in Google and is a consultant for Third Rock Ventures.

Figures

Figure 1.
Figure 1.. Genome-wide analyses identify cell-specific sites of DNA methylation in human immune cells.
A) Major immune cell types were purified from 55 individuals (age 22-83 years) using a combination of magnetic beads and flow cytometry. Sodium bisulfite treated genomic DNA was hybridized to Illumina MethylationEPIC arrays. B) After removing the low-quality probes, paired t-test was performed in each cell type comparing β values with every other cell types within an individual in all participants. Multiple testing correction was done at BH adjusted p≤ 0.05. Cell-specific sites of hypo- or hypermethylation were defined as those whose ∣Δβ∣ between a cell type and all other cell types was greater than ≥0.3. Cell-specific differentially methylated probes that were shared between individuals were used for all further analyses. Differentially methylated regions were determined based on the presence of 2 or more differentially methylated probes within 300bp (Figure S1E). C) Distribution of average β values in each cell type (top, color-coded as indicated). Number of individuals for each cell type is indicated in parenthesis. Principal component analysis of noob-BMIQ normalized β distributions in each cell type (bottom). Each sample is represented by a dot. D) Cell-specific sites of hypo- (blue) or hypermethylation (red) in human immune cells. Cell-specific sites of methylation were identified for each cell type as described in B with data from 24 individuals. Y axis represents the number of cell-specific probes identified in each cell type. Analysis from an independent cohort of 31 individuals is shown in SI Table 1. CD4 and CD8 were compared with the other 4 cell types. E) Heatmap representation of cell-specific sites of hypo- and hypermethylation and, for comparison, total peripheral blood mononuclear cells (green) and whole blood (grey). Each row corresponds to a cell-specific probe in the EPIC array and each cell type is represented by 19-23 individuals (columns) except for granulocytes for which n=10. F) Gene ontology (GO) analysis of genes associated with cell-specific hypo- or hypermethylated sites. Cell-specific hypo- and hypermethylated probes were mapped to genes based on Illumina Infinium MethylationEPIC annotation file. The number of genes corresponding to each cell type that are present in the Gene Ontology database are indicated at the bottom of the figure. These genes were used to identify enriched pathways at FDR adjusted p≤ 0.05; pathway enrichment FDR values are color-coded as indicated. Gene ratios (size of the bubbles) represent the fraction of genes in a cell type that are enriched in a specific pathway. See also Figure S1.
Figure 2.
Figure 2.. Cell-specific sites of differential methylation coincide with other cell-specific epigenetic marks.
A) Distribution of cell-specific hypo- and hypermethylated probes at promoters (< −1500bp/5’UTR, blue), intragenic regions (exon/intron/3’UTR, ochre) and intergenic regions (green). B) Cell-specific DMRs were defined by two or more hypo- or hypermethylated cell-specific probes located within 300bp. Hypo- (blue) and hypermethylated (red) DMR numbers in each cell type are indicated above the bars. C) Probe counts in cell-specific hypo- (blue) or hypermethylated (red) DMRs. Each dot represents the number of probes present in a cell-specific DMR. The minimum number of probes in a DMR is two. D) Relationship of B cell-specific hypo- and hypermethylated probes to other epigenetic marks. Data for DNase hypersensitive sites (DHS) and histone modifications in the indicated cell types was obtained from the ENCODE database. Only DHS data was available for CD4+ and CD8+ T cells individually; for all histone modifications ‘T’ refers to total T cells, ‘mono’ to monocytes and ‘NK’ to natural killer cells. Summary plots (top) and heatmaps (bottom) show the peak intensity of DHS or histone marks in ± 3kb region surrounding each B cell-specific hyper- (dark blue bar on the left) and hypomethylated (light orange bar on the left) site. Hypomethylated probes were further grouped into promoter (blue), intragenic (ochre) and intergenic regions (light green) following definitions in part A. Number of probes in each category are indicated within colored boxes. Corresponding patterns for all innate cell types are shown in Figure S3. E) Relationship of T cell-specific hypo- and hypermethylated probes to other epigenetic marks. Data for DNase hypersensitive sites (DHS) and indicated histone modifications was obtained from the ENCODE database and labeled as in D.
Figure 3.
Figure 3.. Cell-specific differentially methylated sites map to enhancers and actively transcribed regions.
A) B cell-specific hypo- (left) and hypermethylated (center) probes were assigned to 18 states defined by chromHMM algorithm. The 18-state chromHMM annotation for the B cell genome, based on 6 histone marks, was obtained from the Roadmap Epigenomics project. 8 major chromatin states are color-coded as indicated (details in Methods). Pie charts show the proportion of hypo- or hypermethylated probes in each state. Distribution of all MethylationEPIC array probes in the B cell chromHMM profile is shown on the right. B) Examples of loci with B cell-specific DMRs. β values for each EPIC probe (vertical lines) associated with CXCR5 and PAX5 loci in all immune cells are shown. The pattern in B cells is compared to T cells (top panel) or monocytes, granulocytes and NK cells (bottom panel) (color-coded as indicated). B cell-specific DMRs in each gene are boxed (n = numbers of differentially methylated probes in each DMR). Asterisks mark B cell-specific hypomethylated sites that are not part of DMRs. Tracks show genomic locations, positions of all MethylationEPIC array probes in the region, chromHMM based annotation (color coded as in A) and DHS in primary human B cells (obtained from ENCODE) for each locus.
Figure 4.
Figure 4.. Combinatorial patterns of transcription factor motifs mark cell-specific hypo- and hypermethylated sites.
A) De-novo HOMER analysis was performed with sequences 200bp around cell-specific hypo- and hypermethylated sites. For monocytes, NK cells and granulocytes all differentially hypermethylated sites (BH adjusted p≤0.05) were used in this analysis because very few sites met the Δβ ≥ 0.3 criterion. Top 5 transcription factor motifs identified at and around hypo- and hypermethylated sites are presented for each cell type. The background for HOMER analysis comprised of 135347 sites from MethylationEPIC microarray that were not differentially methylated in any pairwise comparison. B, C) Bubble plot representation of the top transcription factor motifs associated with cell-specific hypo- and hypermethylated sites. The size of the bubble is proportional to the log p value obtained from HOMER de-novo analysis.
Figure 5.
Figure 5.. EBF1, a prototypic methylation regulating factor, binds to hypomethylated sites in human B cells
A) EBF1 ChIP-Seq was carried out with naïve B cells from 3 donors. Pie chart shows the distribution of methylation sites within EBF1-bound regions. Colors represent categories of methylated sites as indicated below the pie charts, numbers within pie chart denote the number of EBF1 peaks in each category and numbers outside the pie chart (in red font) denote number of genes associated with EBF1 peaks after removing overlapping genes as annotated by HOMER. For example, 327 EBF1-bound regions had B cell-specific hypomethylated probes within 1kb of the peak; these peaks corresponded to 302 genes. B) Distribution of cell-specific hypo- (blue) and hypermethylated (red) probes within ± 0.5kb of EBF1-bound regions in B cells. Y axis represents the proportion of probes in each category compared to the total probes in that category. C) Epigenetic states of EBF1-bound regions in human B cells. DHS (left) and methylation states (right) of EBF1-bound sites in immune cell types as indicated above each panel. EBF1 binding sites were parsed according to genomic location (left, numbers of EBF1 peaks in each category are shown). Summary plots (top) and heatmaps (bottom) represent DHS data in primary human immune cells that was obtained from ENCODE and is displayed for a ±3kb window surrounding the EBF1 peak summit. The last two columns after the DHS set summarize EBF1ChIP-Seq in mature B cells; EBF1 ChIP peaks were called relative to input DNA. Methylation status of probes that lie within EBF1 peaks is represented as the β value for that site in each immune cell type. The order of EBF1 peaks is the same for both DHS and methylation heatmaps. Rows correspond to EPIC probes and columns correspond to multiple samples from each cell type (n = 23 (naïve B cells), 23 (naïve CD4+ T cells), 19 (naïve CD8+ T cells), 10 (granulocytes), 24 (monocytes) and 20 (NK cells)). D) Relationship of EBF1 binding and methylation status to gene expression. RNA-Seq analyses of three methylation-based categories of EBF1-bound genes as indicated above each graph. The average expression (Y axis, counts per million) in each cell type was obtained from RNA-seq analyses from 26 donors as described in the text. The horizontal line inside the box is the mean expression for that group, the upper and lower boundaries of the box are the 1st and 3rd quartile of data and the whiskers represent the minimum and maximum expression in the dataset. The significance of the difference in the mean expression of B cells to each of the other 5 cell types was evaluated with independent t-test (*** = p<0.0001). E) Relationship of B cell-selective gene expression to EBF1 binding and methylation states. Y axis shows proportion of genes in 3 methylation-based categories that are expressed selectively in B cells (see text); numbers of cell-selective genes in each category as well as total numbers of genes in that category (parentheses) are shown above the bars. Categories are color coded as in A: genes with B cell-specific hypomethylated sites within EBF1 peaks (blue), genes with hypomethylated probes (BH p<0.05) in B cells within EBF1 peaks (orange) and genes with uniformly lowly methylated probes in all cell types within EBF1 peaks (grey). Pie charts show the genomic location of EBF1 peaks in each category color-coded as indicated. * indicates Chi-square test p<0.001.
Figure 6.
Figure 6.. Relationship of cell-specific DNA methylation to gene expression differs between innate and adaptive cell types.
A) RNA-seq was carried out with RNA from each cell type from 26 donors across the age range (Fig S6A-B). Normalized counts per million (CPM) values were compared pairwise within individuals using DESeq2 to identify differentially expressed genes. Genes with ≥ 4-fold change in a cell type compared to all other cell types within an individual and shared by all individuals irrespective of age are referred to as cell-selective. Row Z-score derived from normalized CPM for each cell type as well as PBMC and whole blood are shown for each donor (columns). Darker shade in the pie charts show the proportion of cell-selective genes that are present in the MethylationEPIC array and contain cell-specific hypo- (orange) or hypermethylated (dark blue) sites. B) Waterfall plots showing promoter and gene body methylation status of cell-selective up- and downregulated genes. The methylation status at promoters (prom) and intragenic regions (intra) for cell-selective genes was calculated as mean Δβ = (average β cell of interest – average β other cells) and arranged in ascending order of Δβ value. Percentage of hypo- (negative Δβ) or hypermethylated (positive Δβ) genes in each cell type are shown. Top two rows show methylation status of genes that are selectively upregulated in each cell type; bottom two rows show methylation status of genes that are selectively downregulated in each cell type. C) Normalized expression of genes with B cell-specific hypo- or hypermethylated sites. B cell-specific hypo- (4091) and hypermethylated (581) probes mapped to 1627 and 268 genes, respectively, based on MethylationEPIC array annotation. Heatmap shows row Z scores of normalized CPM (scaled as in A) of B cell-specific hypo- (blue box) or hypermethylated (red box) genes with ≥ 4-fold differential expression in B cells compared to all 5 other cell types (left), to 2-4 other cell types (second set), compared to CD4+ and CD8+ T cells (third set) and to innate cell types (right). Representative genes in each category are shown. Number of genes in each category are shown in parentheses. Analyses of selectively-expressed genes in all other human immune cell types are provided in Figures S7A-D.

Similar articles

Cited by

References

    1. Andrews S (2010). FastQC: A Quality Control Tool for High Throughput Sequence Data.
    1. Aryee MJ, Jaffe AE, Corrada-Bravo H, Ladd-Acosta C, Feinberg AP, Hansen KD, and Irizarry RA (2014). Minfi: a flexible and comprehensive Bioconductor package for the analysis of Infinium DNA methylation microarrays. Bioinformatics 30, 1363–1369. - PMC - PubMed
    1. Bain G, Quong MW, Soloff RS, Hedrick SM, and Murre C (1999). Thymocyte maturation is regulated by the activity of the helix-loop-helix protein, E47. J Exp Med 190, 1605–1616. - PMC - PubMed
    1. Barndt R, Dai MF, and Zhuang Y (1999). A novel role for HEB downstream or parallel to the pre-TCR signaling pathway during alpha beta thymopoiesis. J Immunol 163, 3331–3343. - PubMed
    1. Benner C, Isoda T, and Murre C (2015). New roles for DNA cytosine modification, eRNA, anchors, and superanchors in developing B cell progenitors. Proc Natl Acad Sci U S A 112, 12776–12781. - PMC - PubMed

Publication types

Substances