. 2021 Oct 26;37(4):109902.
doi: 10.1016/j.celrep.2021.109902.

Arthritis flares mediated by tissue-resident memory T cells in the joint

Affiliations

Arthritis flares mediated by tissue-resident memory T cells in the joint

Margaret H Chang et al. Cell Rep. .

Abstract

Rheumatoid arthritis is a systemic autoimmune disease, but disease flares typically affect only a subset of joints, distributed in a distinctive pattern for each patient. Pursuing this intriguing pattern, we show that arthritis recurrence is mediated by long-lived synovial resident memory T cells (TRM). In three murine models, CD8+ cells bearing TRM markers remain in previously inflamed joints during remission. These cells are bona fide TRM, exhibiting a failure to migrate between joints, preferential uptake of fatty acids, and long-term residency. Disease flares result from TRM activation by antigen, leading to CCL5-mediated recruitment of circulating effector cells. Correspondingly, TRM depletion ameliorates recurrence in a site-specific manner. Human rheumatoid arthritis joint tissues contain a comparable CD8+-predominant TRM population, which is most evident in late-stage leukocyte-poor synovium, exhibiting limited T cell receptor diversity and a pro-inflammatory transcriptomic signature. Together, these findings establish synovial TRM as a targetable mediator of disease chronicity in autoimmune arthritis.

Keywords: CCL5; CD8; IL-1 receptor antagonist; arthritis flares; cell recruitment; methylated bovine serum albumin; ovalbumin; resident memory T cells; rheumatoid arthritis; synovium.


Conflict of interest statement

Declaration of interests R.A.C. has a pending patent application describing depletion of T(RM) as a strategy to treat autoimmune and inflammatory diseases. The other authors declare no relevant competing interests.

Figures

Figure 1.
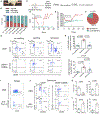
Figure 1.. Arthritis flare model identifies CD8 T cells as mediators of recurrent synovitis
(A) Diagram of mouse model of arthritis flare. I.A., intraarticular; i.p., intraperitoneal. (B) Representative images of wrists, knees, and ankles of arthritic mouse at day 7. Red circle denotes antigen-injected joint. (C) Measured wrist thickness at day 7, day 28, and day 31. Each dot represents one animal (n = 15, day 7 and 28; n = 9, day 31). p values from two-tailed paired Student’s t test. (D) Difference in wrist thickness of meBSA- versus PBS-injected joints over time (n = 15 mice). (E) Representative H&E of contralateral PBS- versus meBSA-injected knees from the same mouse at indicated time points. P, patella; F, femur; T, tibia; arrows mark inflammatory infiltrates. Scale bar, 50 μm. (F) Number of synovial T cells during remission and flare. Each dot represents one animal (n = 11, remission; n = 16, flare). p values from two-tailed Wilcoxon matched-pairs signed rank test. (G) Synovial T cell count after adoptive transfer of OT-I and OT-II. Each dot represents one animal (n = 6, OT-I; n = 6, OT-II). p values from two-tailed paired Student’s t test. (H) Representative contour plots of CD45.2+ donor-derived versus CD45.1+ host-derived CD4 and CD8 T cells in the synovium during remission and flare. (I) Graph quantifying CD45.2+ donor-derived CD4 and CD8 T cells in remission and flare. Each dot represents one animal (n = 6, remission; n = 7, flare). p value from two-way ANOVA with Sidak’s multiple comparisons test.
Figure 2.
Figure 2.. Distinct population of TRM-like memory T cells identified in previously inflamed synovium
(A) tSNE analysis comparing cellular protein expression in synovial T cells from PBS-injected (top row) versus OVA-injected (bottom row) joints pooled from the knees and ankles. Plot reflects 99 CD3+ T cells. Red circle highlights distinct cell population found in OVA-injected joints. (B) Representative contour plots comparing CD69 and CD103 expression in CD3+CD44+CD62L− T cells in the synovium of paired PBS-injected (top row) versus meBSA-injected (bottom row) joints from the same mouse. The left column reflects a mouse in remission, and the mouse in the right column was challenged with a systemic antigen to induce a flare. (C) Quantification of CD69+ and CD69+CD103+ CD44+CD62L− T cells during remission and flare. Each dot represents one animal (n = 12, remission; n = 7, flare). p values from two-tailed Wilcoxon rank-sum test.
Figure 3.
Figure 3.. Synovial memory T cells are true TRM
(A) Experimental design for tracking cells from a specific joint. (B) Representative dot plots of T cells pooled from the synovium of 4 mice at day 54. AAV-Cre-injected and contralateral PBS-injected knees are depicted in paired dot plots with a subanalysis of CD8 and CD4 expression in AAV-Cre-labeled T cells (EGFP+). (C) Number of AAV-Cre-labeled EGFP+ T cells (left) and percentage of CD44+CD62L−CD69+ TRM within EGFP+ T cells (right) at day 54. Each dot represents an independent experiment pooling synovium from 4 mice (n = 3). (D) Proportion of synovial naive T cells (TN, CD44−CD62L+) and resident memory T cells (TRM, CD44+CD62L−CD69+) migrating to an increasing concentration of CCL21 chemoattractant. Values displayed as fold change of cells migrated to the bottom compared to cells on top of the transwell. Each dot represents an independent experiment pooling synovium from 5 animals (n = 4). p value from one-way ANOVA. (E) Representative histogram of Bodipy FL C16 fatty acid uptake by TN, effector memory T cells (TEM, CD3+C44+CD62L−CD69−), and TRM pooled from synovium of 5 mice. Histogram reflects 225 TRM. (F) Bodipy FL C16 fatty acid uptake, depicted as mean fluorescence intensity. Each dot represents pooled synovium from one animal (n = 10). p value calculated from one-way ANOVA. (G) Experimental design for assessing TRM longevity. (H) Difference in wrist size between OVA- and PBS-injected wrists within the same animal. Each dot represents one animal (n = 5). p value from two-tailed Student’s t test. (I) Representative dot plot of CD69 and CD103 expression in CD44+CD62L− T cells from synovium on day 246. (J) Percentage of CD44+CD62L− T cells that are CD69+ or CD69+CD103+ joints at day 246. Each dot represents one animal (n = 6). p values from two-tailed Wilcoxon matched-pairs signed rank test.
Figure 4.
Figure 4.. TRM persist in drug-induced remission in spontaneous murine model of RA
(A) Representative photo of unilateral arthritis in IL-1 receptor antagonist deficient (IL-1rn/) BALB/c mice. (B) Prevalence of unilateral arthritis by age. (C) Experimental design for treating IL-1rn/ mice with unilateral joint swelling with anakinra and subsequent flare after withdrawal of treatment. (D and E) Arthritis score (D) and difference in joint measurements (E) of the inflamed joint (red) and contralateral uninflamed joint (green) (n = 10). (F) Laterality of flare in relation to initial arthritic joint after withdrawal of anakinra. p value from chi-square test. (G) Representative dot plots of CD3+ and CD44+CD62L− T cells in the synovium of joints without clinical swelling, with inflammation, and during anakinra-induced remission. (H) Graphs quantifying CD44+CD62L− memory T cells and TRM (CD44+CD62L−CD69+) within synovium of the described disease states. Each dot represents one animal. p values from one-way ANOVA. (I and J) Circulating T cells were depleted in IL-1rn/ mice with i.p. injection of anti-Thy1.2 antibody (250 μg) 7 days prior to collection. Representative dot plots showing anti-Thy1.2 antibody-mediated depletion of CD3+ T cells in the spleen (I) and T cell subsets in synovium (J). (K and L) Graphs quantifying naive and CD44+CD62L− memory T cells (n = 6, PBS; n = 5, anti-Thy1.2) (K) and CD69+ and CD69+CD103+ memory T cells (n = 9, PBS; n = 5, anti-Thy1.2) (L) within synovium. Each dot represents one animal. p values from two-tailed Student’s t test.
Figure 5.
Figure 5.. Arthritis flare is dependent on recruitment of circulating lymphocytes
(A) Experimental design for inhibiting circulating lymphocytes with FTY720 (20 μg) in meBSA-induced arthritis (black) or with OT-I adoptive transfer and OVA-induced arthritis (red). (B and C) Graphs depicting wrist thickness (B) and prevalence of TRM (C) in PBS- versus meBSA-injected joints at day 31 flare with FTY720 inhibition. Each dot represents one mouse; line connects contralateral joints within the same animal (n = 10, PBS; n = 14, meBSA without FTY720; n = 16, meBSA with FTY720). p values from two-tailed paired Student’s t test. (D) Number of proliferating Ki67+ TRM. (E) Ki67+ TRM as a percentage of total CD3+ T cells. Each dot represents one mouse (n = 10, PBS; n = 5, OVA). p values from two-tailed Mann-Whitney test. (F) Experimental design for inhibiting lymphocyte recruitment with isotype or anti-CCL5 antibody (1 μg/dose). (G) Representative dot plot of CCL5 expression in CD3+CD44+CD62L− T cells with and without re-stimulation with OVA. (H) CCL5 expression in synovial CD3+ cells and CD44+CD62L− T cells during flare assessed by intracellular cytokine staining. Each dot represents one mouse (n = 3, IA PBS; n = 8, IA OVA). p values from two-tailed Student’s t test. (I and J) Graphs depicting wrist thickness (I) and CD3 T cells (J) in PBS- versus OVA-injected joints at day 31 flare with isotype or anti-CCL5 neutralizing antibody. Each dot represents one mouse; line connects contralateral joints within the same animal (n = 11, PBS; n = 13, OVA without inhibitor; n = 8, OVA with isotype or anti-CCL5 antibody). p values from two-tailed paired Student’s t test.
Figure 6.
Figure 6.. Depletion of synovial-resident T cells in remission abrogates arthritis flare
(A) Experimental design for localized synovial T cell depletion. (B) Representative dot plot of synovial lymphocytes from DT-injected and PBS-injected knees collected 72 h after I.A. injection. (C) Graph quantifying CD3+ T cells as a percentage of total CD45+ lymphocytes in synovium of DT-treated versus non-treated knees. p value calculated from two-tailed paired Student’s t test. Each dot represents one animal (n = 6 mice). (D and E) Representative H&E images (D) and inflammatory score (E) of contralateral knees from the same mouse with or without DT injection after i.p. re-stimulation for flare at day 45. Each dot represents one animal (n = 15). p value from two-tailed Wilcoxon rank-sum test. S, synovium. Scale bar, 50 μm. (F–I) Graphs showing percentage of TRM or CD45+ myeloid cells (see Figure S1) in the synovium in meBSA-injected joints with or without I.A. DT treatment. (F and H) Data compare the flare response with and without DT treatment. (G and I) Data evaluate the effect of DT injection compared to the contralateral control joint. p values calculated from two-tailed paired Student’s t test. Each dot represents one animal (n = 17 mice/condition). Line connects contralateral joints within the same mouse.
Figure 7.
Figure 7.. Oligoclonal CD8 TRM enriched in late-stage, non-inflamed RA synovial tissue
(A) Representative immunofluorescence image of human RA synovium co-stained for CD3, CD8, CD45RO, CD69, and CD103 proteins and DAPI nuclear stain. Scale bar, 50 μm. Red circle indicates cells positive for all five biomarkers. Insert magnifies a circled cell; scale bar, 5 μm. (B) Prevalence of CD8 and CD4 T cells expressing CD45RO memory and CD69 and CD103 markers. Each dot represents the average cell count from five fields from each donor (n = 4). p values from two-tailed paired Student’s t test. (C) tSNE plot of CD3+CD45RO+ cells from disaggregated RA synovium pooled from five donors. Each dot represents one cell. Color-coded clusters designate cells with similar gene expression profiles. (D) Violin plot of CD4 and CD8 expression in each cluster. (E) Gene expression heatmap of TRM-associated genes. Red, increased expression; blue, decreased expression. (F) Hypergeometric probability of overlap between differentially expressed (DE) genes of each cluster and TRM gene expression signature from the lung based on CD4 and CD8 cell type (Kumar et al., 2017). (G and H) Principal component analysis (PCA) of cluster 3 DE genes in microarray expression data from healthy controls (HC), osteoarthritis (OA), and rheumatoid arthritis (RA) synovium published in (G) Woetzel et al. (2014) (n = 30) and (H) Ungethuem et al. (2010) (n = 15). Each bar represents one donor. (I and J) PCA of cluster 3 DE genes in T lymphocytes from RA synovial tissue (Zhang et al., 2019). Bar plots showing cluster 3 TRM gene signature in (I) leukocyte-rich versus leukocyte-poor RA synovium and (J) early-stage RA versus late-stage non-inflamed RA synovium. Each bar represents one donor (n = 34). (K) Histogram of cells with the same TCR-alpha and -beta CDR3 sequence. (L) Top 0.5% of most frequent T cell clones overlaid on the tSNE plot. (M) Clonality index for each cell cluster. Each dot represents one donor (n = 5). p values from one-way ANOVA.

Comment in

References

    1. Ai R, Laragione T, Hammaker D, Boyle DL, Wildberg A, Maeshima K, Palescandolo E, Krishna V, Pocalyko D, Whitaker JW, et al. (2018). Comprehensive epigenetic landscape of rheumatoid arthritis fibroblast-like synoviocytes. Nat. Commun 9, 1921. - PMC - PubMed
    1. Akitsu A, Ishigame H, Kakuta S, Chung SH, Ikeda S, Shimizu K, Kubo S, Liu Y, Umemura M, Matsuzaki G, et al. (2015). IL-1 receptor antagonist-deficient mice develop autoimmune arthritis due to intrinsic activation of IL-17-producing CCR2(+)Vγ6(+)γδ T cells. Nat. Commun 6, 7464. - PMC - PubMed
    1. Barber EK, Dasgupta JD, Schlossman SF, Trevillyan JM, and Rudd CE (1989). The CD4 and CD8 antigens are coupled to a protein-tyrosine kinase (p56lck) that phosphorylates the CD3 complex. Proc. Natl. Acad. Sci. USA 86, 3277–3281. - PMC - PubMed
    1. Boyman O, Hefti HP, Conrad C, Nickoloff BJ, Suter M, and Nestle FO (2004). Spontaneous development of psoriasis in a new animal model shows an essential role for resident T cells and tumor necrosis factor-alpha. J. Exp. Med 199, 731–736. - PMC - PubMed
    1. Chang MH, and Nigrovic PA (2019). Antibody-dependent and -independent mechanisms of inflammatory arthritis. JCI Insight 4, e125278. - PMC - PubMed

Publication types