. 2021 Oct 26;37(4):109883.
doi: 10.1016/j.celrep.2021.109883.

β2-adrenergic receptor signaling regulates metabolic pathways critical to myeloid-derived suppressor cell function within the TME

Affiliations

β2-adrenergic receptor signaling regulates metabolic pathways critical to myeloid-derived suppressor cell function within the TME

Hemn Mohammadpour et al. Cell Rep. .

Abstract

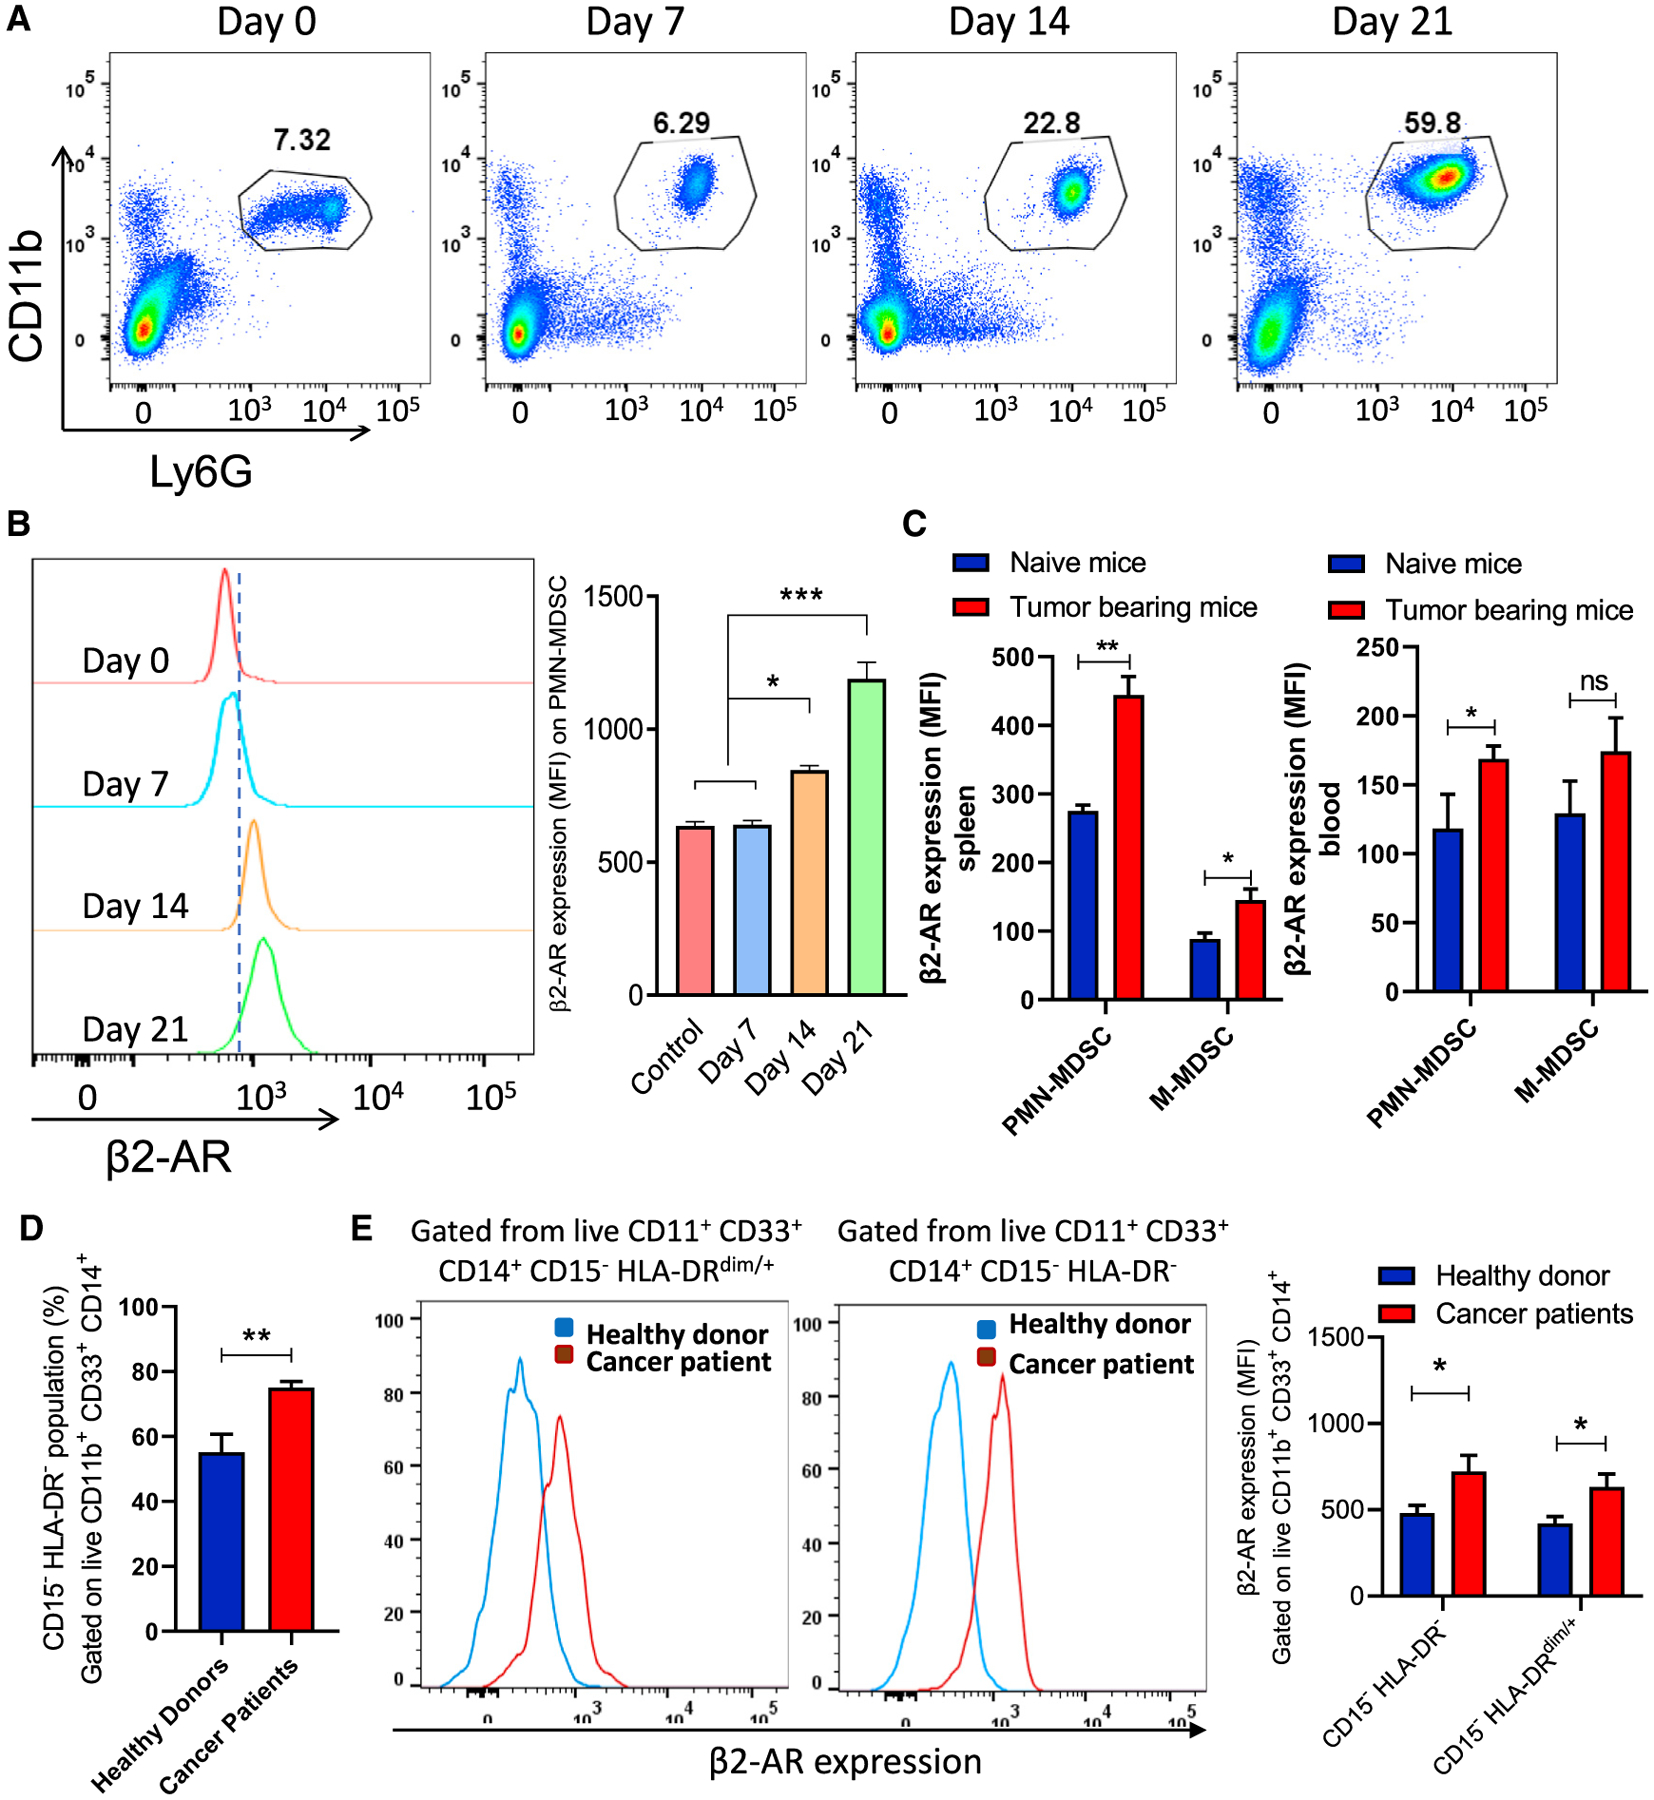
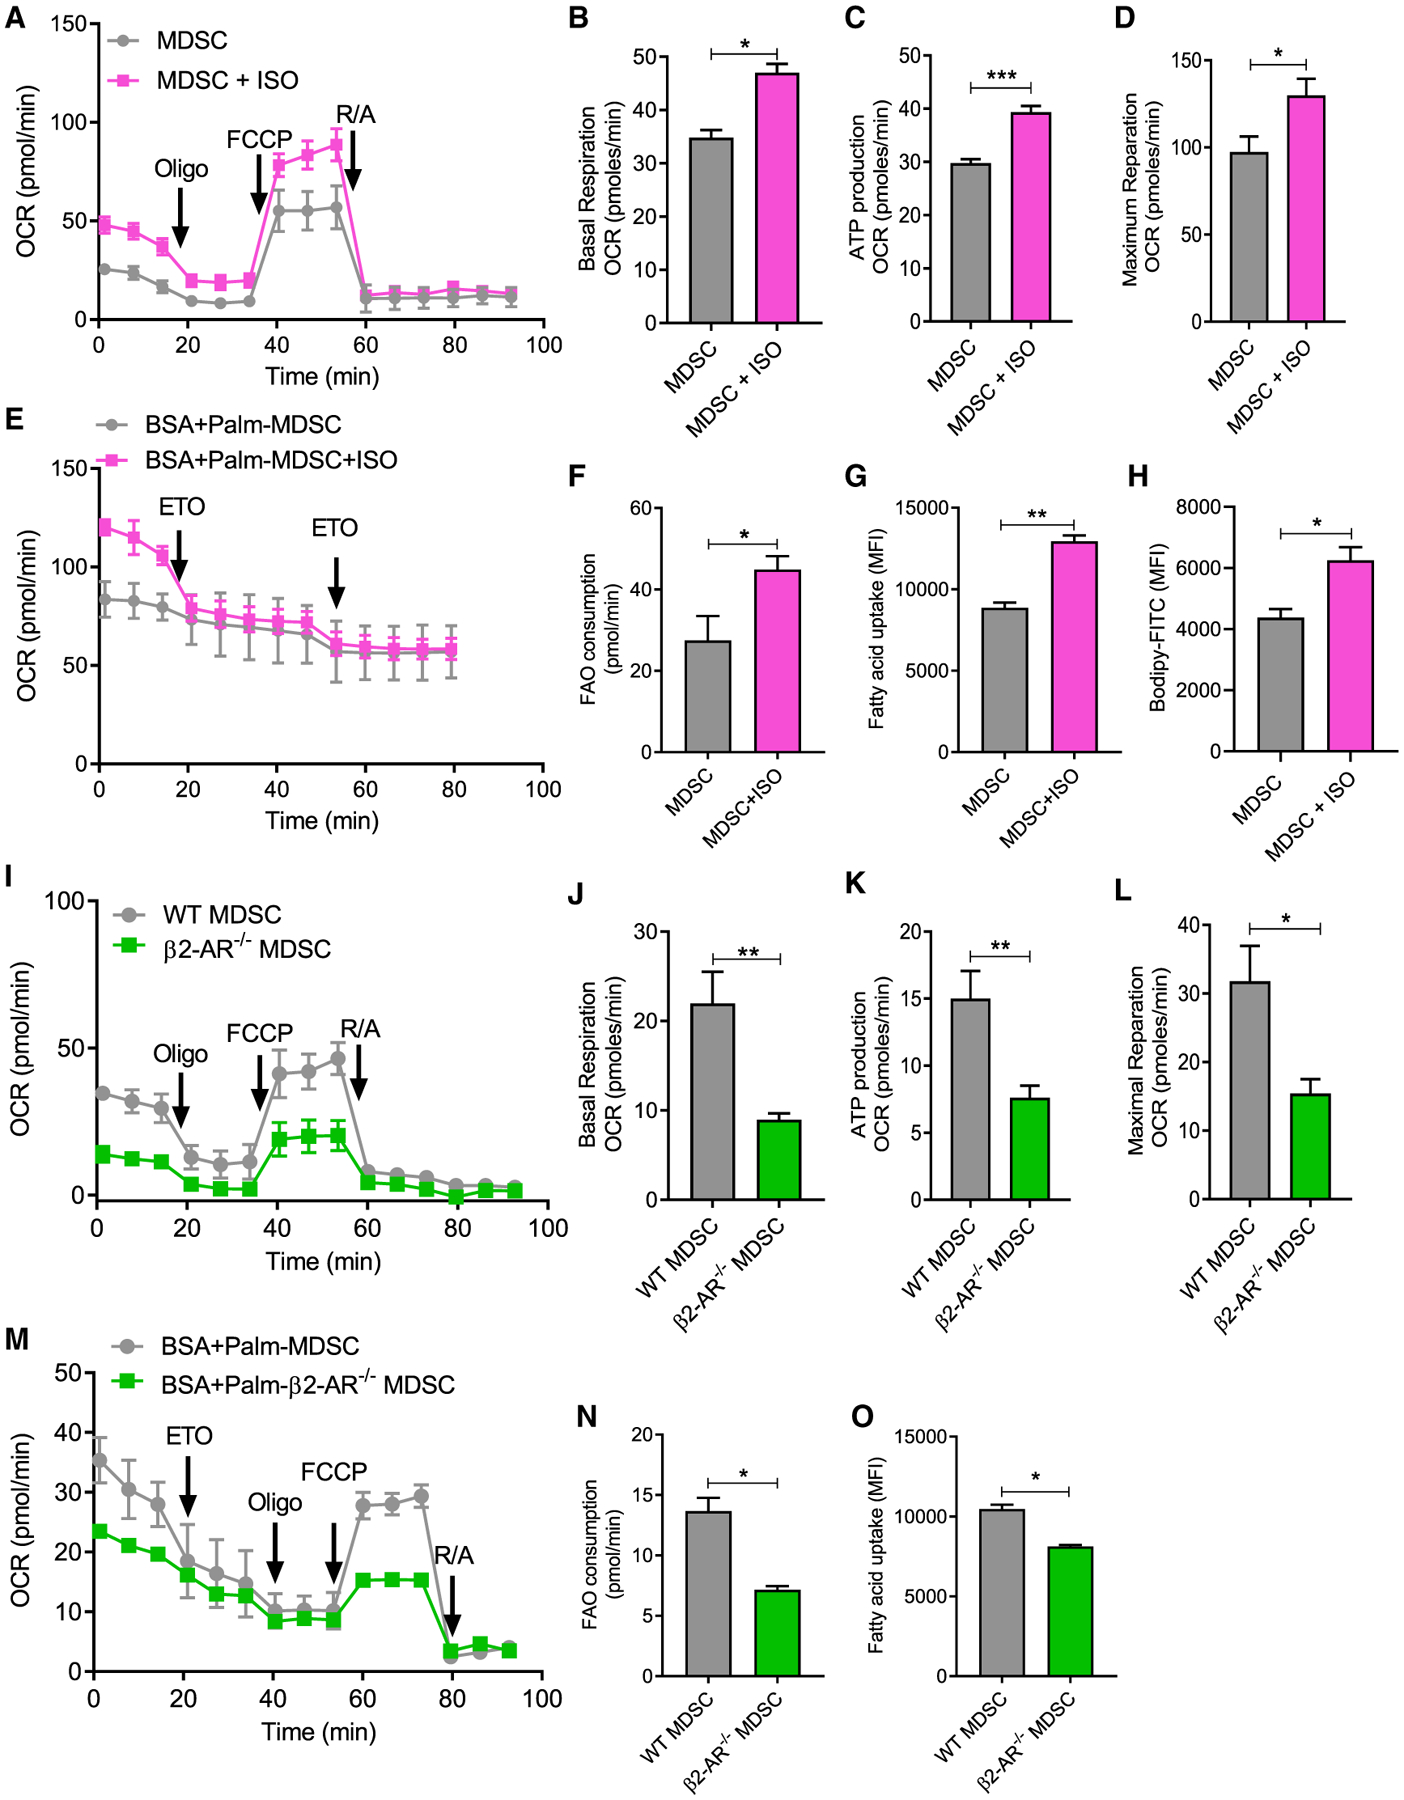
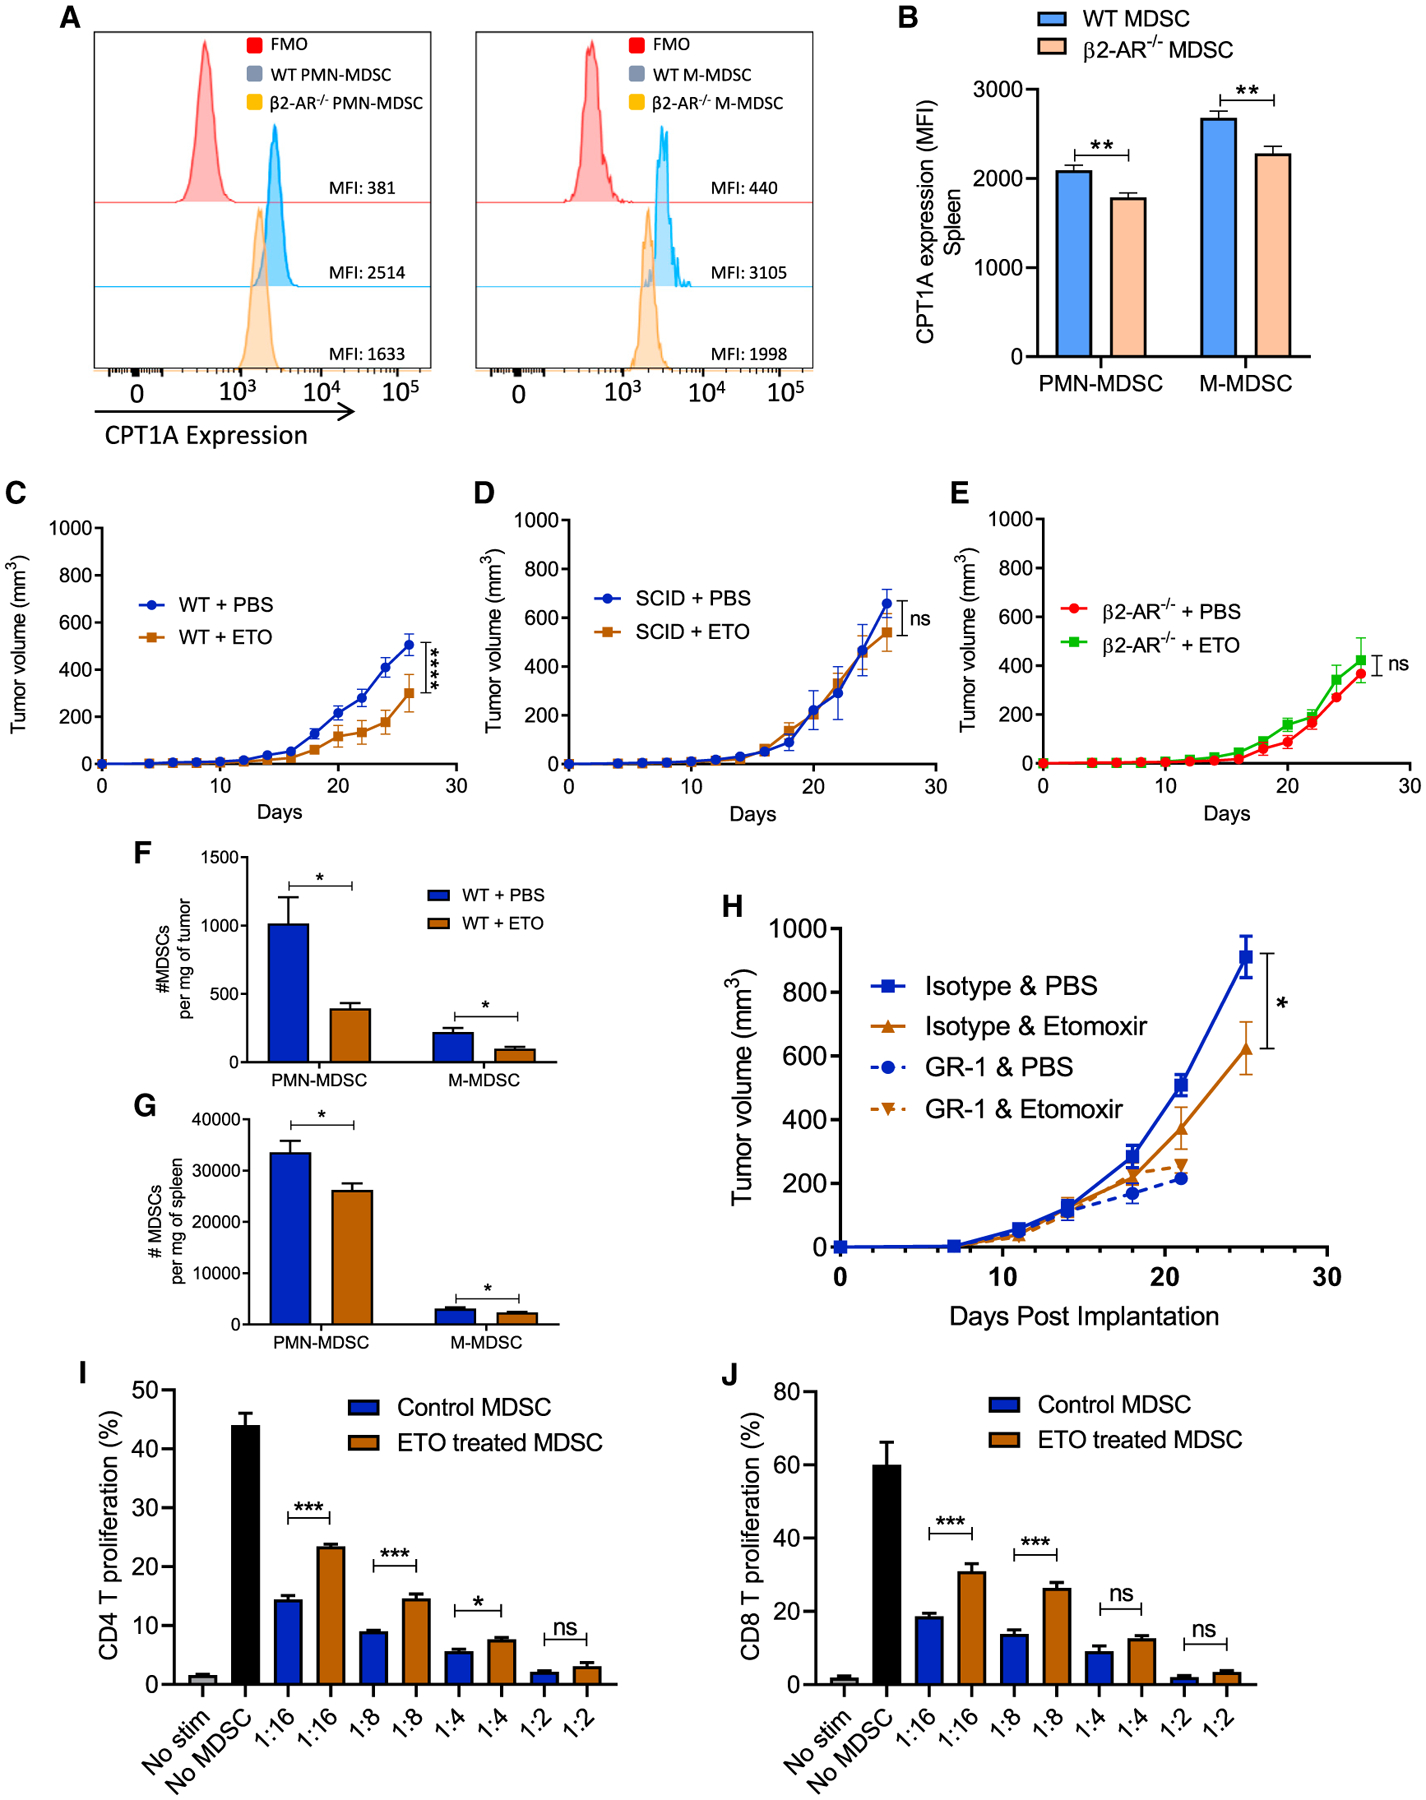
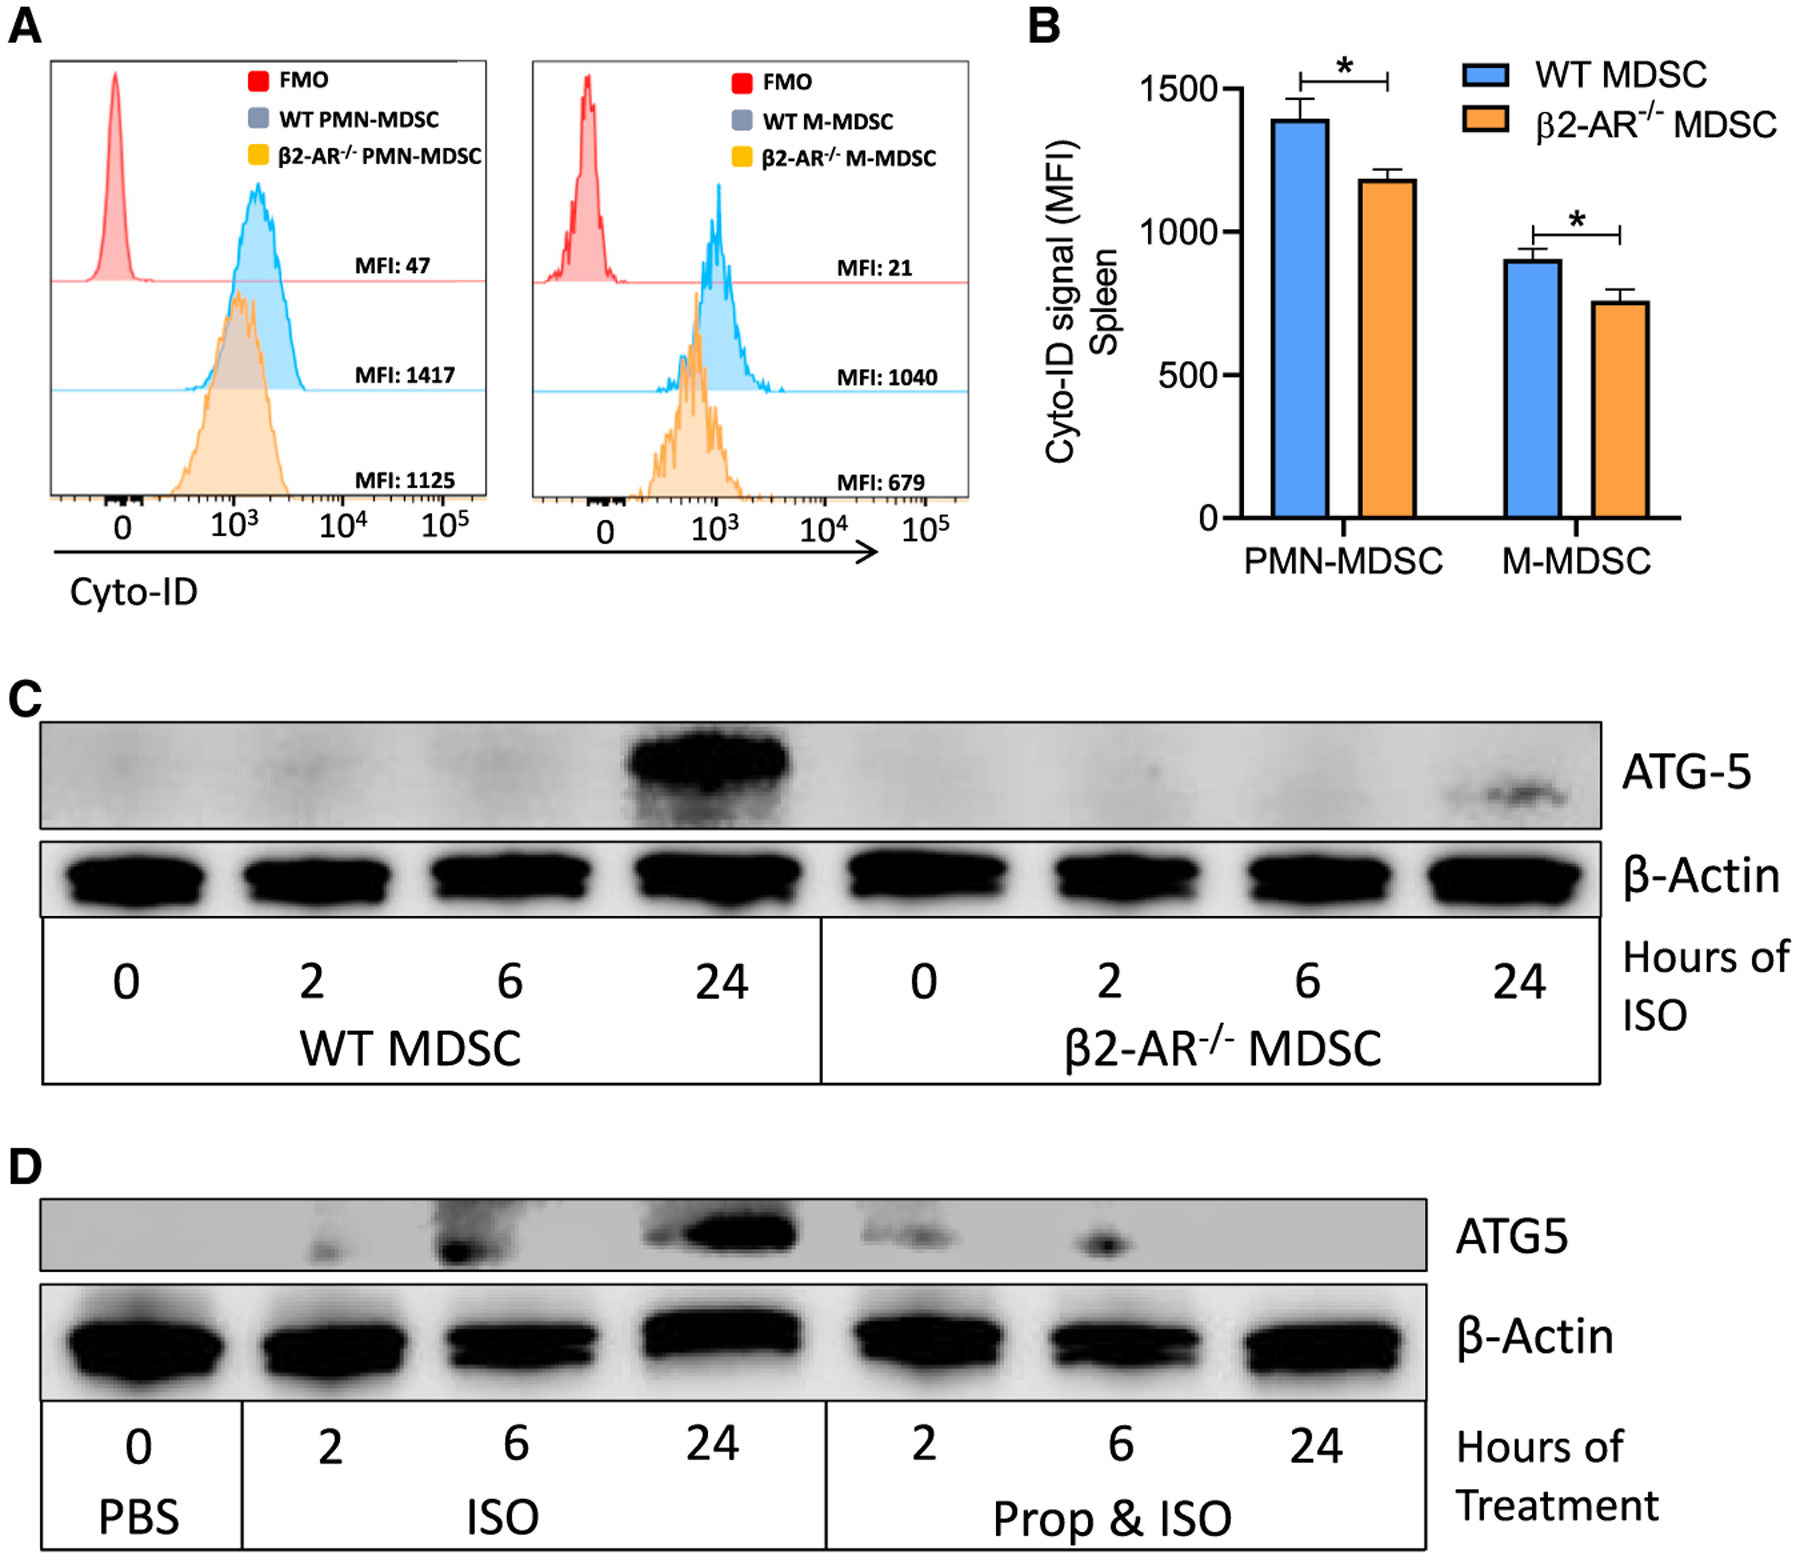
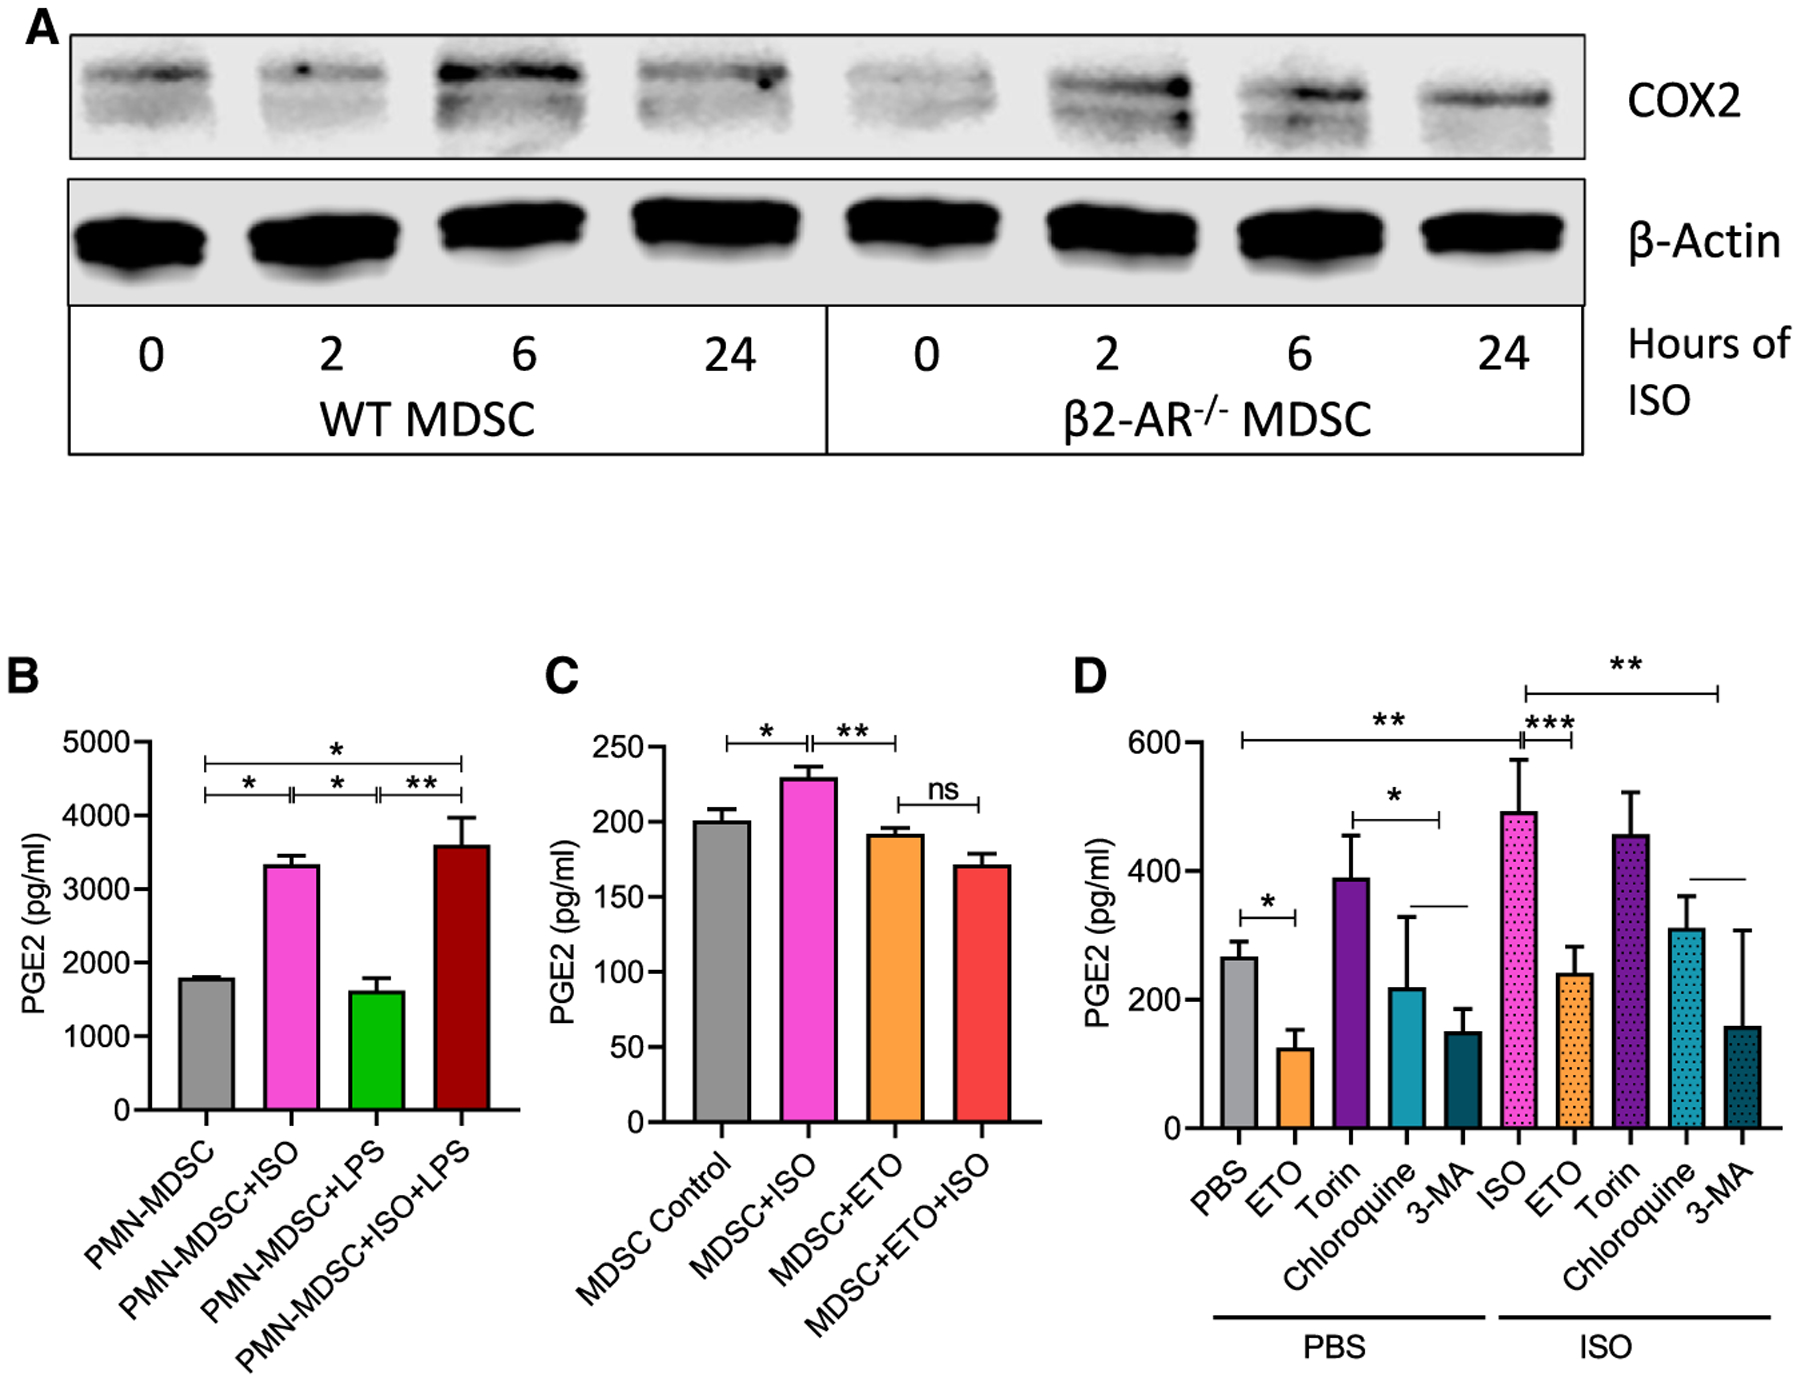
Myeloid-derived suppressor cells (MDSCs) impede antitumor immunity; however, the precise mechanisms that regulate their suppressive function remain unresolved. Identifying these mechanisms could lead to therapeutic interventions to boost cancer immunotherapy efficacy. Here, we reveal that β2 adrenergic receptor (β2-AR) expression on MDSCs increases with tumor growth and that the β2-AR stress pathway drives the immune suppressive activity of MDSCs by altering their metabolism. We show that β2-AR signaling decreases glycolysis and increases oxidative phosphorylation and fatty acid oxidation (FAO). It also increases expression of the fatty acid transporter CPT1A, which is necessary for the FAO-mediated immunosuppressive function of MDSCs. Moreover, we show that β2-AR signaling increases autophagy and activates the arachidonic acid cycle, both required for increasing the release of the immunosuppressive mediator, PGE2. Our data reveal that β2-AR signaling triggered by stress is an important physiological regulator of key metabolic pathways in MDSCs, driving their immunosuppressive function.

Keywords: MDSCs; autophagy; cancer; fatty acid oxidation; immune suppression; metabolism; oxidative phosphorylation; prostaglandin E2; stress; β-adrenergic signaling.


Conflict of interest statement

Declaration of interests The authors declare no competing interests.

Figures

Figure 1.
Figure 1.. The expression of β2-AR in MDSCs increases with tumor growth
(A) Representative flow cytometry analysis of the PMN-MDSC subpopulation percentage in the spleen of 4T1 tumor-bearing mice at different time points after tumor injection. (B) Histogram representative of β2-AR expression in PMN-MDSCs (gated on live CD45+ CD11b+ Ly6G+ cells) from spleens of 4T1 tumor-bearing mice in different time points (n = 5). (C) The expression of β2-AR in MDSCs from the spleen and blood of EL-4 tumor-bearing mice (n = 5) at day 25 after tumor implantation. (D) The frequency of MDSCs in healthy donors and patients with cancer. (E) The expression of β2-AR on MDSCs in healthy donors (n = 5) and patients with cancer (n = 5). Mouse data are presented as means ± SDs from 3 biological replicates in all of the graphs, and 1-way ANOVA was used to analyze statistical significance between >2 groups. In all of the panels, *p < 0.05, **p < 0.01, and ***p < 0.001. p < 0.05 was considered significant.
Figure 2.
Figure 2.. β-AR signaling in MDSCs decreases glycolysis and enhances oxidative phosphorylation
(A–H) MDSCs were derived from bone marrow in the presence of GM-CSF and IL-6, with or without isoproterenol (ISO). (A) Mitochondrial respiration was measured using a Seahorse Extracellular Flux Analyzer (arrows indicate when reagents were added: (1) oligomycin; (2) FCCP; and (3) antimycin A and rotenone). (B) Basal respiration levels. (C) ATP production. (D) Maximum respiration. (E) FAO was measured using a Seahorse Extracellular Flux Analyzer in media in which palmitate was the only fatty acid source (arrows indicate when etomoxir [ETO] was added). (F) FAO consumption. (G and H) MDSCs were derived from bone marrow in the presence of GM-CSF and IL-6, with or without ISO and (G) fatty acid uptake (Bodipy FL C16) and (H) lipid accumulation (Bodipy FL 493/503) was measured. (I–O) WT and β2-AR−/− mice were orthotopically implanted with 4T1 tumor cells. At day 25, WT or β2-AR−/− PMN- MDSCs were sorted by flow cytometry and the rates of (I–L) oxidative phosphorylation, (M and N) FAO, and (O) fatty acid uptake were measured. Mitochondrial respiration was measured using a Seahorse Extracellular Flux Analyzer (arrows indicate when reagents were added: [1] oligomycin; [2] carbonyl cyanide p-trifluoromethoxy-phenylhydrazone [FCCP]; and [3] antimycin A and rotenone). (J) Basal respiration levels. (K) ATP production. (L) Maximal respiration. (M and N) FAO was measured using a Seahorse Extracellular Flux Analyzer in media in which palmitate was the only fatty acid source (arrows indicate when ETO was added). (N) FAO consumption. (O) WT and β2-AR−/− PMN-MDSCs were sorted from 4T1 tumor-bearing mice, and fatty acid uptake in WT or β2-AR−/− were analyzed by flow cytometry. These data are presented as means ± SDs from 3 biological replicates in all of the graphs, and the Student’s t test was used to analyze statistical significance between 2 groups. In all of the panels, *p < 0.05, **p < 0.01, and ***p < 0.001. p < 0.05 was considered significant.
Figure 3.
Figure 3.. Fatty acid oxidation (FAO) inhibition decreases MDSC populations in tumor-bearing mice
(A) Histogram presentation of CPT-1 expression in WT versus β2-AR−/− MDSC isolated from WT and β2-AR−/− 4T1 tumor-bearing mice. (B) CPT1A expression in splenic MDSCs isolated from WT or β2-AR−/− 4T1 tumor-bearing mice. (C) Tumor growth kinetics in WT or β2-AR−/− mice orthotopically injected with 4T1 tumor cells receiving PBS or ETO (intraperitoneal [i.p.] daily injection) (n = 10). (D) Tumor growth kinetics in SCID mice orthotopically injected with 4T1 tumor cells receiving PBS or ETO (i.p. daily injection) (n = 5). (E) Tumor growth kinetics in β2-AR−/− mice orthotopically injected with 4T1 tumor cells receiving PBS or ETO (i.p. daily injection) (n = 10). (F and G) Absolute number of PMN-MDSCs and M-MDSCs in the tumors and spleens of tumor-bearing mice (4T1) on day 25 after tumor injection treated with PBS or ETO. (H) 4T1-bearing WT mice were injected with isotype or anti-Gr-1 antibodies (i.p. 200 μg per mouse every 4 days), in combination with PBS or ETO, and tumor growth was monitored. The data presented are from groups of 5–10 mice from 2 replicate studies. (I and J) WT mice orthotopically injected with 4T1 cells. Mice were treated with PBS or etomoxir for 25 days. On day 25, PMN-MDSCs were sorted from the spleen using an MDSC isolation kit. Isolated MDSCs were cultured with T cells in the presence of CD3/CD18 beads and IL-2 in various ratios, and CD4 and CD8 proliferation were measured (n = 3). Two-way ANOVA was used to analyze statistical significance between tumor growth in different groups. Data are presented as means ± SDs. The Student’s t test was used to analyze statistical significance between 2 groups. In all of the panels, *p < 0.05, **p < 0.01, ***p < 0.001, and ****p < 0.0001. p < 0.05 was considered significant.
Figure 4.
Figure 4.. β2-AR signaling in MDSCs increases autophagy
(A) Histogram presentation of Cyto-ID staining of autophagy vesicles in WT versus β2-AR−/− MDSC isolated from the spleens of WT and β2-AR−/− 4T1 tumor-bearing mice. (B) Autophagy levels in splenic MDSCs isolated from WT or β2-AR−/− 4T1 tumor-bearing mice. (C) PMN-MDSCs were sorted from WT and β2-AR−/− tumor-bearing mice. MDSCs were activated with or without ISO and ATG-5 expression was analyzed by using western blot. (D) PMN- MDSCs were sorted from WT 4T1 tumor-bearing mice and ATG-5 expression was measured by western blot in MDSCs treated with ISO or propranolol plus ISO. These data are presented as means ± SDs from 3 biological replicates in all of the graphs, and the Student’s t test was used to analyze statistical significance between 2 groups. In all of the panels, *p < 0.05, **p < 0.01, and ***p < 0.001. p < 0.05 was considered significant.
Figure 5.
Figure 5.. Higher FAO leads to increased levels of PGE2 production through COX2 overexpression
(A) PMN-MDSCs were sorted from WT and β2-AR−/− tumor-bearing mice. MDSCs were activated with or without ISO, and COX2 expression was analyzed by western blot. (B) PMN-MDSCs were sorted from WT tumor-bearing mice. MDSCs were activated with ISO, LPS, or ISO plus LPS for 24 h, and PGE2 levels were measured by ELISA (n = 3). (C) Human peripheral blood mononuclear cells (PBMCs) were cultured with IL-6 and GM-CSF for 7 days, treated with ISO, ETO, or ISO plus ETO, and at day 7, the level of PGE2 was measured by ELISA. (D) PMN-MDSCs were sorted from bone marrow of WT EL-4 tumor-bearing mice. MDSCs were treated for 24 h with either PBS or ISO, and ETO, torin 1, chloroquine, or 3-methyladenine and PGE2 levels were measured by ELISA. These data are presented as means ± SDs from 3 biological replicates in all of the graphs. One-way ANOVA was used to analyze the statistical significance between >2 groups, and the Student’s t test was used to analyze the statistical significance between 2 groups. In all of the panels, *p < 0.05, **p < 0.01, and ***p < 0.001. p < 0.05 was considered significant.

References

    1. Abuatiq A, Brown R, Wolles B, and Randall R (2020). Perceptions of stress: patient and caregiver experiences with stressors during hospitalization. Clin. J. Oncol. Nurs 24, 51–57. - PubMed
    1. Al-Khami AA, Zheng L, Del Valle L, Hossain F, Wyczechowska D, Zabaleta J, Sanchez MD, Dean MJ, Rodriguez PC, and Ochoa AC (2017). Exogenous lipid uptake induces metabolic and functional reprogramming of tumor-associated myeloid-derived suppressor cells. OncoImmunology 6, e1344804. - PMC - PubMed
    1. Alissafi T, Hatzioannou A, Mintzas K, Barouni RM, Banos A, Sormendi S, Polyzos A, Xilouri M, Wielockx B, Gogas H, and Verginis P (2018). Autophagy orchestrates the regulatory program of tumor-associated myeloid-derived suppressor cells. J. Clin. Invest 128, 3840–3852. - PMC - PubMed
    1. Alshetaiwi H, Pervolarakis N, McIntyre LL, Ma D, Nguyen Q, Rath JA, Nee K, Hernandez G, Evans K, Torosian L, et al. (2020). Defining the emergence of myeloid-derived suppressor cells in breast cancer using single-cell transcriptomics. Sci. Immunol 5, eaay6017. - PMC - PubMed
    1. Biswas SK (2015). Metabolic reprogramming of immune cells in cancer progression. Immunity 43, 435–449. - PubMed

Publication types

MeSH terms