. 2021 Oct 26;37(4):109891.
doi: 10.1016/j.celrep.2021.109891.

Structural and compositional diversity in the kainate receptor family

Affiliations

Structural and compositional diversity in the kainate receptor family

Purushotham Selvakumar et al. Cell Rep. .

Abstract

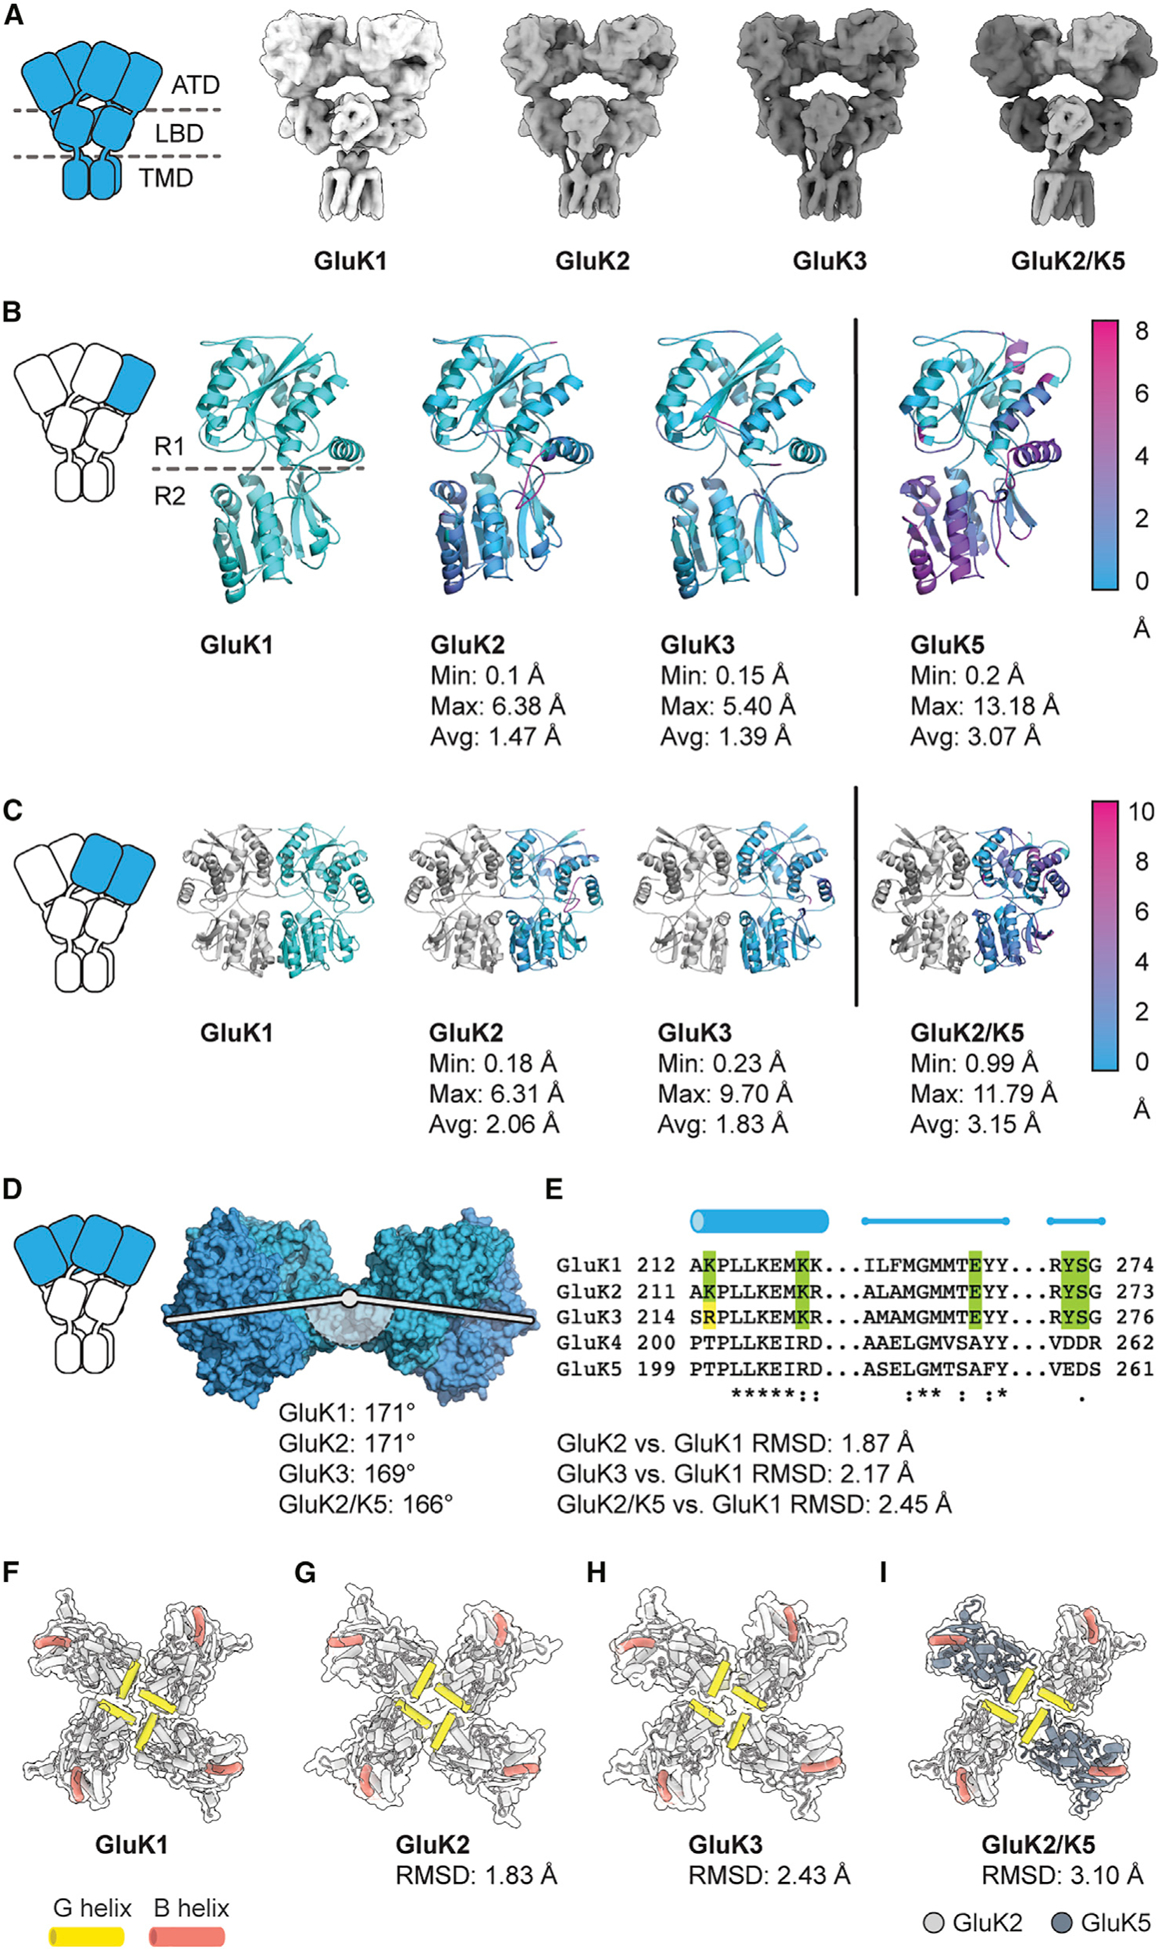
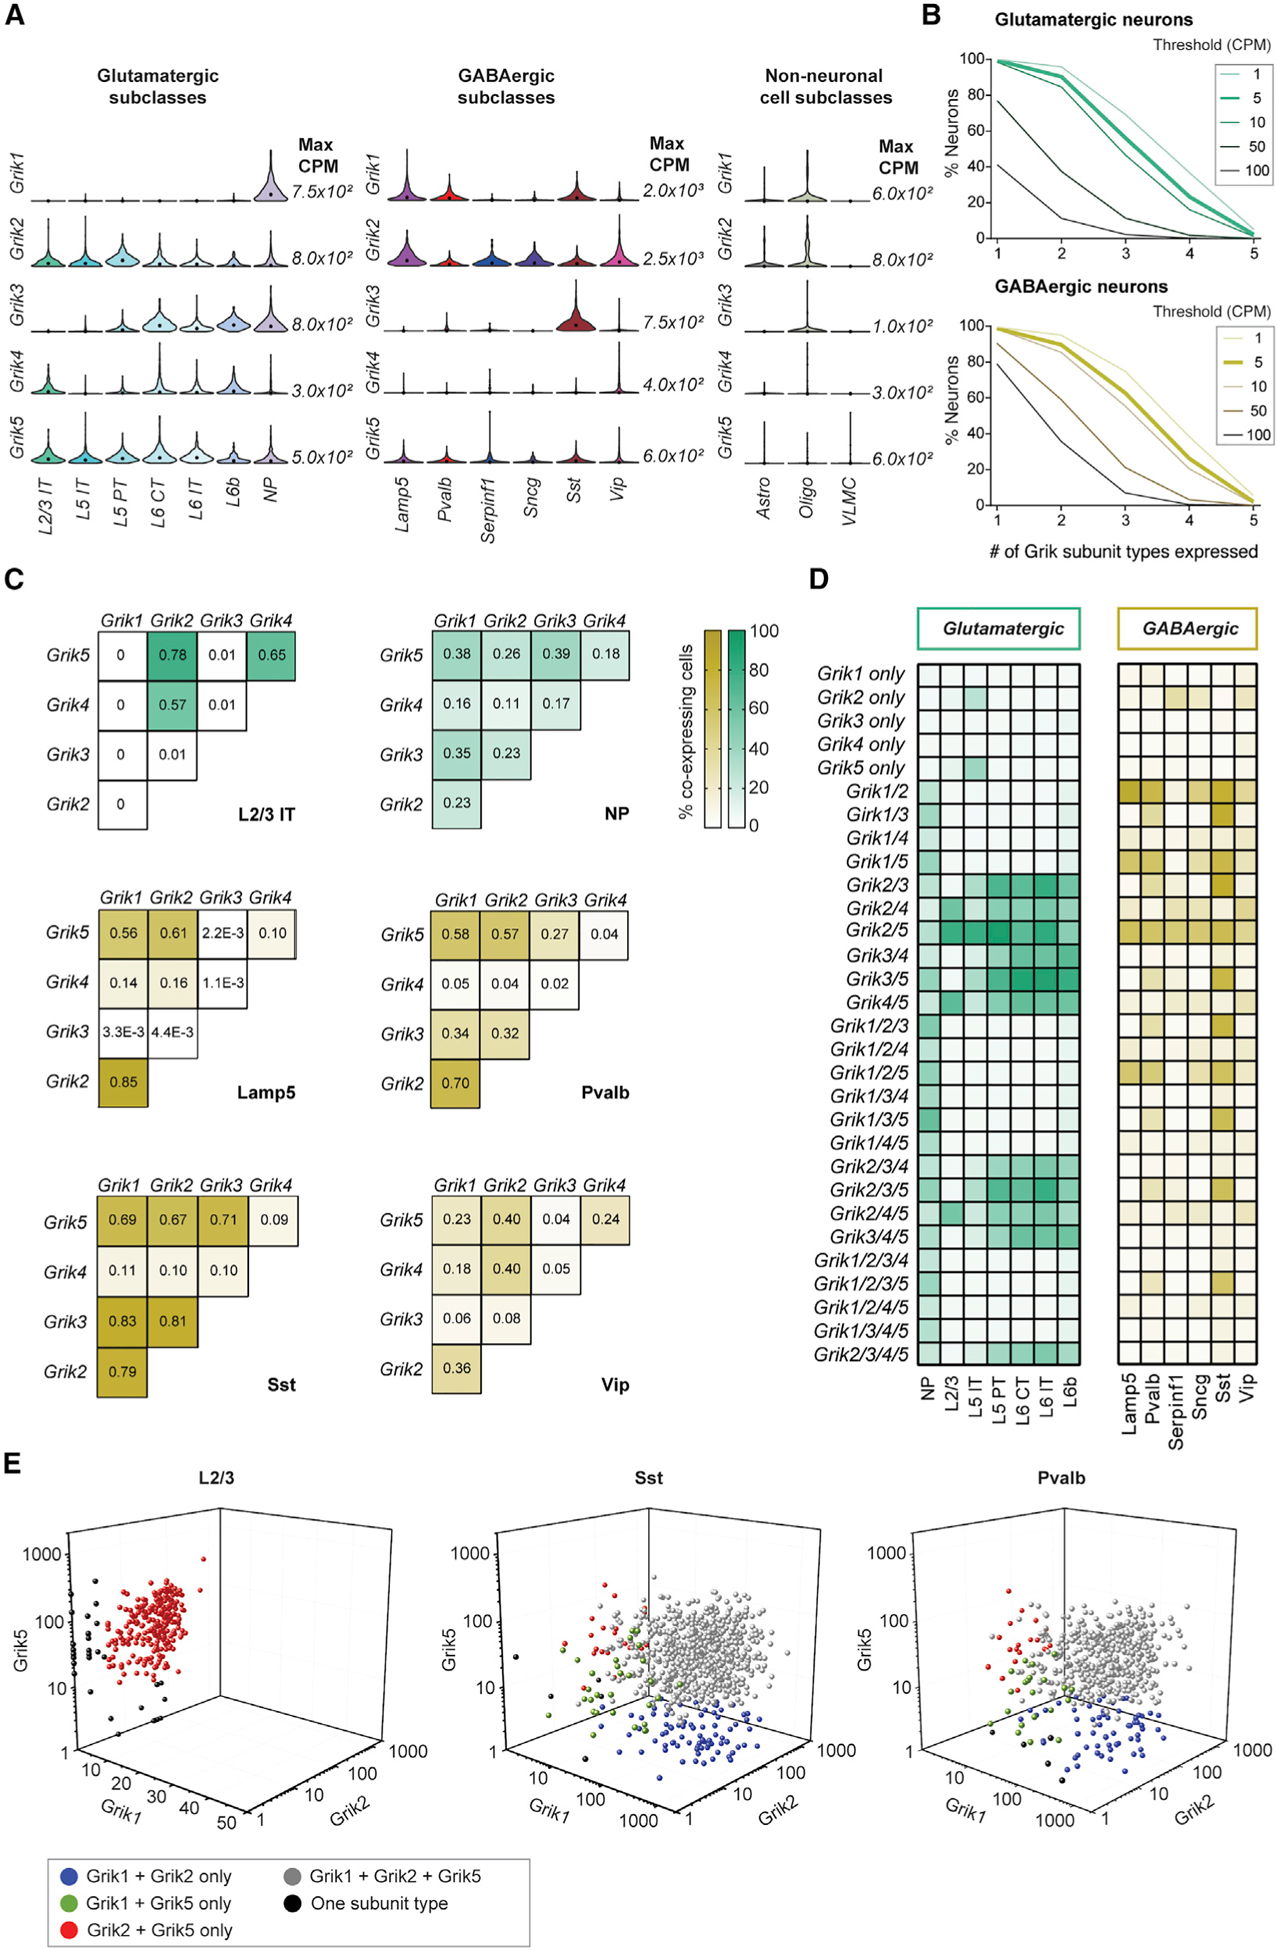
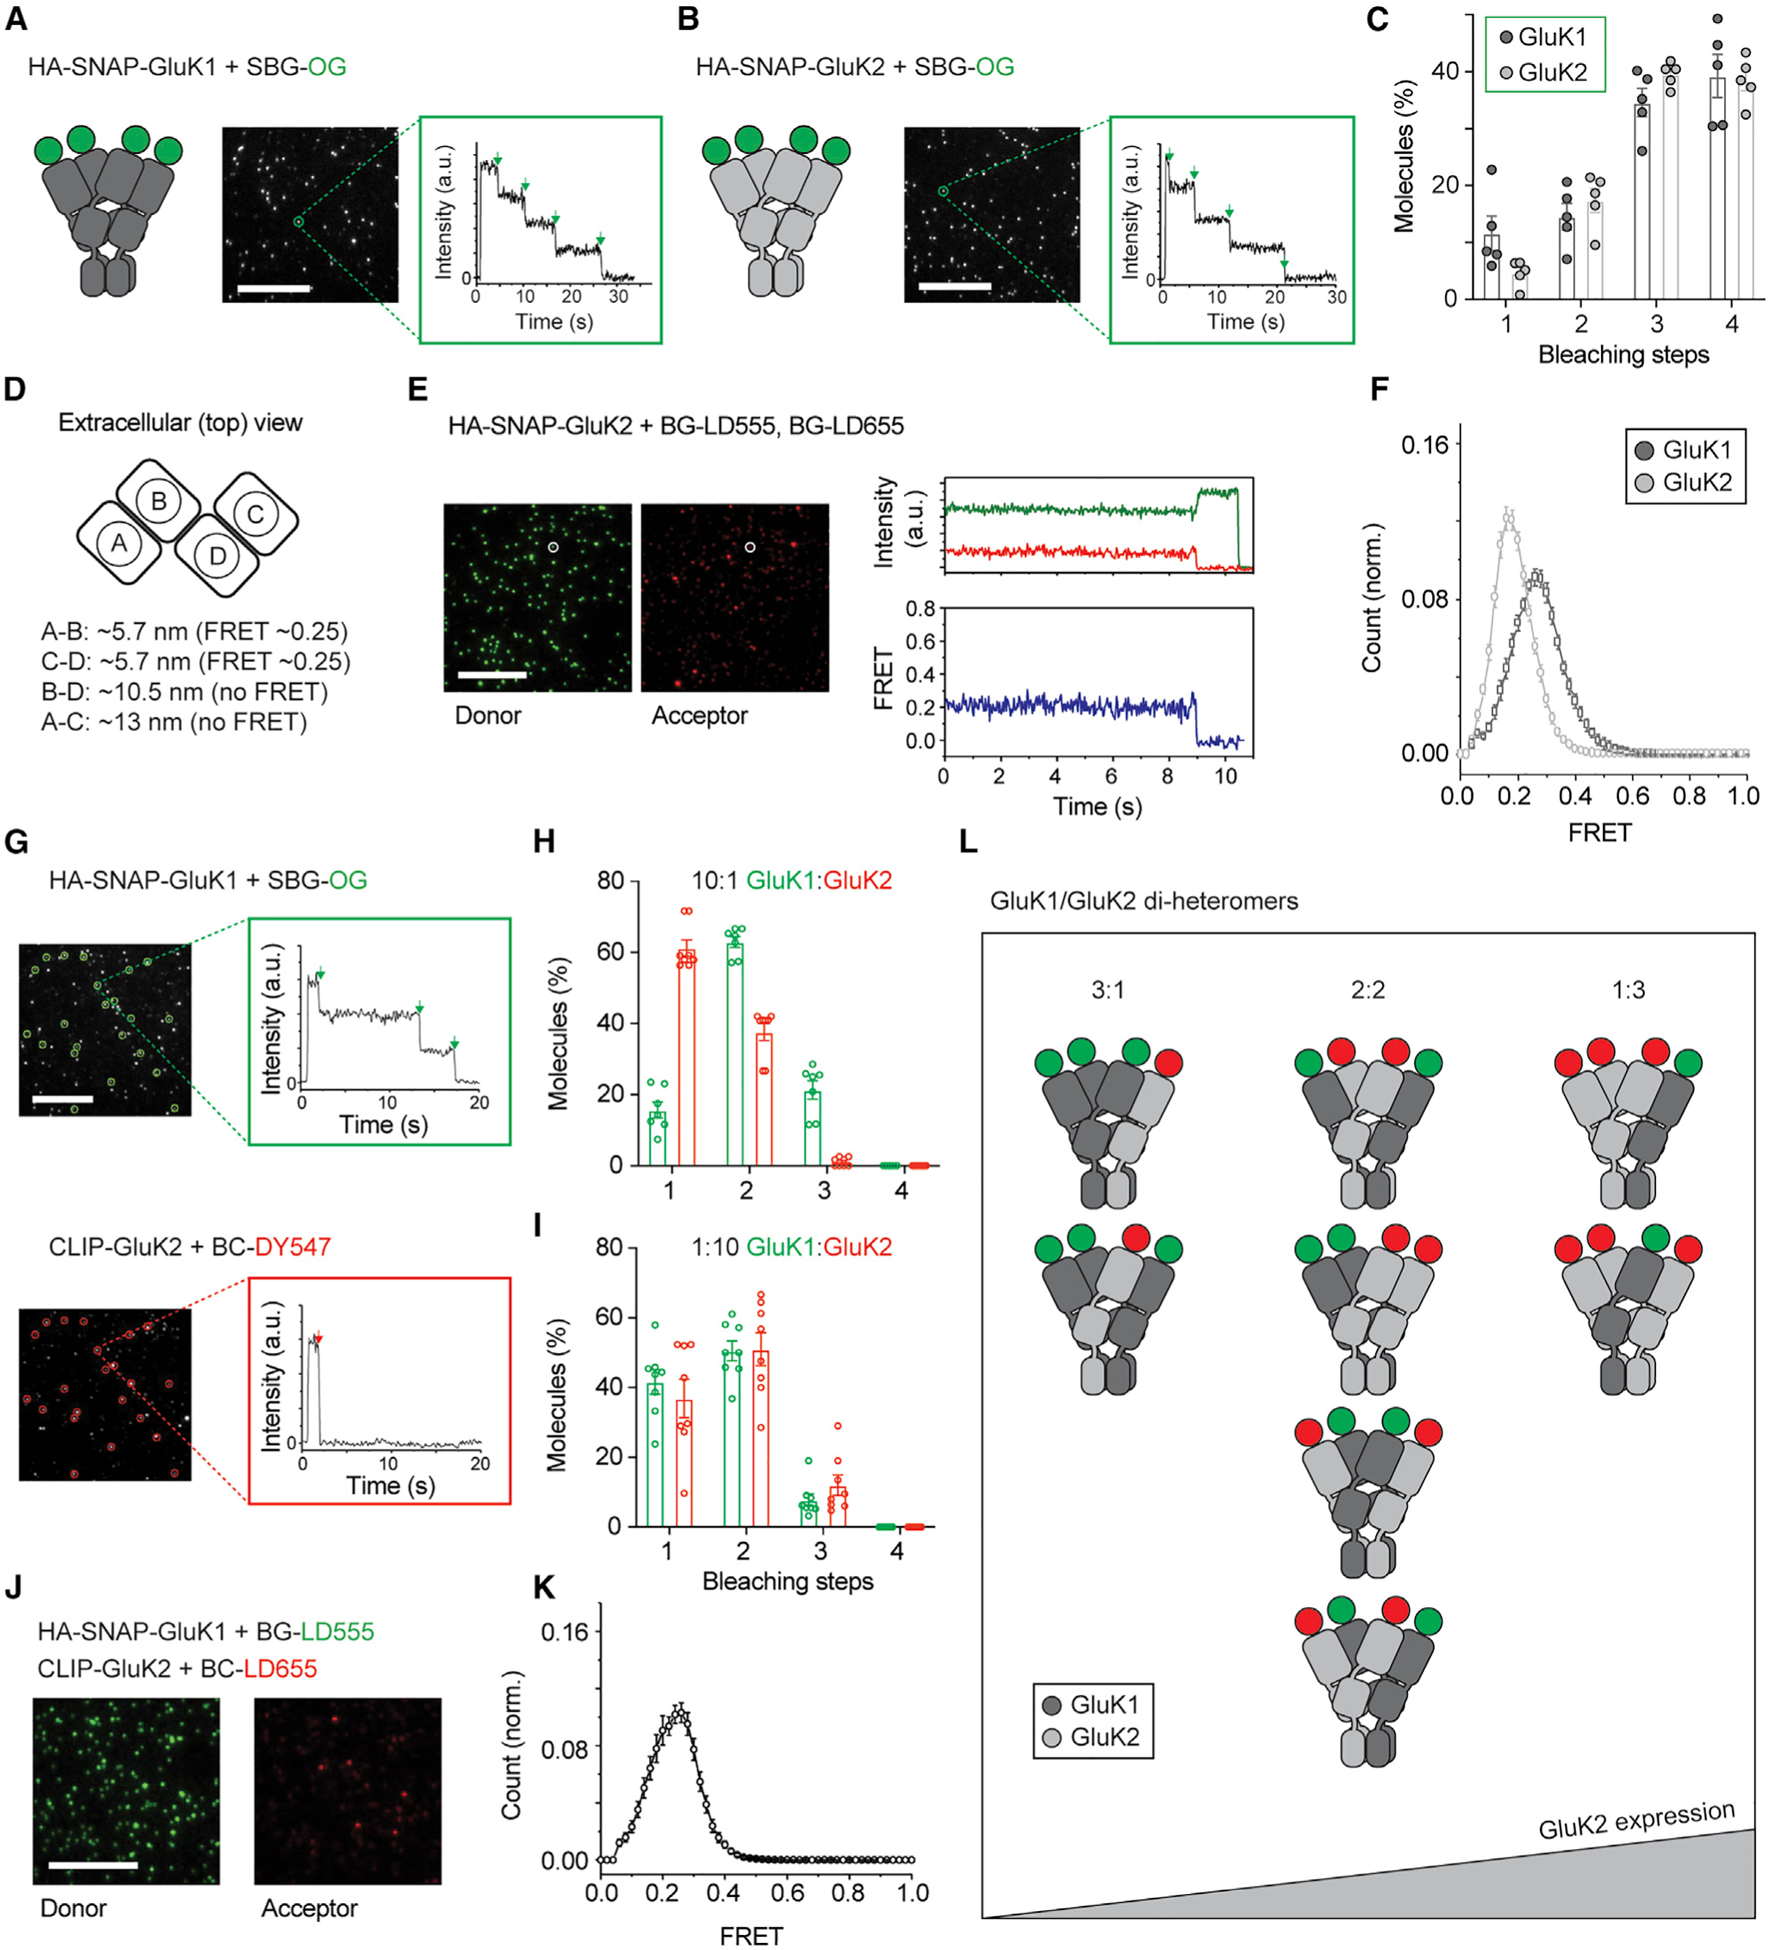
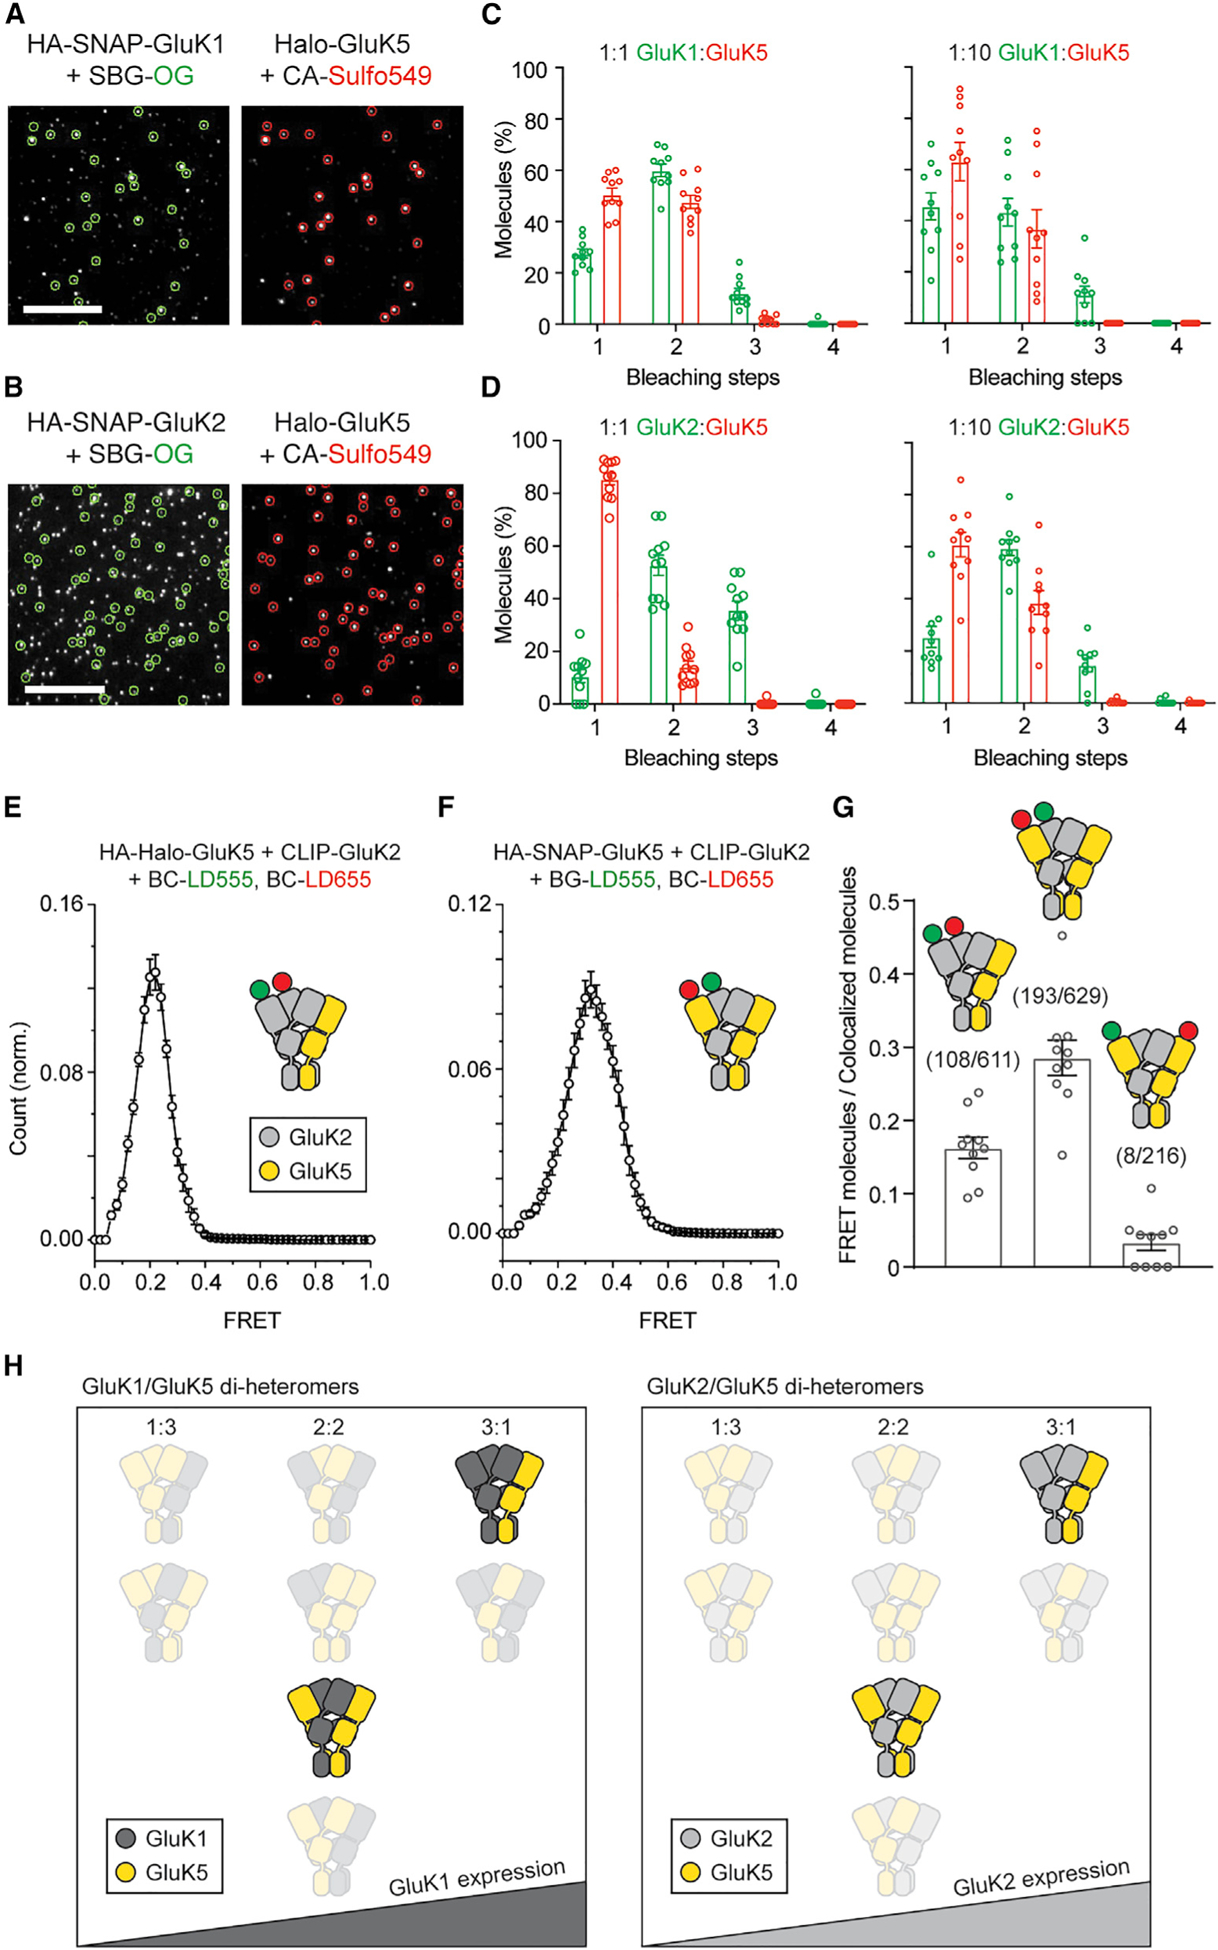
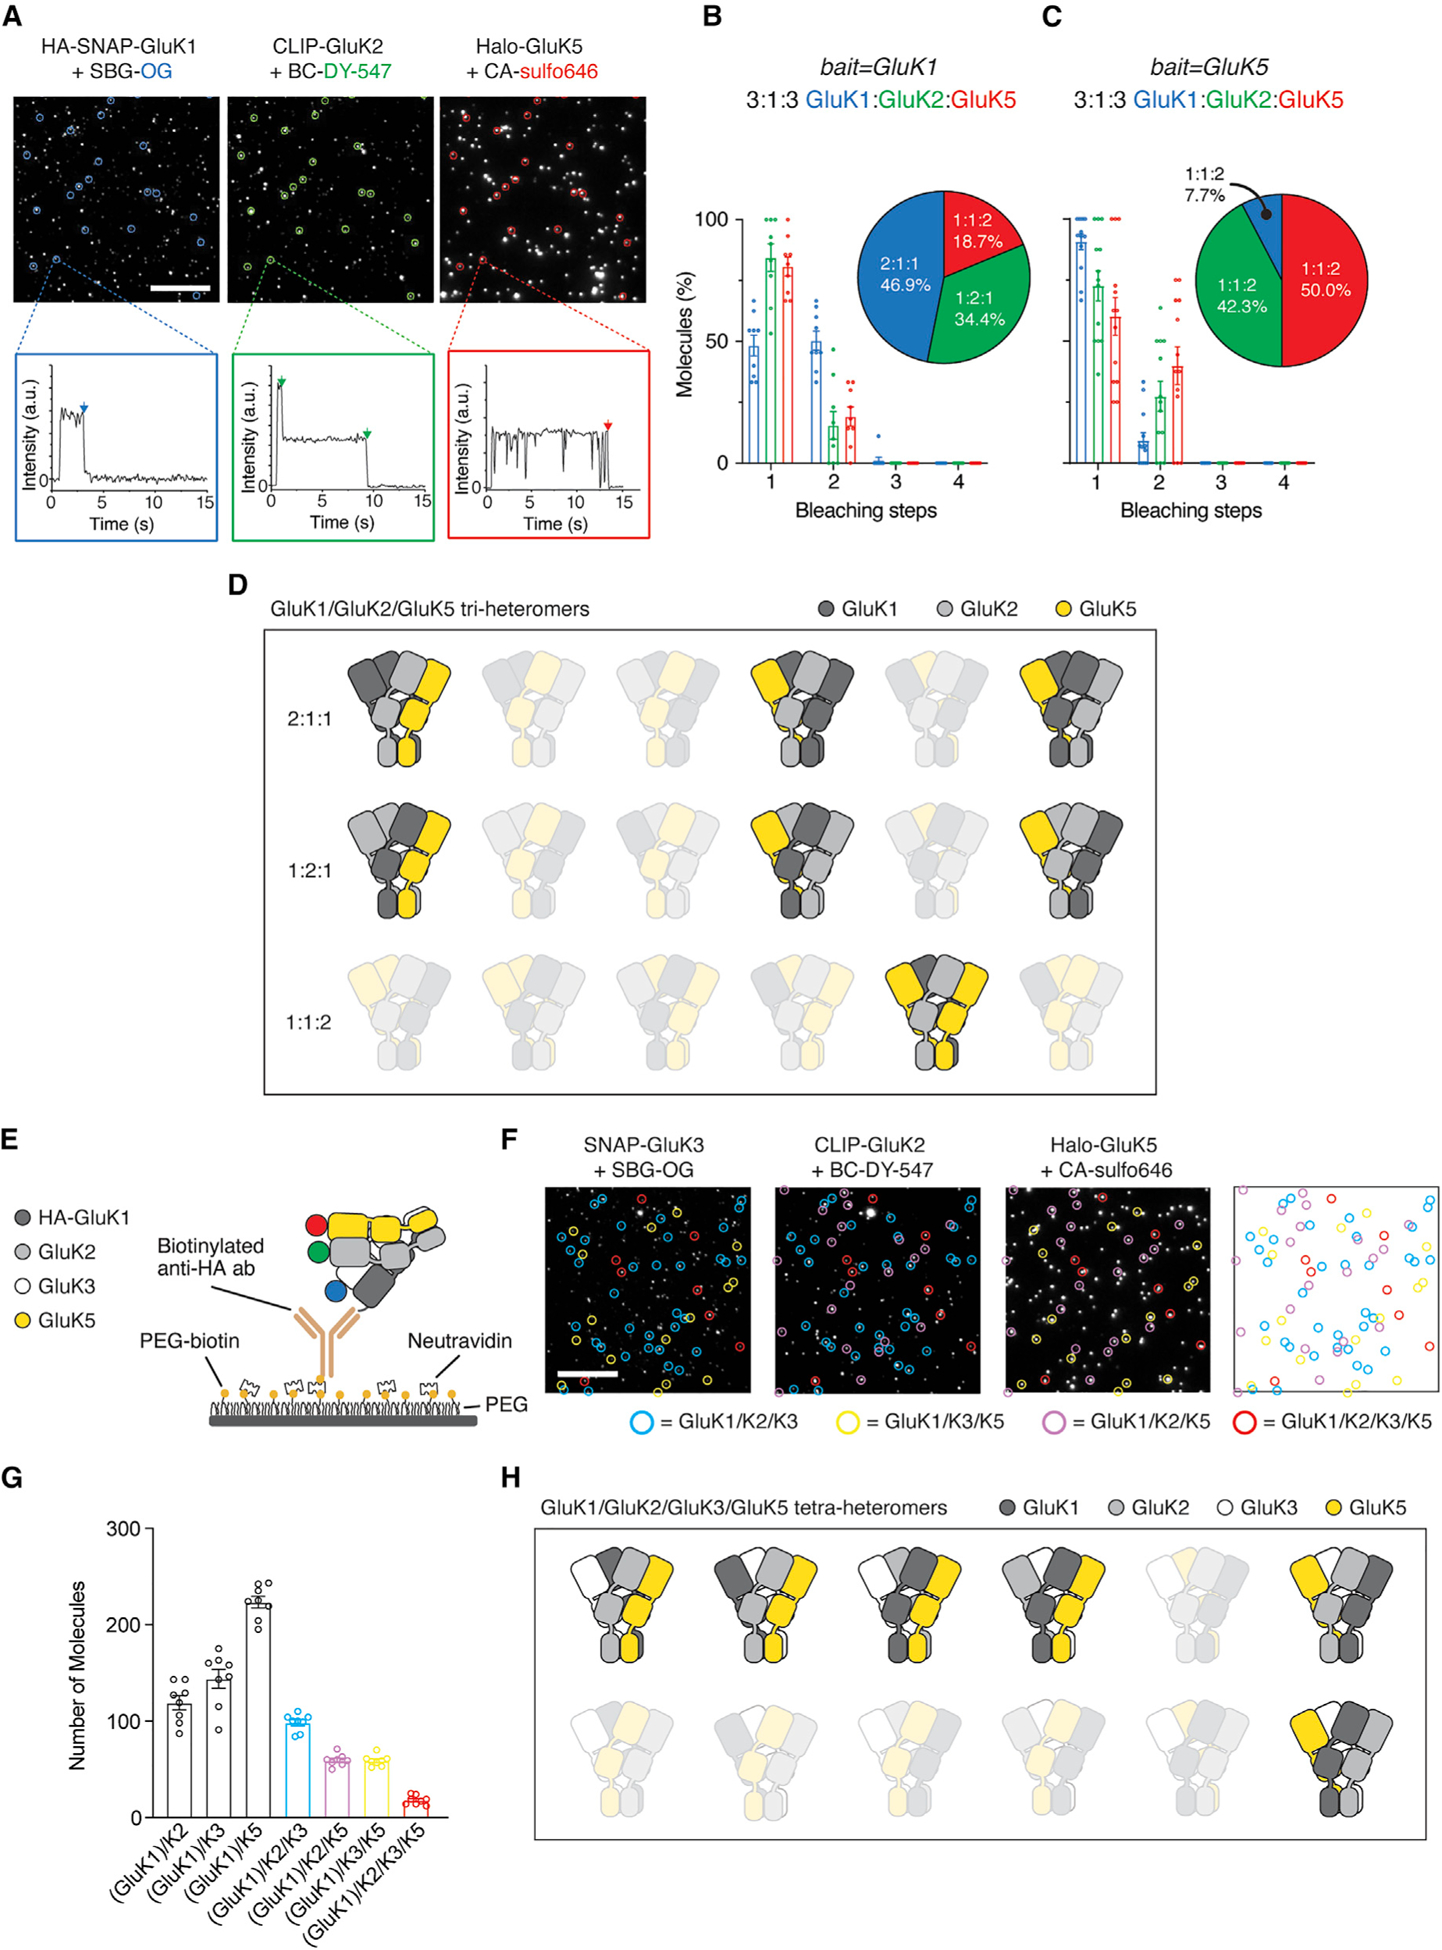
The kainate receptors (KARs) are members of the ionotropic glutamate receptor family and assemble into tetramers from a pool of five subunit types (GluK1-5). Each subunit confers distinct functional properties to a receptor, but the compositional and stoichiometric diversity of KAR tetramers is not well understood. To address this, we first solve the structure of the GluK1 homomer, which enables a systematic assessment of structural compatibility among KAR subunits. Next, we analyze single-cell RNA sequencing data, which reveal extreme diversity in the combinations of two or more KAR subunits co-expressed within the same cell. We then investigate the composition of individual receptor complexes using single-molecule fluorescence techniques and find that di-heteromers assembled from GluK1, GluK2, or GluK3 can form with all possible stoichiometries, while GluK1/K5, GluK2/K5, and GluK3/K5 can form 3:1 or 2:2 complexes. Finally, using three-color single-molecule imaging, we discover that KARs can form tri- and tetra-heteromers.

Keywords: cryo-electron microscopy; iGluRs; kainate receptors; single-cell RNA sequencing; single-molecule Förster resonance energy transfer; single-molecule pull-down.


Conflict of interest statement

Declaration of interests The authors declare no competing interests.

Figures

Figure 1.
Figure 1.. Structural similarity between kainate receptors
(A) Surface view of agonist-bound GluK1, GluK2, GluK3, and GluK2/K5 structures. (B) Comparison of KAR ATD monomers. Monomers from GluK2, GluK3, and GluK5 were aligned to GluK1 ATD monomer using R1 domains. ATDs colored according to RMSD relative to GluK1. Color maps range from 0 to 8Å RMSD. (C) Comparison of KAR ATD dimer conformations. ATD dimers from GluK1, GluK2, and GluK3 were aligned to the GluK1 ATD dimer. Alignment made between one subunit within each ATD dimer. Subunits used for alignment colored gray and cyan/magenta for RMSD calculations. GluK2/K5 ATD dimer was aligned to the GluK1 dimer using the GluK2 subunit (gray), and GluK5 was used for RMSD calculation (cyan/magenta). The RMSD values convey conformational differences within the ATD dimer, between GluK1 and the other KARs shown. The color map ranges from 0 to 10Å RMSD. (D) Angle formed by KAR ATD dimers at the dimer-dimer interface. GluK1 is used in the panel, but each angle measurement was done on its corresponding KAR structure. (E) Sequence alignment for the five KAR subunits highlighting residues involved in forming the ATD dimer-dimer interface analyzed in (D). Green indicates sequence conservation, and yellow indicates charge conservation. (F–I) LBD layers for agonist-bound GluK1 (F), GluK2 (G), GluK3 (H), and GluK2/K5 (I) with helices B (red) and G (yellow) highlighted. PDB codes used in this figure are PDB: 5KUF (GluK2-SYM), 6JFY (GluK3-SYM), and 7KS3 (GluK2/K5-L-Glu). See also Figures S1 and S2.
Figure 2.
Figure 2.. scRNA-seq analysis of KAR subunit expression in mouse frontal cortex
(A) Violin plots showing relative expression of each Grik subunit type across glutamatergic neuron, GABAergic neuron, and non-neuronal subclasses. Different widths in each plot represent probability density (relative number of cells expressing at that range). Black dots represent the median value for each subclass. Scales represent maximum copies per million (CPMs) for each gene. (B) Survival plots with the number of Grik subunit types expressed per cell for different thresholds. (C) Paired co-expression analysis (cutoff minimum of 5 CPM) shown as heatmaps. Color range is the proportion of cells co-expressing the indicated pairs of Grik subunits. (D) Co-expression analysis (cutoff minimum of 5 CPM) shown as heatmaps. Color range represents proportion of cells within that subclass expressing each Grik combination. (E) 3D plots showing expression levels of Grik1, Grik2, and Grik5 in L2/3 (left), Sst (middle), and Pvalb (right) neurons. Each point represents an individual cell and axis values are CPMs. See also Figure S3.
Figure 3.
Figure 3.. GluK1/K2 di-heteromers can form all possible stoichiometries in an expression-dependent manner
(A and B) Representative SiMPull images and bleaching step (green arrows) traces for HA-SNAP-GluK1 (A) and HA-SNAP-GluK2 (B) labeled with SBG-OG. (C) Proportion of molecules with 1 to 4 bleaching steps (n = 403 and 615 molecules from 5 movies for GluK1 and GluK2, respectively). (D) Schematic of ATD layer. Distance measurements indicate that only ATD dimers (A-B or C-D pairs) can generate FRET signals from N-terminal fluorescent tags (Förster radius, ~6 nm). (E) Representative images (left) and traces (right) showing smFRET analysis of HA-SNAP-GluK2 homo-tetramers. Acceptor (red) bleaching followed by donor (green) recovery confirms FRET. Single bleaching steps in each channel confirm measurements restricted to molecules with one donor and one acceptor molecule. (F) Histograms showing smFRET values for HA-SNAP-GluK1 (n = 265 molecules; 9 movies) and HA-SNAP-GluK2 (n = 1123 molecules; 16 movies). (G) Representative two-color SiMPull images with co-localized spots indicating GluK1/K2 di-heteromers (circled). Traces show bleaching steps in both colors for the same molecule. (H and I) Photobleaching step distributions for HA-SNAP-GluK1 and FLAG-CLIP-GluK2 at 10:1 (H) and 1:10 (I) expression ratios (n = 416 and 406 molecules from 7 movies in H, and 185 and 220 molecules from 8 movies in I, for GluK1 and GluK2, respectively). (J and K) Representative image (J) and histogram (K; n = 235 molecules; 15 movies) showing smFRET between HA-SNAP-GluK1 and FLAG-CLIP-GluK2, indicating ATD heterodimers formed. (L) GluK1/K2 complexes suggested by the experiments. Data are represented as mean ± SEM. Each point in the bar graphs represents an individual movie combined from two separate days. Scale bars are 10 μm. See also Figure S4.
Figure 4.
Figure 4.. GluK1/K5 and GluK2/K5 di-heteromers can incorporate one or two GluK5 subunits
(A and B) Representative images from two-color SiMPull with co-localized spots for GluK1/K5 (A) and GluK2/K5 (B) heteromers. (C and D) Distribution of bleaching steps for co-localized spots at two DNA transfection ratios, indicating that up to three GluK1 (C) or GluK2 (D) subunits and up to two GluK5 subunits can exist within a heteromer. For (C), n = 305 and 494 molecules from 10 movies at 1:1 ratio, and 124 and 203 molecules from 10 movies at 1:10 ratio, for GluK1 and GluK5, respectively. For (D), n = 134 and 252 molecules from 10 movies at 1:1 ratio, and 448 and 991 molecules from 10 movies at 1:10 ratio, for GluK2 and GluK5, respectively (E and F) smFRET histograms showing efficient energy transfer within GluK2 ATD homodimers (E; n = 257 molecules; 10 movies) and GluK2/K5 ATD heterodimers (F; n = 331 molecules; 11 movies). (G) Proportion of co-localized spots (i.e., heteromers) showing FRET. FRET signal indicates ATD dimerization between labeled subunits and shows GluK2 ATD homodimers and GluK2/K5 ATD heterodimers form, but GluK5 ATD homodimers do not readily form. DNA transfection ratios are 1:10 (HA-Halo-GluK5:CLIP-GluK2) and 5:1 (HA-SNAP-GluK5:CLIP-GluK2). (H) Possible GluK1/K5 and GluK2/K5 di-heteromers. Data are represented as mean ± SEM. Each point in the bar graphs represents an individual movie combined from two separate days. Scale bars are 10 μm. See also Figure S5.
Figure 5.
Figure 5.. Visualization of tri-heteromeric and tetra-heteromeric KARs
(A) Representative images and photobleaching traces for three-color SiMPull experiments with HA-SNAP-GluK1 as bait. (B and C) Photobleaching step distributions for each KAR subunit in triple-colocalized spots when HA-SNAP-GluK1 (B) or HA-Halo-GluK5 (C) used as bait. Pie charts show the distribution of stoichiometries when analysis restricted to triple-colocalized spots which show four bleaching steps. For (B), n = 89, 123, and 117 molecules from 9 movies for GluK1,GluK2, and GluK5, respectively. For (C), n = 107, 130, and 98 molecules from 13 movies for GluK1,GluK2, and GluK5, respectively. (D) Possible GluK1/K2/K5 tri-heteromers. (E) Schematic of SiMPull using three fluorescently tagged subunits (SNAP-GluK3, FLAG-CLIP-GluK2, Halo-GluK5) and pull-down via HA-GluK1. (F) Representative image with three colors. Double- and triple-co-localized spots circled in different colors. Panel on right shows superposition of the locations of all co-localized molecules. (G) Relative proportion of spots containing combinations of at least 2, 3, or 4 KAR subunits. Double-co-localized spots either represent tri-heteromers or tetra-heteromers. Triple-co-localized spots (red bar) represent tetra-heteromers. All spots inferred to have a GluK1 subunit because it is the bait for pull-down. (H) Possible GluK1/K2/K3/K5 tetra-heteromers. Data are represented as mean ± SEM. Each point in the bar graphs represents an individual movie combined from two separate days. Scale bars are 10 μm. See also Figure S6.

Similar articles

Cited by

References

    1. Acosta-Ruiz A, Gutzeit VA, Skelly MJ, Meadows S, Lee J, Parekh P, Orr AG, Liston C, Pleil KE, Broichhagen J, and Levitz J (2020). Branched Photoswitchable Tethered Ligands Enable Ultra-efficient Optical Control and Detection of G Protein-Coupled Receptors In Vivo. Neuron 105, 446–463.e13. - PMC - PubMed
    1. Ayalon G, and Stern-Bach Y (2001). Functional assembly of AMPA and kainate receptors is mediated by several discrete protein-protein interactions. Neuron 31, 103–113. - PubMed
    1. Bahn S, Volk B, and Wisden W (1994). Kainate receptor gene expression in the developing rat brain. J. Neurosci 14, 5525–5547. - PMC - PubMed
    1. Birke R, Ast J, Roosen DA, Mathes B, Roßmann K, Huhn C, Jones B, Lehmann M, Haucke V, Hodson DJ, et al. (2021). Sulfonated rhodamines as impermeable labelling substrates for cell surface protein visualization. bioRxiv. 10.1101/2021.03.16.435698. - DOI
    1. Contractor A, Mulle C, and Swanson GT (2011). Kainate receptors coming of age: milestones of two decades of research. Trends Neurosci. 34, 154–163. - PMC - PubMed

Publication types