. 2021 Dec 6;56(23):3250-3263.e5.
doi: 10.1016/j.devcel.2021.10.006. Epub 2021 Oct 11.

ORF3a of SARS-CoV-2 promotes lysosomal exocytosis-mediated viral egress

Affiliations

ORF3a of SARS-CoV-2 promotes lysosomal exocytosis-mediated viral egress

Di Chen et al. Dev Cell. .

Abstract

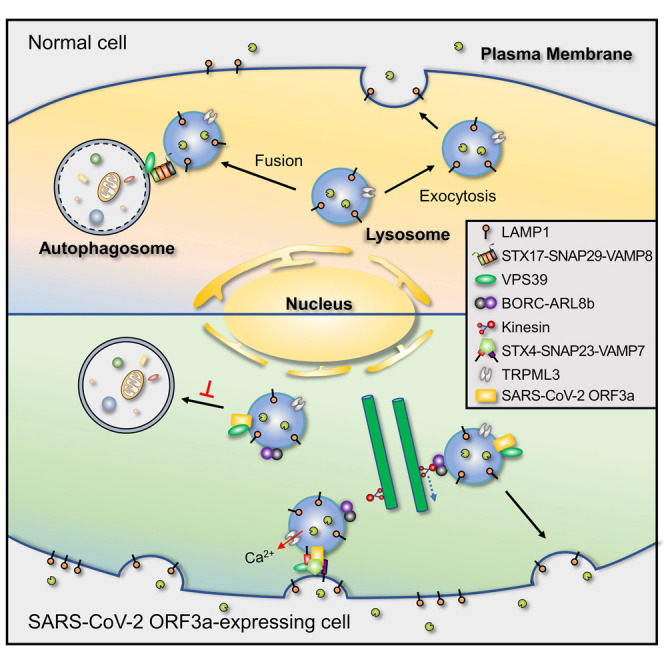
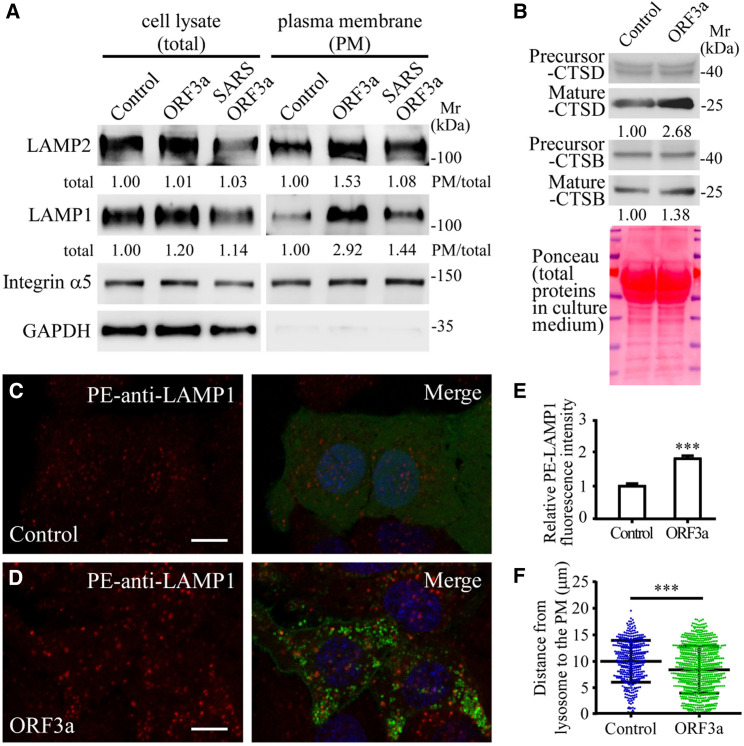
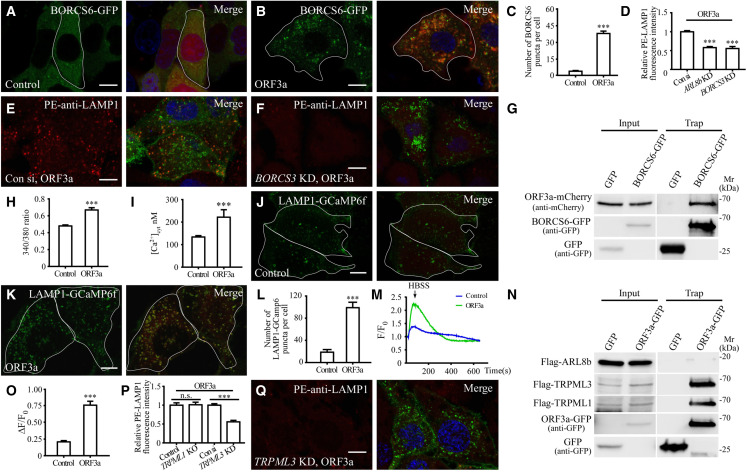
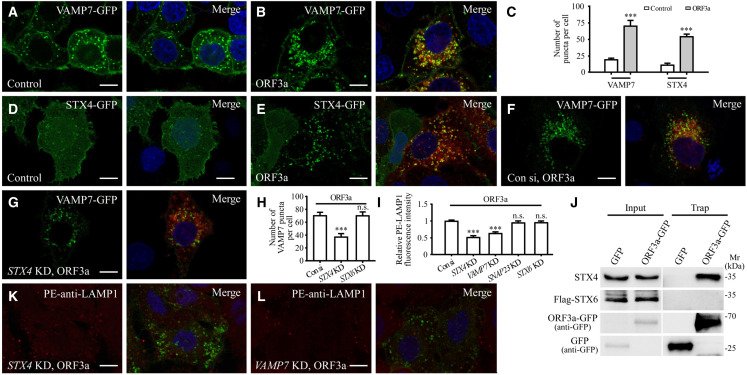
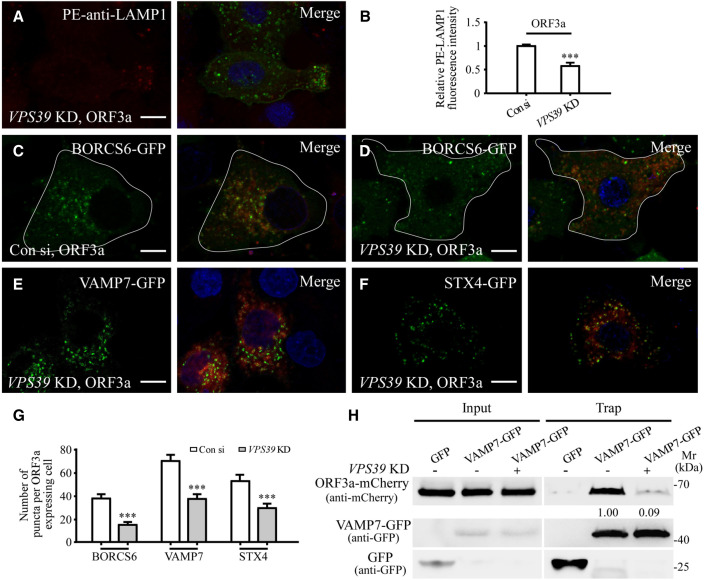
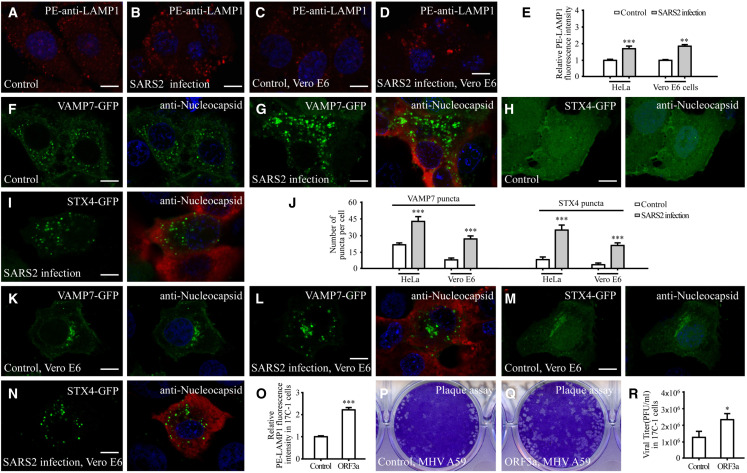
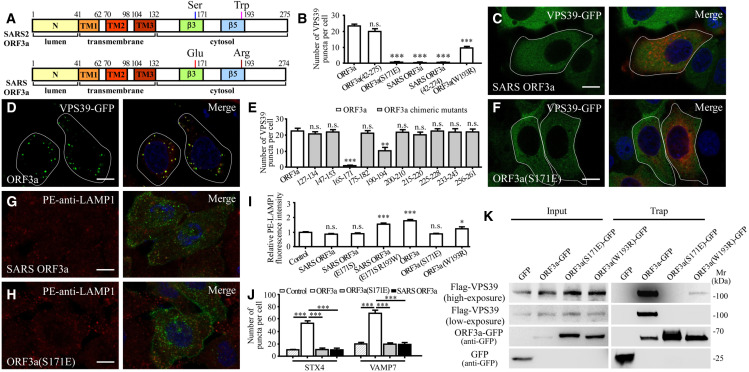
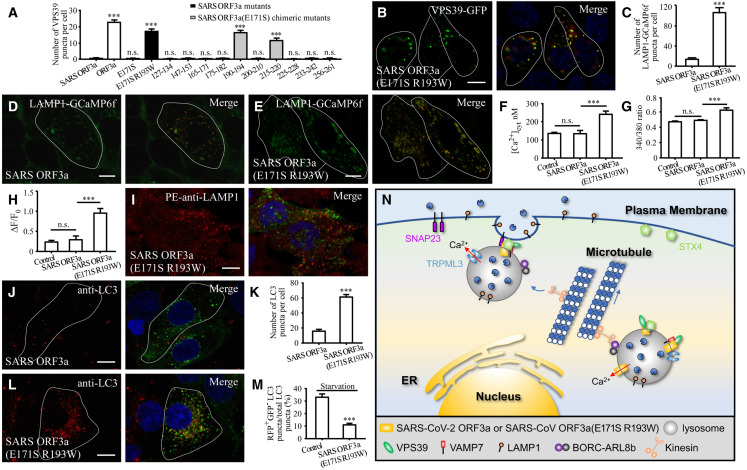
Viral entry and egress are important determinants of virus infectivity and pathogenicity. β-coronaviruses, including the COVID-19 virus SARS-CoV-2 and mouse hepatitis virus (MHV), exploit the lysosomal exocytosis pathway for egress. Here, we show that SARS-CoV-2 ORF3a, but not SARS-CoV ORF3a, promotes lysosomal exocytosis. SARS-CoV-2 ORF3a facilitates lysosomal targeting of the BORC-ARL8b complex, which mediates trafficking of lysosomes to the vicinity of the plasma membrane, and exocytosis-related SNARE proteins. The Ca2+ channel TRPML3 is required for SARS-CoV-2 ORF3a-mediated lysosomal exocytosis. Expression of SARS-CoV-2 ORF3a greatly elevates extracellular viral release in cells infected with the coronavirus MHV-A59, which itself lacks ORF3a. In SARS-CoV-2 ORF3a, Ser171 and Trp193 are critical for promoting lysosomal exocytosis and blocking autophagy. When these residues are introduced into SARS-CoV ORF3a, it acquires the ability to promote lysosomal exocytosis and inhibit autophagy. Our results reveal a mechanism by which SARS-CoV-2 interacts with host factors to promote its extracellular egress.

Keywords: COVID-19; ORF3a; SARS-CoV; SARS-CoV-2; lysosomal exocytosis.


Conflict of interest statement

Declaration of interests The authors declare no competing interests.

Figures

None
Graphical abstract
Figure 1
Figure 1
ORF3a of SARS-CoV-2 promotes lysosomal exocytosis (A) Immunoblotting analysis of subcellular fractions from HeLa cells expressing FLAG (Control), SARS-CoV-2 ORF3a-FLAG (ORF3a), and SARS-CoV ORF3a-FLAG (SARS ORF3a). Quantification of LAMP1 and LAMP2 levels is shown. Levels of LAMP1 and LAMP2 were normalized by GAPDH level in cell lysates and by integrin α5 level in the PM fraction. The level in control cells is set to 1.0. HeLa cells were used throughout this study unless otherwise noted. (B) Immunoblotting analysis of secreted lysosomal cathepsins in the culture medium of cells expressing FLAG (Control) and ORF3a-FLAG (ORF3a). Quantification of mature cathepsin B (CTSB) and cathepsin D (CTSD) (normalized by total protein levels in the medium) is shown. The level in control cells is set to 1.0. (C–E) Compared with control cells expressing GFP (C), the level of cell membrane-localized LAMP1, detected by phycoerythrin (PE)-conjugated LAMP1 antibody in live cells, is higher in ORF3a-GFP-expressing cells (D). (E) shows quantification of the fluorescence intensity of cell membrane-localized LAMP1 per cell in GFP-expressing cells (n = 33) and ORF3a-GFP-expressing cells (n = 29). The level in control cells is set to 1.0. Data are shown as mean ± SEM ∗∗∗p < 0.001. (F) Column scatter charts showing the distances from LAMP1 puncta to the cell membrane. Data are shown as mean ± SEM (n = 411 puncta from 8 cells in control cells, n = 793 puncta from 8 cells in ORF3a-expressing cells). ∗∗∗p < 0.001. Scale bars, (C and D) 10 μm. See also Figure S1.
Figure 2
Figure 2
The BORC-ARL8b complex and TRPML3 are required for lysosomal exocytosis in ORF3a-expressing cells (A–C) Compared with control cells expressing mCherry (A), the number of BORCS6-GFP puncta is dramatically increased in ORF3a-mCherry-expressing cells (B). (C) Shows quantification of the number of BORCS6-GFP puncta per cell. Data are shown as mean ± SEM (n = 31 for each bar). ∗∗∗p < 0.001. (D–F) Compared with control cells transfected with control siRNA (E), the level of cell membrane-localized LAMP1 is dramatically decreased in ORF3a-expressing cells transfected with BORCS3 siRNA (F). (D) Shows quantification of the fluorescence intensity of cell membrane-localized LAMP1 per cell. The level in control siRNA-treated cells is set to 1.0. Data are shown as mean ± SEM (n = 23 for control cells, n = 27 for ARL8b KD cells, and n = 22 for BORCS3 KD cells). ∗∗∗p < 0.001. (G) In GFP-Trap assays, ORF3a-mCherry is co-immunoprecipitated by BORCS6-GFP. Cell lysates were immunoprecipitated using GFP-Trap and analyzed by immunoblotting with mCherry and GFP antibodies. (H) The 340/380 nm fluorescence excitation ratio of HeLa cells expressing GFP (control, n = 55) and ORF3a-GFP (ORF3a, n = 49) after loading with fura-2. Data are shown as mean ± SEM ∗∗∗p < 0.001. (I) The cytosolic free calcium concentration in HeLa cells expressing mCherry (control, n = 45) and ORF3a-mCherry (ORF3a, n = 9). Data are shown as mean ± SEM ∗∗∗p < 0.001. (J–L) Compared with control cells expressing mCherry (J), the number of LAMP1-GCaMP6f puncta is dramatically increased in ORF3a-mCherry-expressing cells (K). (L) shows quantification of the number of LAMP1-GCaMP6f puncta per cell. Data are shown as mean ± SEM (n = 15 for control cells, n = 21 for ORF3a-expressing cells). ∗∗∗p < 0.001. (M) The ratio of F/F0 in control cells expressing mCherry (control) and ORF3a-mCherry (ORF3a) after inducing lysosomal Ca2+ release by HBSS. (N) In GFP-Trap assays, FLAG-TRPML1 and FLAG-TRPML3 but not FLAG-ARL8b are co-precipitated by ORF3a-GFP. Cell lysates were immunoprecipitated using GFP-Trap and analyzed by immunoblotting with FLAG and GFP antibodies. (O) Shows quantification of ΔF/F0, related to Figure 2M. Data are shown as mean ± SEM (n = 21 for control, n = 25 for ORF3a). ∗∗∗p < 0.001. (P and Q) Compared with ORF3a-expressing cells transfected with control siRNA (Figure 2E), the level of cell membrane-localized LAMP1 is dramatically decreased in ORF3a-expressing cells transfected with TRPML3 siRNA (Q). (P) Shows quantification of the fluorescence intensity of cell membrane-localized LAMP1 per cell. The level in control siRNA-treated cells is set to 1.0. Data are shown as mean ± SEM (n = 23, 17, 20, and 21 for bars from left to right). ∗∗∗p < 0.001; n.s., no significant difference. The data for ORF3a-expressing cells transfected with control siRNA are the same as those in Figure 2D. Scale bars: (A, B, E, F, J, K, and Q) 10 μm. See also Figures S1 and S2.
Figure 3
Figure 3
Enhancement of lysosomal exocytosis by ORF3a expression requires VAMP7 and STX4 (A and B) Compared with control cells expressing FLAG (A), the number of VAMP7-GFP puncta is dramatically increased in ORF3a-FLAG-expressing cells (B). (C) Quantification of the number of VAMP7-GFP and STX4-GFP puncta per cell. Data are shown as mean ± SEM (n = 26, 31, 28, and 30 for bars from left to right). ∗∗∗p < 0.001. (D and E) Compared with control cells expressing FLAG (D), the number of STX4-GFP puncta is dramatically increased in ORF3a-FLAG-expressing cells (E). (F–H) Compared with control cells expressing ORF3a and transfected with control siRNA (F), the number of VAMP7-GFP puncta is dramatically decreased in ORF3a-expressing cells transfected with STX4 siRNA (G). (H) Shows quantification of the number of VAMP7-GFP puncta per cell. Data are shown as mean ± SEM (n = 23 for control cells, n = 30 for STX4 KD cells, and n = 20 for STX6 KD cells). ∗∗∗p < 0.001; n.s., no significant difference. (I) Quantification of the fluorescence intensity of cell membrane-localized LAMP1 per cell. The level in control siRNA-treated cells is set to 1.0. Data are shown as mean ± SEM (n = 23, 23, 22, 14, and 15 for bars from left to right). ∗∗∗p < 0.001; n.s., no significant difference. The data for ORF3a-expressing cells transfected with control siRNA are the same as those in Figure 2D. (J) Endogenous STX4 but not STX6 is co-precipitated by ORF3a-GFP in GFP-Trap assays. Cell lysates were immunoprecipitated using GFP-Trap and analyzed by immunoblotting with STX4, FLAG and GFP antibodies. (K and L) Compared with control cells expressing ORF3a and transfected with control siRNA (Figure 2E), levels of cell membrane-localized LAMP1 are dramatically decreased in ORF3a-expressing cells transfected with STX4 siRNA and VAMP7 siRNA (K and L). Scale bars: (A, B, D–G, K, and L) 10 μm. See also Figures S3 and S4.
Figure 4
Figure 4
VPS39 contributes to the enhanced lysosomal exocytosis in ORF3a-expressing cells (A and B) Compared with control cells expressing ORF3a and transfected with control siRNA (Figure 2E), the level of cell membrane-localized LAMP1 is dramatically decreased in ORF3a-expressing cells transfected with VPS39 siRNA (A). (B) shows quantification of the fluorescence intensity of cell membrane-localized LAMP1 per cell. The level in control siRNA-treated cells is set to 1.0. Data are shown as mean ± SEM n = 23 for VPS39 KD cells. ∗∗∗p < 0.001. The data for ORF3a-expressing cells transfected with control siRNA are the same as those in Figure 2D. (C–G) Compared with control cells expressing ORF3a and transfected with control siRNA (C, Figures 3F and S3K, respectively), the number of BORCS6-GFP, VAMP7-GFP, and STX4-GFP puncta is dramatically decreased in ORF3a-expressing cells transfected with VPS39 siRNA (D–F). (G) shows quantification of the number of BORCS6-GFP, VAMP7-GFP, and STX4-GFP puncta per cell. The data for VAMP7-GFP and STX4-GFP in control cells are the same as those in Figures 3H and S3J. Data are shown as mean ± SEM (n = 19, 31, 23, 30, 27, and 31 for bars from left to right). ∗∗∗p < 0.001. (H) The level of ORF3a-mCherry co-precipitated by VAMP7-GFP is decreased after VPS39 KD. Cell lysates were immunoprecipitated using GFP-Trap and analyzed by immunoblotting with mCherry and GFP antibodies. Levels of ORF3a-mCherry in control siRNA- and VPS39 siRNA-treated cells were normalized by VAMP7-GFP level. The level in control siRNA-treated cells is set to 1.0. Scale bars: (A and C–F) 10 μm. See also Figure S4.
Figure 5
Figure 5
SARS-CoV-2 virus infection elevates lysosomal exocytosis (A–E) The level of cell-membrane-localized LAMP1 is dramatically increased in SARS-CoV-2 (SARS2)-infected ACE2-expressing HeLa cells (A and B) and Vero E6 cells (C and D). (E) shows quantification of the fluorescence intensity of cell membrane-localized LAMP1 per cell. Levels in control cells are set to 1.0. Data are shown as mean ± SEM (n = 26, 24, 21, and 22 for bars from left to right). ∗∗p <0.01; ∗∗∗p <0.001. (F–I) Compared with control cells expressing ACE2 (F and H), the number of VAMP7-GFP puncta and STX4-GFP puncta is dramatically increased in SARS-CoV-2-infected ACE2-expressing HeLa cells (G and I). (J) Quantification of the number of VAMP7-GFP puncta and STX4-GFP puncta per cell. Data are shown as mean ± SEM (n = 24, 27, 29, 26, 23, 28, 24, and 26 for bars from left to right). ∗∗∗p < 0.001. (K–N) Compared with control cells (K and M), the number of VAMP7-GFP puncta and STX4-GFP puncta is dramatically increased in SARS2-infected Vero E6 cells (L and N). (O) Quantification of the fluorescence intensity of cell-membrane-localized LAMP1 per cell in 17Cl-1 cells expressing GFP and ORF3a-GFP. The level in control cells is set to 1.0. Data are shown as mean ± SEM (n = 21 for each bar). ∗∗∗p < 0.001. (P–R) Plaque assay showing that the vital titer of the supernatant from MHV-A59-infected ORF3a-GFP-expressing cells is higher than that from MHV-A59-infected GFP-expressing cells (control) (P and Q). (R) shows quantification of vital titer at 16 h post-infection. Data are shown as mean ± SEM (n = 3 for each bar). p < 0.05. Scale bars: (A–D, F–I, and K–N) 10 μm. See also Figure S5.
Figure 6
Figure 6
Ser171 and Trp193 are essential for ORF3a to promote lysosomal exocytosis and to block autophagy (A) Schematic illustration of the domains in ORF3a of SARS-CoV-2 (SARS2) and SARS-CoV (SARS). (B) Quantification of the number of VPS39-GFP puncta in cells expressing ORF3a-mCherry, ORF3a(42aa–275aa)-mCherry, ORF3a(S171E)-mCherry, SARS ORF3a-mCherry, SARS ORF3a(42aa–274aa)-mCherry, and ORF3a(W193R)-mCherry. Data are shown as mean ± SEM (n = 31, 22, 32, 32, 32, and 25 for bars from left to right). ∗∗∗p < 0.001; n.s., no significant difference. (C and D) Expression of SARS-CoV-2 ORF3a (D) but not SARS-CoV ORF3a (C) induces the formation of a large number of VPS39 puncta. (E) Quantification of the number of VPS39-GFP puncta in cells expressing ORF3a-FLAG and a series of ORF3a-FLAG mutants with the indicated regions replaced with the corresponding regions of SARS-CoV ORF3a. Data are shown as mean ± SEM (n = 29 for ORF3a(165–171) chimeric mutants, n = 20 for other bars). ∗∗∗p < 0.001; ∗∗p < 0.01; n.s., no significant difference. (F) The mutant ORF3a(S171E), in which Ser171 of SARS-CoV-2 ORF3a is replaced by Glu171 of SARS-CoV ORF3a, fails to induce formation of VPS39-GFP puncta. (G and H) Compared with control cells expressing GFP (Figure 1C), the level of cell-membrane-localized LAMP1 detected by the live cell staining assay is not increased in cells expressing SARS-CoV ORF3a-GFP (G) or SARS-CoV-2 ORF3a(S171E)-GFP (H). (I) Quantification of the fluorescence intensity of cell-membrane-localized LAMP1 per cell. The level in control cells is set to 1.0. Data are shown as mean ± SEM (n = 33, 23, 21, 28, 29, 23, and 16 for bars from left to right). p < 0.05, ∗∗∗p < 0.001; n.s., no significant difference. The data for control and ORF3a-expressing cells are the same as those in Figure 1E. (J) Quantification of the number of STX4-GFP and VAMP7-GFP puncta in cells expressing mCherry (control), ORF3a-mCherry, ORF3a(S171E)-mCherry, and SARS-CoV ORF3a-mCherry. Data are shown as mean ± SEM (n = 16, 30, 24, 19, 14, 31, 22, and 19 for bars from left to right). ∗∗∗p < 0.001. The data for ORF3a-expressing cells are the same as those in Figure 3C. (K) In GFP-Trap assays, FLAG-VPS39 is co-precipitated by ORF3a-GFP and very weakly by ORF3a(W193R)-GFP, but not by ORF3a(S171E)-GFP. Cell lysates were immunoprecipitated using GFP-Trap and analyzed by immunoblotting with FLAG and GFP antibodies. Scale bars: (C, D, F, G, and H) 10 μm. See also Figures S5 and S6.
Figure 7
Figure 7
Mutating E171S and R193W endows SARS-CoV ORF3a with the ability to promote lysosomal exocytosis and block autophagy (A) Quantification of the number of VPS39-GFP puncta in cells expressing ORF3a-mCherry, SARS ORF3a-mCherry, SARS ORF3a(E171S)-mCherry, SARS ORF3a(E171S R193W)-mCherry, and a series of SARS ORF3a(E171S)-mCherry mutants in which the indicated region of SARS-CoV ORF3a is replaced with that of SARS-CoV-2 ORF3a. Data are shown as mean ± SEM (n = 22 for ORF3a-expressing cells, n = 32 for other bars). ∗∗∗p <0.001; n.s., no significant difference. (B) A large number of VPS39 puncta are formed in cells expressing SARS-CoV ORF3a(E171S R193W). (C–E) Compared with control cells expressing SARS ORF3a-mCherry, the number of LAMP1-GCaMP6f puncta is dramatically increased in SARS-CoV ORF3a(E171S R193W)-mCherry-expressing cells (D and E). (C) shows quantification of the number of LAMP1-GCaMP6f puncta per cell. Data are shown as mean ± SEM (n = 21 for SARS ORF3a-expressing cells, n = 19 for SARS-CoV ORF3a(E171S R193W)-expressing cells). ∗∗∗p < 0.001. (F) The cytosolic free calcium concentration in HeLa cells expressing mCherry (control), SARS ORF3a-mCherry, and SARS ORF3a(E171S R193W)-mCherry. The data for control cells are the same as those in Figure 2I. Data are shown as mean ± SEM (n = 45 for control, n = 14 for SARS ORF3a, n = 25 for SARS-CoV ORF3a(E171S R193W)). ∗∗∗p < 0.001; n.s., no significant difference. (G) The 340/380 nm fluorescence excitation ratio of HeLa cells expressing GFP (control), SARS ORF3a-GFP, and SARS ORF3a(E171S R193W)-GFP after loading with fura-2. The data for control cells are the same as those in Figure 2H. Data are shown as mean ± SEM (n = 55 for control, n = 68 for SARS ORF3a, and n = 38 for SARS-CoV ORF3a(E171S R193W)). ∗∗∗p < 0.001; n.s., no significant difference. (H) The ratio of ΔF/F0 in control cells expressing mCherry (control), SARS ORF3a-mCherry, and SARS ORF3a(E171S R193W)-mCherry after inducing lysosomal Ca2+ release by HBSS. (H) shows quantification of ΔF/F0. The data for control cells are the same as those in Figure 2O. Data are shown as mean ± SEM (n = 21 for control, n = 12 for SARS ORF3a, n = 16 for SARS-CoV ORF3a(E171S R193W)). ∗∗∗p < 0.001; n.s., no significant difference. (I) Compared with cells expressing SARS ORF3a (Figure 6G), the level of cell membrane-localized LAMP1 detected by the live cell staining assay is dramatically increased in cells expressing SARS ORF3a(E171S R193W)-GFP. (J–L) Compared with cells expressing SARS ORF3a-GFP (J), the number of LC3 puncta is dramatically increased in cells expressing SARS-CoV ORF3a(E171S R193W)-GFP (L). (K) shows quantification of the number of LC3 puncta per cell. Data are shown as mean ± SEM (n = 28 for SARS ORF3a-expressing cells; n = 25 for SARS ORF3a(E171S R193W)-expressing cells). ∗∗∗p < 0.001. (M) The percentage of total LC3 puncta that are RFP+GFP in cells expressing FLAG vector (control) and SARS ORF3a(E171S R193W)-FLAG after 3 h amino acid starvation. Data are shown as mean ± SEM (n = 28 for control cells, n = 22 for SARS ORF3a(E171S R193W)-expressing cells). ∗∗∗p < 0.001. (N) A model showing that SARS-CoV-2 ORF3a and SARS-CoV ORF3a(E171S R193W) promote lysosome exocytosis. They facilitate lysosomal targeting of the BORC-ARL8b complex and SNARE proteins. TRPML3 is essential for fusion of lysosomes with the PM in cells expressing ORF3a or SARS-CoV ORF3a(E171S R193W). Scale bars: (B, D, E, I, J, and L) 10 μm. See also Figures S6 and S7.

References

    1. Braulke T., Bonifacino J.S. Sorting of lysosomal proteins. Biochim. Biophys. Acta. 2009;1793:605–614. - PubMed
    1. Castaño-Rodriguez C., Honrubia J.M., Gutiérrez-Álvarez J., DeDiego M.L., Nieto-Torres J.L., Jimenez-Guardeño J.M., Regla-Nava J.A., Fernandez-Delgado R., Verdia-Báguena C., Queralt-Martín M., et al. Role of severe acute respiratory syndrome coronavirus Viroporins E, 3a, and 8a in Replication and pathogenesis. mBio. 2018;9 e02325–17. - PMC - PubMed
    1. Dehairs J., Talebi A., Cherifi Y., Swinnen J.V. CRISP-ID: decoding CRISPR mediated indels by Sanger sequencing. Sci. Rep. 2016;6:28973. - PMC - PubMed
    1. Deretic V., Saitoh T., Akira S. Autophagy in infection, inflammation and immunity. Nat. Rev. Immunol. 2013;13:722–737. - PMC - PubMed
    1. Freundt E.C., Yu L., Goldsmith C.S., Welsh S., Cheng A., Yount B., Liu W., Frieman M.B., Buchholz U.J., Screaton G.R., et al. The open reading frame 3a protein of severe acute respiratory syndrome- associated coronavirus promotes membrane rearrangement and cell death. J. Virol. 2010;84:1097–1109. - PMC - PubMed

Publication types

LinkOut - more resources