Genome‑wide association study and genomic prediction for growth traits in yellow-plumage chicken using genotyping-by-sequencing
- PMID: 34706641
- PMCID: PMC8555081
- DOI: 10.1186/s12711-021-00672-9
Genome‑wide association study and genomic prediction for growth traits in yellow-plumage chicken using genotyping-by-sequencing
Abstract
Background: Growth traits are of great importance for poultry breeding and production and have been the topic of extensive investigation, with many quantitative trait loci (QTL) detected. However, due to their complex genetic background, few causative genes have been confirmed and the underlying molecular mechanisms remain unclear, thus limiting our understanding of QTL and their potential use for the genetic improvement of poultry. Therefore, deciphering the genetic architecture is a promising avenue for optimising genomic prediction strategies and exploiting genomic information for commercial breeding. The objectives of this study were to: (1) conduct a genome-wide association study to identify key genetic factors and explore the polygenicity of chicken growth traits; (2) investigate the efficiency of genomic prediction in broilers; and (3) evaluate genomic predictions that harness genomic features.
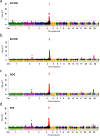
Results: We identified five significant QTL, including one on chromosome 4 with major effects and four on chromosomes 1, 2, 17, and 27 with minor effects, accounting for 14.5 to 34.1% and 0.2 to 2.6% of the genomic additive genetic variance, respectively, and 23.3 to 46.7% and 0.6 to 4.5% of the observed predictive accuracy of breeding values, respectively. Further analysis showed that the QTL with minor effects collectively had a considerable influence, reflecting the polygenicity of the genetic background. The accuracy of genomic best linear unbiased predictions (BLUP) was improved by 22.0 to 70.3% compared to that of the conventional pedigree-based BLUP model. The genomic feature BLUP model further improved the observed prediction accuracy by 13.8 to 15.2% compared to the genomic BLUP model.
Conclusions: A major QTL and four minor QTL were identified for growth traits; the remaining variance was due to QTL effects that were too small to be detected. The genomic BLUP and genomic feature BLUP models yielded considerably higher prediction accuracy compared to the pedigree-based BLUP model. This study revealed the polygenicity of growth traits in yellow-plumage chickens and demonstrated that the predictive ability can be greatly improved by using genomic information and related features.
© 2021. The Author(s).
Conflict of interest statement
The authors declare that they have no competing interests.
Figures


References
-
- International Chicken Genome Sequencing C. Sequence and comparative analysis of the chicken genome provide unique perspectives on vertebrate evolution. Nature. 2004;432:695–716. - PubMed
MeSH terms
Grants and funding
LinkOut - more resources
Full Text Sources

