. 2021 Oct 28;13(1):169.
doi: 10.1186/s13073-021-00986-9.

A small number of early introductions seeded widespread transmission of SARS-CoV-2 in Québec, Canada

Affiliations

A small number of early introductions seeded widespread transmission of SARS-CoV-2 in Québec, Canada

Carmen Lía Murall et al. Genome Med. .

Abstract

Background: Québec was the Canadian province most impacted by COVID-19, with 401,462 cases as of September 24th, 2021, and 11,347 deaths due mostly to a very severe first pandemic wave. In April 2020, we assembled the Coronavirus Sequencing in Québec (CoVSeQ) consortium to sequence SARS-CoV-2 genomes in Québec to track viral introduction events and transmission within the province.

Methods: Using genomic epidemiology, we investigated the arrival of SARS-CoV-2 to Québec. We report 2921 high-quality SARS-CoV-2 genomes in the context of > 12,000 publicly available genomes sampled globally over the first pandemic wave (up to June 1st, 2020). By combining phylogenetic and phylodynamic analyses with epidemiological data, we quantify the number of introduction events into Québec, identify their origins, and characterize the spatiotemporal spread of the virus.

Results: Conservatively, we estimated approximately 600 independent introduction events, the majority of which happened from spring break until 2 weeks after the Canadian border closed for non-essential travel. Subsequent mass repatriations did not generate large transmission lineages (> 50 sequenced cases), likely due to mandatory quarantine measures in place at the time. Consistent with common spring break and "snowbird" destinations, most of the introductions were inferred to have originated from Europe via the Americas. Once introduced into Québec, viral lineage sizes were overdispersed, with a few lineages giving rise to most infections. Consistent with founder effects, the earliest lineages to arrive tended to spread most successfully. Fewer than 100 viral introductions arrived during spring break, of which 7-12 led to the largest transmission lineages of the first wave (accounting for 52-75% of all sequenced infections). These successful transmission lineages dispersed widely across the province. Transmission lineage size was greatly reduced after March 11th, when a quarantine order for returning travellers was enacted. While this suggests the effectiveness of early public health measures, the biggest transmission lineages had already been ignited prior to this order.

Conclusions: Combined, our results reinforce how, in the absence of tight travel restrictions or quarantine measures, fewer than 100 viral introductions in a week can ensure the establishment of extended transmission chains.


Conflict of interest statement

The authors declare that they have no competing interests.

Figures
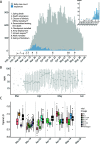
Fig. 1
Fig. 1
Timeline of COVID-19 cases and sequencing in Québec up to June 1. A Comparison of confirmed cases (grey) reported by public health authorities and high-quality sequences used in this study (blue) distributed by collection date. *Official lockdown included stay home orders and closure of schools and daycares. **Except schools in the city of Montreal. Timeline and control measures are from [15, 16]. Sample dates of sequences can be slightly offset from official daily case count due to reporting lags. B Age distribution of sequenced cases (mean and range shown). C Variation in viral epidemiological dynamics as estimated by Tajima’s D. Boxplots represent 99 resampled estimates of Tajima’s D from random resamplings of 20 genome sequences for each 2-week time period. Tajima’s D values are only estimated for PANGO lineages with at least 20 sequences in a given time period
Fig. 2
Fig. 2
Analysis of introduction events. A Introduction event origins as a percentage of the total inferred by each method. B Number of introduction events by region of origin inferred by self-reported travel history, phylogenetic ancestral state reconstruction, or both combined. For phylogeny-only and combined estimates, the points represent the ML estimate, while the bars indicate the difference between DELTRAN and ACCTRAN estimates (as lower and upper bounds). “Canada” refers to importations from other provinces into Québec. “Unclear” implies no travel history was available and ASR was ambiguous. C Travel-related sequences and the TMRCAs of inferred introductions into Québec over time by geographic origin. Dark densities: small points indicate sampling dates of sequenced cases with travel history. Large black points indicate the sampling date of the first sequenced case associated with each region. Pale densities: small points indicate the TMRCA of the inferred introductions using phylogeny and travel history (thus the date of introduction into Québec will be later). Triangles are the TMRCA of the first inferred introduction from each region into Québec, based on the phylogeny. Asterisks indicate uncertainty due to stem singletons in a large polytomy. The number of introductions is normalized to a relative density within each geographic category (rows). Grey bar is the spring break period in Québec
Fig. 3
Fig. 3
Phylogeny of SARS-CoV-2 genomes sampled from Québec in global context. A Pink dots on the time-scaled phylogeny show the most recent common ancestors (MRCA) of introduction events into Québec, inferred with ML ASR. Blue dots are all Québec sequences in the dataset. The heatmap shows Nextstrain clade designations for all sequences in the tree. B The same phylogeny, highlighting (blue branches) the eight Québec transmission lineages that gave rise to over 50 sequenced cases. Their introductions (large circles) are colored by their inferred region of origin. The colored heatmap shows the geographic origin of all sequences in the tree
Fig. 4
Fig. 4
A minority of introduction events are successful and spread across regions. A Distribution of Québec transmission lineage sizes, inferred using maximum likelihood ASR, n = 615. B Correlation between transmission lineage size and the number of Québec health regions in which it was sampled (Pearson’s r = 0.62, 95% CI = 0.57–0.67, p < 2.2 × 10⁻¹⁶). C Transmission lineage sizes generated by each PANGO lineage. Each point represents an independent introduction event into Québec. D Estimates of dN/dS for each PANGO lineage in Québec. For each PANGO lineage, the boxplots represent the distribution of dN/dS across sampled genomes compared to the ancestral reference genome (Wuhan-1; Genbank Accession MN908947.3)
Fig. 5
Fig. 5
Introduction and duration of the 12 largest Québec transmission lineages each responsible for 40 or more sequenced cases. Left: Timelines are colored by the health region in which each Québec transmission lineage predominantly spread, and which SARS-CoV-2 lineage (Pangolin nomenclature) was responsible. Squares represent the date the lineage was first sampled, colored by their inferred origin. Open circles show the median TMRCA of each transmission lineage, with whiskers showing HPD 95% intervals estimated with BEAST. Right: median and HPD 95% interval of the effective reproductive number, Re, for each transmission lineage, estimated using BEAST (Methods). These transmission lineages were inferred by ML ASR. See Figure S2 for TMRCA estimates for the 21 largest transmission lineages, represented by at least 20 sequences
Fig. 6
Fig. 6
Arrival of SARS-CoV-2 lineages and transmission-associated mutations over time. A Number of consensus sequences including each lineage-defining mutation, named by alternative nucleotides and genome position. The first detected occurrence of each derived allele is indicated by an arrow. The nucleotide positions correspond to the following amino positions in genes: A23403G;D614G;S;S, C1059T;T85I;orf1a;NSP2, C11916T;S25L;orf1a;NSP7, C14408T;P323L;orf1b;NSP12, C15324T;N629N;orf1b;NSP12, C3037T;F107F;orf1a;NSP3, G28881A;R203K;N;N, G28882A;R203R;N;N, G28883C;G204R;N;N. Nucleotide positions are coded as follows: ancestral nucleotide allele, genome position, derived nucleotide allele; ancestral amino acid allele, position in protein, derived amino acid allele; ORF; gene. B Introductions that generated transmission lineages of > 2 genomes as a function of the TMRCA (inferred by ML ASR), colored by PANGO lineage name and annotated if the introduction had reported travel history (y) or not (n). Pearson correlation coefficients: r = − 0.30 (− 0.43, − 0.16), p = 6.828e−05, black line. Note that the last inferred introduction event had a TMRCA of April 16th, not shown here because it was a singleton

References

    1. Martin MA, VanInsberghe D, Koelle K. Insights from SARS-CoV-2 sequences. Science. 2021;371(6528):466–467. doi: 10.1126/science.abf3995. - DOI - PubMed
    1. du Plessis L, McCrone JT, Zarebski AE, Hill V, Ruis C, Gutierrez B, et al. Establishment and lineage dynamics of the SARS-CoV-2 epidemic in the UK. Science. 2021;371(6530):708–712. doi: 10.1126/science.abf2946. - DOI - PMC - PubMed
    1. Komissarov AB, Safina KR, Garushyants SK, Fadeev AV, Sergeeva MV, Ivanova AA, Danilenko DM, Lioznov D, Shneider OV, Shvyrev N, Spirin V, Glyzin D, Shchur V, Bazykin GA. Genomic epidemiology of the early stages of the SARS-CoV-2 outbreak in Russia. Nat Commun. 2021;12(1):649. doi: 10.1038/s41467-020-20880-z. - DOI - PMC - PubMed
    1. da Silva FA, Shepherd JG, Williams T, Hughes J, Aranday-Cortes E, Asamaphan P, et al. Genomic epidemiology reveals multiple introductions of SARS-CoV-2 from mainland Europe into Scotland. Nat Microbiol. 2021;6(1):112–122. doi: 10.1038/s41564-020-00838-z. - DOI - PubMed
    1. Lemieux JE, Siddle KJ, Shaw BM, Loreth C, Schaffner SF, Gladden-Young A, et al. Phylogenetic analysis of SARS-CoV-2 in Boston highlights the impact of superspreading events. Science. 2021;371(6529, 6529) Available from:. 10.1126/science.abe3261. - PMC - PubMed

Publication types