. 2022 Aug;71(8):1642-1655.
doi: 10.1136/gutjnl-2021-324170. Epub 2021 Oct 27.

MicroRNA-206 promotes the recruitment of CD8+ T cells by driving M1 polarisation of Kupffer cells

Affiliations

MicroRNA-206 promotes the recruitment of CD8+ T cells by driving M1 polarisation of Kupffer cells

Ningning Liu et al. Gut. 2022 Aug.

Abstract

Objective: Kupffer cells (KCs) protect against hepatocellular carcinoma (HCC) by communicating with other immune cells. However, the underlying mechanism(s) of this process is incompletely understood.

Design: FVB/NJ mice were hydrodynamically injected with AKT/Ras and Sleeping Beauty transposon to induce HCC. Mini-circle and Sleeping Beauty were used to overexpress microRNA-206 in KCs of mice. Flow cytometry and immunostaining were used to evaluate the change in the immune system.

Results: Hydrodynamic injection of AKT/Ras into mice drove M2 polarisation of KCs and depletion of cytotoxic T cells (CTLs) and promoted HCC development. M1-to-M2 transition of KCs impaired microRNA-206 biogenesis. By targeting Klf4 (kruppel like factor 4) and, thereby, enhancing the production of M1 markers including C-C motif chemokine ligand 2 (CCL2), microRNA-206 promoted M1 polarisation of macrophages. Indeed, microRNA-206-mediated increase of CCL2 facilitated hepatic recruitment of CTLs via CCR2. Disrupting each component of the KLF4/CCL2/CCR2 axis impaired the ability of microRNA-206 to drive M1 polarisation of macrophages and recruit CTLs. In AKT/Ras mice, KC-specific expression of microRNA-206 drove M1 polarisation of KCs and hepatic recruitment of CTLs and fully prevented HCC, while 100% of control mice died from HCC. Disrupting the interaction between microRNA-206 and Klf4 in KCs and depletion of CD8+ T cells impaired the ability of miR-206 to prevent HCC.

Conclusions: M2 polarisation of KCs is a major contributor of HCC in AKT/Ras mice. MicroRNA-206, by driving M1 polarisation of KCs, promoted the recruitment of CD8+ T cells and prevented HCC, suggesting its potential use as an immunotherapeutic approach.

Keywords: Kupffer cell; hepatocellular carcinoma; immunotherapy.


Conflict of interest statement

Competing interests: None declared.

Figures
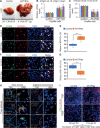
Figure 1
Figure 1
AKT/Ras activation promoted M2 polarisation of KCs. (A) Representative photos of livers of FVB/NJ mice injected with pT3-EF1α (control, n=6, 5 w.p.i.) and AKT/Ras (n=6, 5 w.p.i.). (B) mRNA levels of M2 marker genes encoding MGL2, IL-10, MGL1 and ARG1 in KCs of two groups of mice. (C) mRNA levels of M1 marker genes in KCs of two groups of mice. (D–E) Immunostaining of CD206 (M2 marker) and CLEC4F (KC marker) and the ratios of M2 KCs (CD206+CLEC4F+) in livers of two groups of mice. Scale bar: 20 μm. (F–G) Immunostaining of iNOS (M1 marker) and CLEC4F and the ratios of M1 KCs (iNOS+CLEC4F+) in livers of two groups of mice. Scale bar: 10 μm. (H) Immunostaining of CLEC4F and phosphorylated-AKT (AKT-S473) in livers of human patients. Scale bar: 50 μm. (I) Immunostaining of CD8 and CLEC4F, and the numbers of CD8+ T cells per 1000 liver cells in two groups of mice. Scale bar: 100 μm. Data represent mean±SEM. **P<0.01 and ***p<0.001 (figure 1A–G and I: Mann-Whitney U test). ARG1, arginase 1; KCs, Kupffer cells; LW, liver weight; MGL2, macrophage galactose N-acetyl-galactosamine specific lectin 2; w.p.i., weeks postinjection of AKT/Ras.
Figure 2
Figure 2
KC-specific expression of miR-206 prevented HCC in AKT/Ras mice. (A) miR-206 levels in KCs and hepatocytes (HCs) isolated from wild-type FVB/NJ mice. (B) Levels of miR-206 in KCs and HCs from FVB/NJ mice injected with pT3-EF1α (control, n=6, 5 w.p.i.) and AKT/Ras (n=6, 5 w.p.i.). (C) miR-206 levels in M1 and M2 KCs isolated from wild-type FVB/NJ mice. (D) Kaplan-Meier survival curves of AKT/Ras mice injected with pT3-CD68p-scramble (AKT/Ras, n=6) or pT3-CD68p-miR-206 (AKT/Ras/miR-206, n=6). (E) Macroscopic and microscopic (H&E) appearance of livers from AKT/Ras/scramble (n=6, 5 w.p.i.) and AKT/Ras/miR-206 mice (n=6, 5 w.p.i.). (F) Study design to evaluate the therapeutic effect of miR-206 on HCC. (G) Kaplan-Meier survival curves of AKT/Ras mice injected with MC-CD68p-scramble (AKT/Ras, n=6) or MC-CD68p-miR-206 (AKT/Ras/miR-206, n=6). (H) Macroscopic and microscopic (H&E) appearance of livers from AKT/Ras (n=6, 3 w.p.i.), AKT/Ras/MC-CD68p-scramble (n=6, 7 w.p.i.) and AKT/Ras/MC-CD68p-miR-206 mice (n=6, 7 w.p.i.). Data represent mean±SEM. **P<0.01 (figure 2A–C and E: Mann-Whitney U test; figure 2D and G: log-rank test; figure 2H: two-way analysis of variance test). KCs, Kupffer cells; w.p.i., weeks postinjection of AKT/Ras.
Figure 3
Figure 3
miR-206 attenuated M2 polarisation of KCs in AKT/Ras mice. (A and B) Immunostaining of iNOS, CD206 and CLEC4F (KC-specific marker) and the ratios of M1 or M2 KCs in livers of AKT/Ras mice injected with pT3-CD68p-scramble (n=6, 5 w.p.i.) or pT3-CD68p-miR-206 mice (n=6, 5 w.p.i.). (C and D) Immunostaining of iNOS, CD206 and CLEC4F and the ratios of M1 or M2 KCs in livers of AKT/Ras (n=6, 3 w.p.i.), AKT/Ras/MC-CD68p-scramble (n=6, 7 w.p.i.) and AKT/Ras/MC-CD68p-miR-206 (n=6, 7 w.p.i.) mice. Data represent mean±SEM. **P< 0.01 and NS (figure 3A–B: Mann-Whitney U test; figure 3C–D: two-way analysis of variance test). Scale bar: figure 3A and C: 10 μm; figure 3B and D: 20 μm. KCs, Kupffer cells; NS, no significance; w.p.i., weeks postinjection of AKT/Ras.
Figure 4
Figure 4
miR-206 promoted hepatic recruitment of CD8+ T cells by driving CCL2 production. (A) mRNA levels of M1 marker genes in KCs of AKT/Ras/scramble (n=6, 5 w.p.i.) and AKT/Ras/miR-206 (n=6, 5 w.p.i.) mouse cohorts. (B) Serum levels of TNFα, IL-6 and CCL2 in two groups of mice. (C) mRNA levels of CCL2 in HCC, colon cancer (COAT), breast cancer (BRCA), lung adenocarcinoma (LUAD), lung squamous cell carcinoma (LUSC) and rectum adenocarcinoma (READ) in the TCGA database (T: tumour; N: normal livers). Expression levels were shown as Log2 (TPM+1). (D) Immunostaining of CD8, CLEC4F and the numbers of CD8+ cells per 1000 liver cells in two group of mice. (E) Immunostaining of CD8 and CLEC4F and the numbers of CD8+ cells per 1000 liver cells in AKT/Ras (n=6, 3 w.p.i.), AKT/Ras/MC-CD68p-scramble (n=6, 7 w.p.i.) and AKT/Ras/ MC-CD68p-miR-206 (n=6, 7 w.p.i.). Data represent mean±SEM. *P<0.05, **p<0.01 and ***p<0.001 (figure 4A, B D: Mann-Whitney U test; figure 4C: two-tailed Student’s t-test; figure 4E: two-way analysis of variance test). Scale bar: 100 μm. HCC, hepatocellular carcinoma; KCs, Kupffer cells; TPM, transcripts per million; w.p.i., weeks postinjection of AKT/Ras.
Figure 5
Figure 5
miR-206 triggered M1 polarisation of both human and mouse macrophages. (A and C) mRNA levels of M1 marker genes in RAW264.7 and THP-1 cells transfected with pT3-CD68p-miR-206 (miR-206) or pT3-CD68p-scramble (control). (B and D) Flow cytometry analysis of iNOS+ cells in RAW264.7 and THP-1 cells transfected with pT3-CD68p-miR-206 or pT3-CD68p-scramble. Data represent mean±SEM. **P<0.01 (figure 5: two-tailed Student’s t-test).
Figure 6
Figure 6
KLF4 mediated the role of miR-206 in promoting M1 polarisation of macrophages. (A) Graphic representation of the conserved miR-206 binding motif within the 3’UTR of Klf4. Complementary sequence to the seed region of miR-206 within the 3’UTR of Klf4 is conserved between human and mouse (highlighted in green). (B) mRNA levels of Klf4 and Ccl2 in hepatocytes and KCs isolated from wild-type FVB/NJ mice. (C) mRNA levels of Klf4 and Ccl2 in RAW264.7 cells transfected with pT3-CD68p-miR-206 or pT3-CD68p-scramble (control). (D) Luciferase activities of the reporter constructs containing either wild-type or mutated 3’UTR of mouse Klf4 after transfection of pT3-CD68p-scramble (control) or pT3-CD68p-miR-206. (E) mRNA levels of M1 maker genes in RAW264.7 Cells transfected with pT3-EF1α (control), pT3-p65 (p65) or a combination of pT3-Klf4 and pT3-p65 (p65+KLF4). (F) Protein levels of KLF4 and CCL2 in three groups of RAW264.7 cells transfected with pT3-CD68p-scramble, pT3-CD68p-miR-206 or a combination of pT3-CD68p-miR-206 and a sgRNA designed to ablate the binding site within the 3’UTR of Klf4. (G) mRNA levels of M1 marker genes in three groups of RAW264.7 cells. (H) Levels of iNOS, COX-2, TNFα and CCL2 in cell lysates of three groups of RAW264.7 cells. (I–J) Immunostaining of iNOS and the ratios of iNOS+ cells in three groups of RAW264.7 cells. Data represent mean±SEM. *P<0.05, **p<0.01, ***p<0.001 and NS (figure 6B–D: two-tailed Student’s t-test; figure 6E–J: two-way analysis of variance test). COX-2, cyclooxygenase 2; KCs, Kupffer cells; NS, no significance.
Figure 7
Figure 7
miR-206 enhanced chemotaxis of CD8+ T cells by activating the CCL2/CCR2 axis. (A) Levels of CCL2 in the medium of RAW264.7 cells that were transfected with pT3-CD68p-scramble (control), pT3-CD68p-miR-206 (miR-206) or a combination of pT3-CD68p-miR-206 and the sgRNA to ablate the binding site of miR-206 within the 3’UTR of Klf4 (miR-206+sgRNA). (B) Proliferation of CD8+ T cells cocultured with three groups of RAW264.7 cells. (C) mRNA levels of genes encoding CD69 and CD154 in CD8+ T cells that were cocultured with the three groups of RAW264.7 cells. (D) The migration ratios of CD8+ T cells cocultured with three groups of RAW264.7 cells. (E) The migration ratios of CD8+ T cells cocultured with three groups of RAW264.7 cells treated with pT3-CD68p-scramble (control), pT3-CD68p-miR-206 or a combination of pT3-CD68p-miR-206 and CCL2 mAb. CCL2 mAb was used to neutralise CCL2 in the culture medium. (F) The migration ratios of CD8+ T cells cocultured with three groups of RAW264.7 cells treated with pT3-CD68p-scramble (control), pT3-CD68p-miR-206 or a combination of pT3-CD68p-miR-206 and CAS, a CCR2 antagonist. (G) The migration ratios of CD8+ T cells cocultured with KCs isolated from livers of FVB/NJ mice injected with pT3-EF1α (control, n=3, 5 w.p.i.), AKT/Ras/scramble (n=3, 5 w.p.i.) or AKT/Ras/miR-206 (n=3, 5 w.p.i.). (H) The migration ratios of CD8+ T cells cocultured with KCs isolated from livers of AKT/Ras/MC-CD68p-scramble (n=3, 7 w.p.i.) and AKT/Ras/MC-CD68p-miR-206 (n=3, 7 w.p.i.). (I–J) Immunostaining of CD8 and CCL2 in livers of the AKT/Ras models of prevention and treatment. Scale bar: 100 µm. Data represent mean±SEM. *P<0.05; **p<0.01 and NS (figure 7A–G: two-way analysis of variance test. figure 7H: two-tailed Student’s t-test). NS, no significance; KCs, Kupffer cells; w.p.i., weeks postinjection of AKT/Ras.
Figure 8
Figure 8
Disrupting the interaction between miR-206 and Klf4 offset the role of miR-206 in preventing HCC development. (A and B) mRNA levels of Klf4 in KCs and serum CCL2 in AKT/Ras mice injected with pT3-CD68-scramble (n=6, 8 w.p.i.), pT3-CD68-miR-206 (n=6, 8 w.p.i.) or a combination of pT3-CD68-miR-206 and the sgRNA (n=6, 8 w.p.i.). (C) Macroscopic and microscopic (H&E) appearance of livers of three groups of mice. (D–G) Ratios of M1 or M2 KCs in livers of three groups of mice. (H–I) Ratios of CTLs (CD8+GrB+) to CD8+ T cells in livers of three groups of mice. Data represent mean±SEM. **P<0.01 (figure 8: two-way analysis of variance test). HCC, hepatocellular carcinoma; KCs, Kupffer cells; w.p.i., weeks postinjection of AKT/Ras.
Figure 9
Figure 9
Depletion of CD8+ T cells impaired the ability of miR-206 to prevent HCC. (A) Levels of CD8+ T cells in livers of AKT/Ras treated with scramble (n=6, 7 w.p.i.), miR-206 and IgG1 mAb (n=6, 7 w.p.i.), or a combination of miR-206 and CD8 mAb (n=6, 7 w.p.i.). (B) mRNA levels of Klf4 in KCs and serum CCL2 in three groups of mice. (C and D) Ratios of M1 or M2 KCs in livers of three groups of mice. (E) Macroscopic and microscopic (H&E) appearance of livers in three groups of mice. Data represent mean±SEM. **P<0.01, ***p<0.001 and NS (figure 9: two-way analysis of variance test). HCC, hepatocellular carcinoma; KCs, Kupffer cells; mAb, monoclonal antibody; NS, no significance; w.p.i., weeks postinjection of AKT/Ras.

References

    1. Slotta JE, Kollmar O, Ellenrieder V, et al. . Hepatocellular carcinoma: surgeon's view on latest findings and future perspectives. World J Hepatol 2015;7:1168–83. 10.4254/wjh.v7.i9.1168 - DOI - PMC - PubMed
    1. Johnston MP, Khakoo SI. Immunotherapy for hepatocellular carcinoma: current and future. World J Gastroenterol 2019;25:2977–89. 10.3748/wjg.v25.i24.2977 - DOI - PMC - PubMed
    1. Pinato DJ, Guerra N, Fessas P, et al. . Immune-Based therapies for hepatocellular carcinoma. Oncogene 2020;39:3620–37. 10.1038/s41388-020-1249-9 - DOI - PMC - PubMed
    1. Mittal D, Gubin MM, Schreiber RD, et al. . New insights into cancer immunoediting and its three component phases--elimination, equilibrium and escape. Curr Opin Immunol 2014;27:16–25. 10.1016/j.coi.2014.01.004 - DOI - PMC - PubMed
    1. Kolios G, Valatas V, Kouroumalis E. Role of Kupffer cells in the pathogenesis of liver disease. World J Gastroenterol 2006;12:7413. 10.3748/wjg.v12.i46.7413 - DOI - PMC - PubMed

Publication types