. 2021 Nov 2;118(44):e2114552118.
doi: 10.1073/pnas.2114552118.

Cryo-EM structure of the needle filament tip complex of the Salmonella type III secretion injectisome

Affiliations

Cryo-EM structure of the needle filament tip complex of the Salmonella type III secretion injectisome

Emily Z Guo et al. Proc Natl Acad Sci U S A. .

Abstract

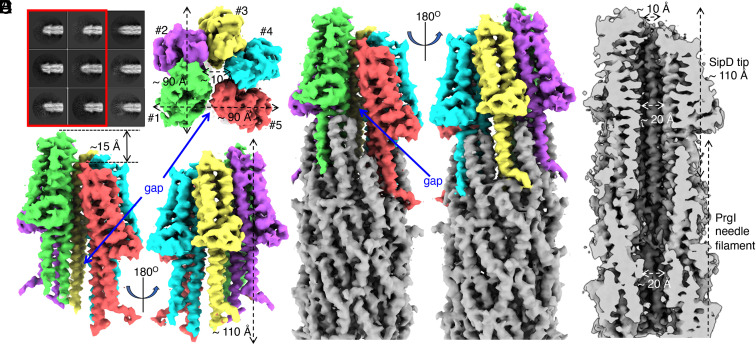
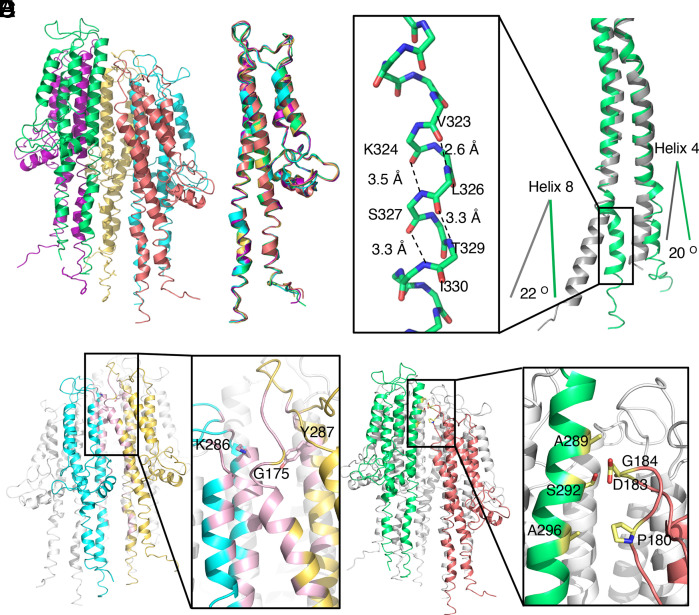
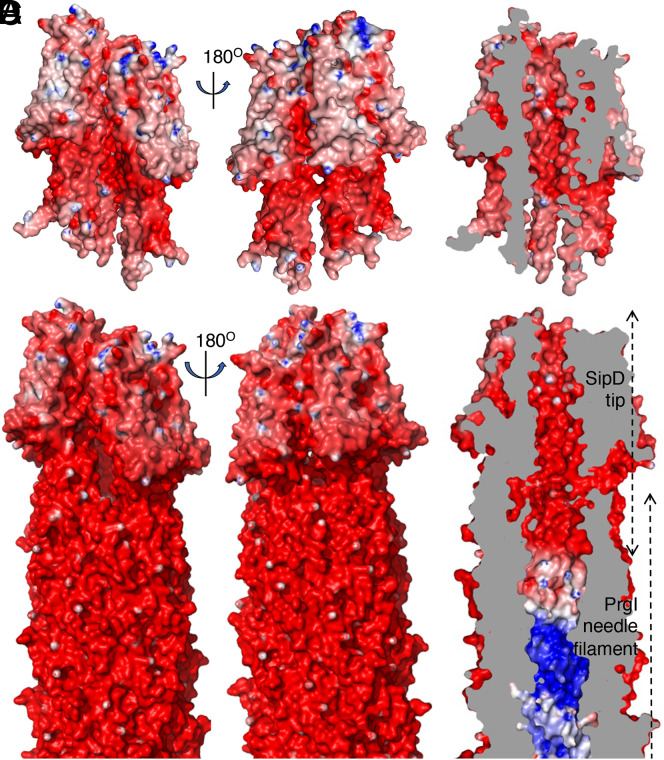
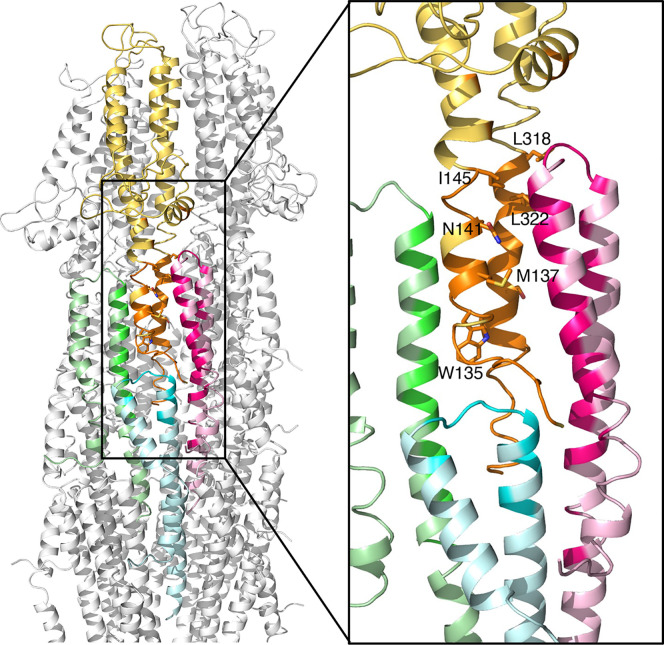
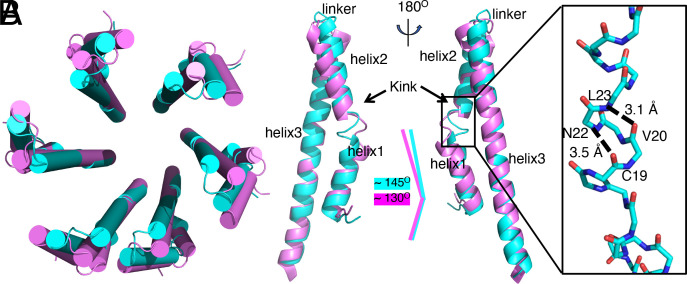
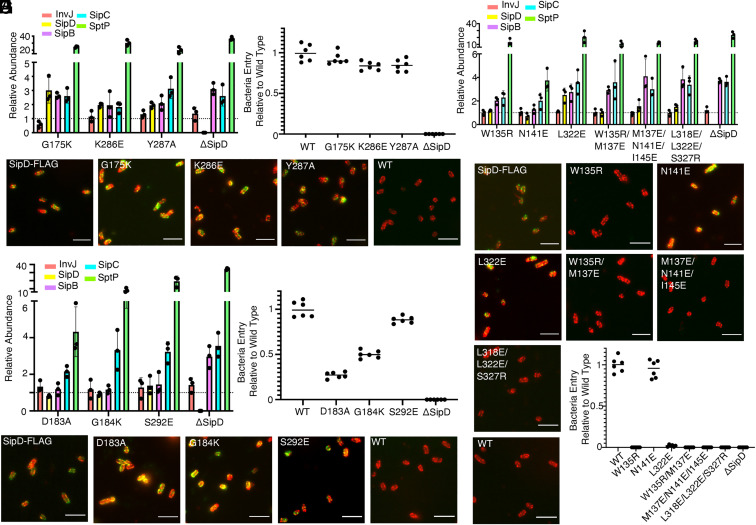
Type III secretion systems are multiprotein molecular machines required for the virulence of several important bacterial pathogens. The central element of these machines is the injectisome, a ∼5-Md multiprotein structure that mediates the delivery of bacterially encoded proteins into eukaryotic target cells. The injectisome is composed of a cytoplasmic sorting platform, and a membrane-embedded needle complex, which is made up of a multiring base and a needle-like filament that extends several nanometers from the bacterial surface. The needle filament is capped at its distal end by another substructure known as the tip complex, which is crucial for the translocation of effector proteins through the eukaryotic cell plasma membrane. Here we report the cryo-EM structure of the Salmonella Typhimurium needle tip complex docked onto the needle filament tip. Combined with a detailed analysis of structurally guided mutants, this study provides major insight into the assembly and function of this essential component of the type III secretion protein injection machine.

Keywords: bacterial pathogenesis; cryoelectron microscopy; organelle assembly; protein secretion; structural biology.


Conflict of interest statement

The authors declare no competing interest.

Figures

Fig. 1.
Fig. 1.
Structure of the type III secretion needle filament tip complex. (A) Representative 2D class averages of needle filaments with (red box) and without tip complexes. (B and C) Top (B) and side (C) views of the SipD pentamer. Each subunit is rendered in a different color. The dimensions of the complex and the gap between the first and the fifth SipD subunits are indicated. The five SipD subunits are in helical arrangement and the distance along the filament axis between the first and the fifth subunits is about 15 Å (indicated in C). (D) Side views of the SipD pentamer sitting on top of the needle filament. The five SipD subunits are rendered in different colors. The needle filament is colored in gray. The gap between the first and the fifth SipD subunits is indicated. (E) Cut-through view of the tip complex and needle filament. The diameters of the pore and the central lumen are indicated.
Fig. 2.
Fig. 2.
Atomic model of the tip complex. (A) Atomic model of the SipD pentamer. Each SipD subunit is colored following the same color scheme used in Fig. 1. (B) Structural alignment of the five SipD subunits. (C) Structural differences between SipD in the tip complex (green) and the crystal structure of monomeric SipD (gray) (PDB ID: 3NZZ). Shown in the Inset is a 310 helix that is present in SipD in the tip complex but absent in the monomeric structure. Hydrogen bonds are denoted as dashed lines. The differences between the orientations of residues 136 to 146 of helix 4 and residues 318 to 340 of helix 8 in the complex and monomeric structures of SipD are shown. (D) Common intersubunit interface in the SipD tip complex. Two of the SipD subunits in the complex are colored in yellow and cyan and the other three are colored in white. The interface between the two neighboring SipD subunits is highlighted in pink. The Inset shows a detail of the interface indicating the relevant residues involved. (E) SipD1–SipD5 interface. SipD1 and SipD5 are colored in green and deep salmon, respectively. The interface, depicted in the Inset, is highlighted in yellow. Side chains of the interacting residues targeted for functional analysis are shown as a stick model.
Fig. 3.
Fig. 3.
Electrostatic map of the lumen and outer surface of the SipD tip complex. (A and B) Electrostatic potential map of the SipD pentamer. A cut-through view showing the electrostatic surface potential of the lumen is shown in B. (C and D) Electrostatic surface potential map of the needle filament and tip complex. A cut-through view highlighting the differences in the electrostatic properties of the needle filament and tip complex lumen is shown in D.
Fig. 4.
Fig. 4.
Atomic interfaces between the SipD pentamer and the PrgI needle filament. Ribbon representation of the SipD–PrgI interface. One SipD subunit (yellow) interacts with three PrgI subunits (light green, light cyan, and light pink). The interfaces are highlighted in orange in SipD, and in green, cyan, and pink in PrgI, respectively. The Inset shows the interacting residues (shown as a stick model) targeted for functional analysis.
Fig. 5.
Fig. 5.
Conformational changes in the needle filament protein PrgI upon assembly and docking of the needle tip complex. (A) Cartoon representation (alpha-helices shown as cylinders) of the top view of superimposed structures of the first (cyan) and second (violet) turns of the PrgI subunits in the needle filament structure. (B) Superimposition of the structures of a PrgI subunit in the first (cyan) and second (violet) turns of the needle filament structure. Conformation changes in the kink and linker regions as well as helix 3 are denoted. The Inset shows a 310 helix present in the kink region of PrgI subunits in the first turn, with relevant residues denoted.
Fig. 6.
Fig. 6.
Structure and function analyses of the tip structure and its interface with the needle filament. (AC) Functional analysis of S. Typhimurium strains expressing SipD variants with the indicated mutations in residues involved in the formation of the common SipD intersubunit interface. (A) Bar graph detailing the relative abundance of the indicated secreted substrates in culture supernatants standardized relative to the values of the WT strains (given a value of 1 and demarcated by a gray dashed line). All values represent the mean ± the SD of three independent experiments. The data were compiled from the data presented in Dataset S1. (B) Fluorescence microscopy images of intact, nonpermeabilized S. Typhimurium expressing FLAG-tagged wild-type SipD (SipD-FLAG), or the indicated mutant forms. Bacterial cells were probed with antibodies to the FLAG tag (green) and to lipopolysaccharide (red). The wild-type strain (with no tag) (WT) was included as a negative control. (Scale bars, 5 μm.) (C) Cultured epithelial cell invasion ability of S. Typhimurium strains expressing the indicated SipD mutants. Numbers represent the percentage of the inoculum that survived antibiotic treatment due to internalization and are the mean ± SD of six independent experiments normalized to wild type, which was set to 1. T3SS, type III secretion system; WT, wild type. (D) Secretion profile of different S. Typhimurium SipD1–SipD5 interface mutant strains shown by bar graph. The relative abundance of the secreted substrates has been standardized relative to the values of the WT strains, which were given a value of 1 and are demarcated by a gray dashed line. All values represent the mean ± the SD of three independent experiments. (D and E) Functional analysis of S. Typhimurium strains expressing SipD variants with the indicated mutations in residues involved in the formation of the SipD1–SipD5 interface. Secretion profiles (D), culture epithelial cell invasion (E), and fluorescence microscopy images (F) are shown. Experiments were conducted as indicated in AC. (FH) Functional analysis of S. Typhimurium strains expressing SipD variants with the indicated mutations in residues involved in the formation of the SipD–PrgI interface. Secretion profiles (G), fluorescence microscopy images (H), and culture epithelial cell invasion (I) data are shown. Experiments were conducted as indicated in AC.

References

    1. Galán J. E., Lara-Tejero M., Marlovits T. C., Wagner S., Bacterial type III secretion systems: Specialized nanomachines for protein delivery into target cells. Annu. Rev. Microbiol. 68, 415–438 (2014). - PMC - PubMed
    1. Deng W., et al. ., Assembly, structure, function and regulation of type III secretion systems. Nat. Rev. Microbiol. 15, 323–337 (2017). - PubMed
    1. Notti R. Q., Stebbins C. E., The structure and function of type III secretion systems. Microbiol. Spectr. 4, 1–48 (2016). - PMC - PubMed
    1. Schreiber K. J., Chau-Ly I. J., Lewis J. D., What the wild things do: Mechanisms of plant host manipulation by bacterial type III-secreted effector proteins. Microorganisms 9, 1029 (2021). - PMC - PubMed
    1. Galán J. E., Common themes in the design and function of bacterial effectors. Cell Host Microbe 5, 571–579 (2009). - PMC - PubMed

Publication types

MeSH terms

Substances