. 2021 Oct 27;12(1):6207.
doi: 10.1038/s41467-021-26240-9.

A non-canonical, interferon-independent signaling activity of cGAMP triggers DNA damage response signaling

Affiliations

A non-canonical, interferon-independent signaling activity of cGAMP triggers DNA damage response signaling

Daipayan Banerjee et al. Nat Commun. .

Abstract

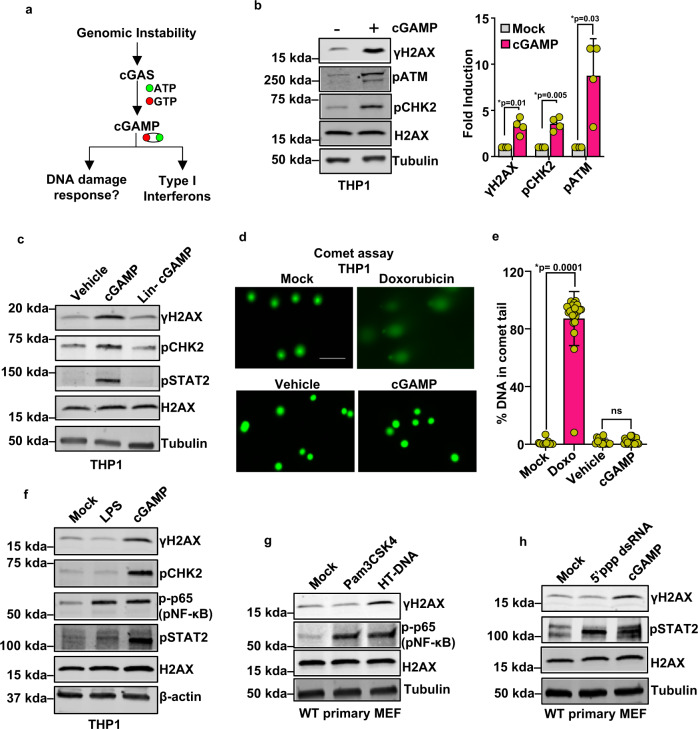
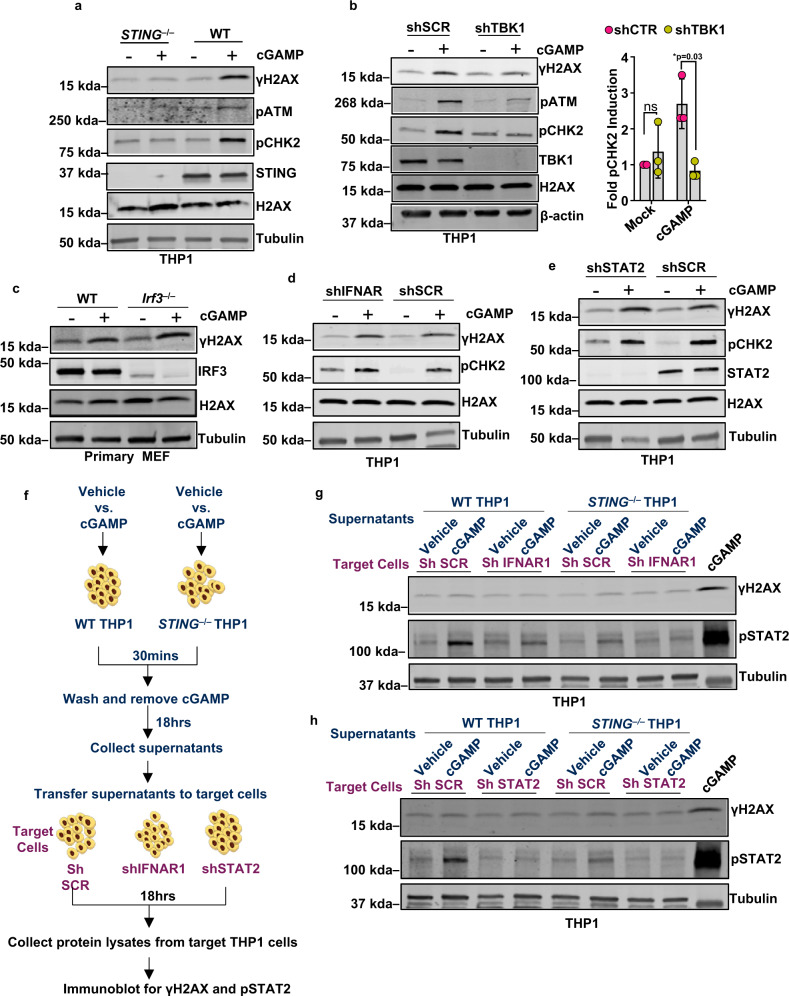
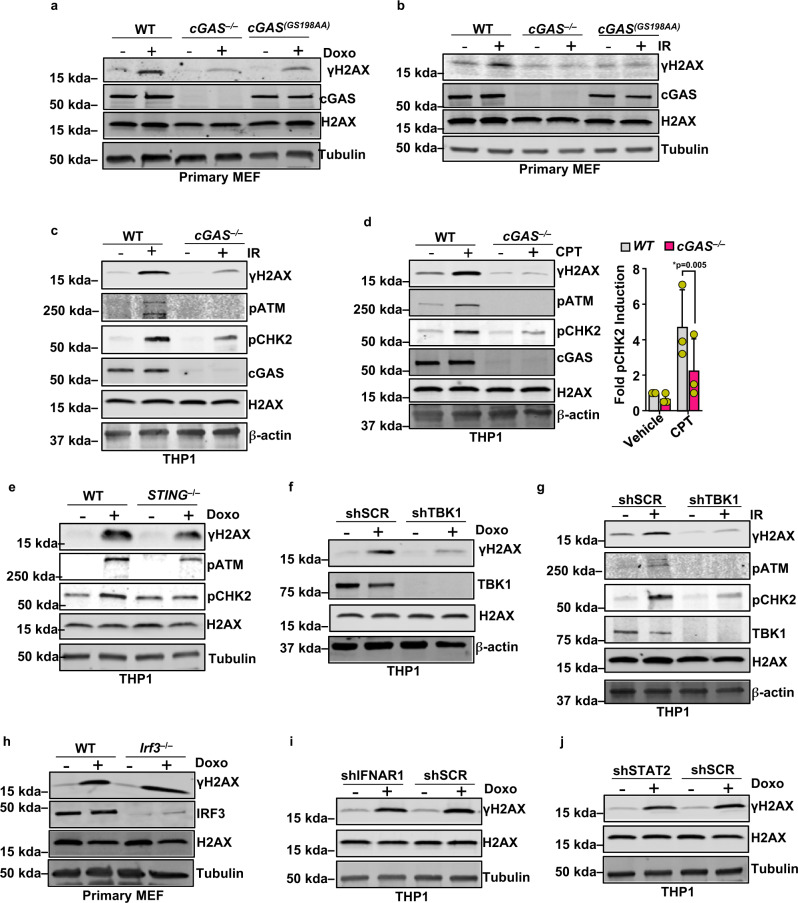
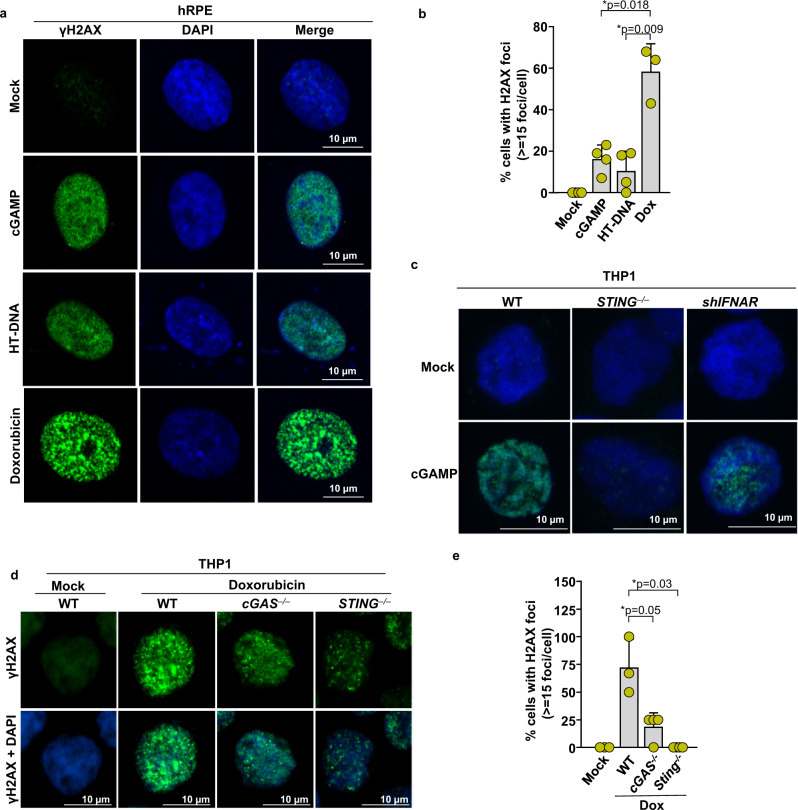
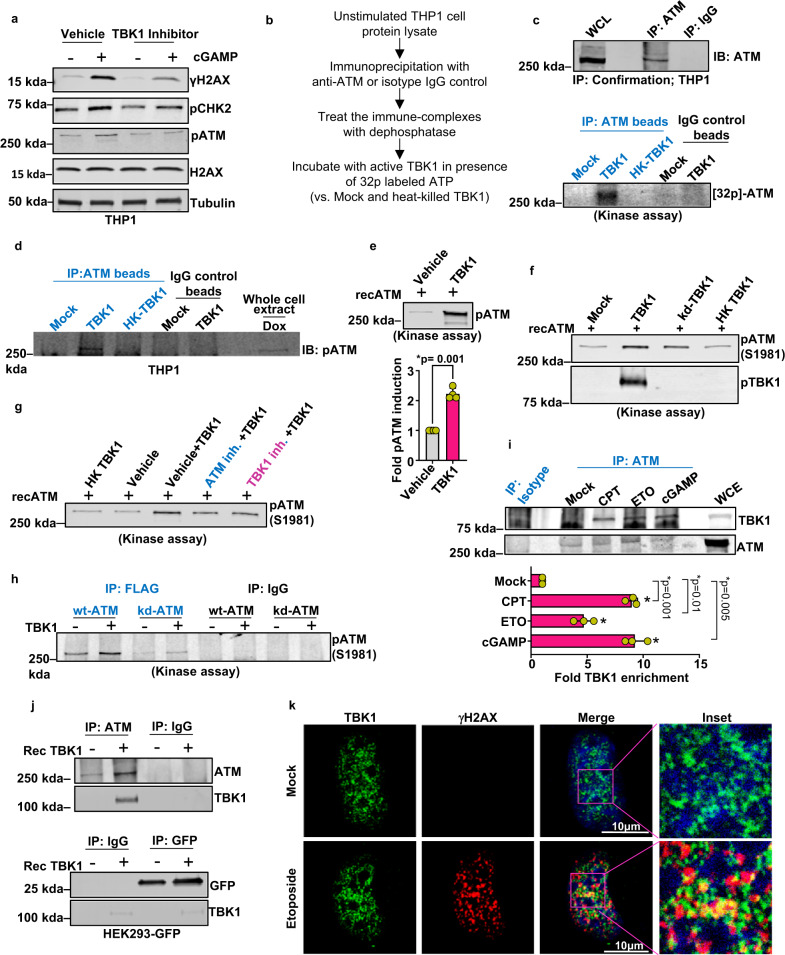
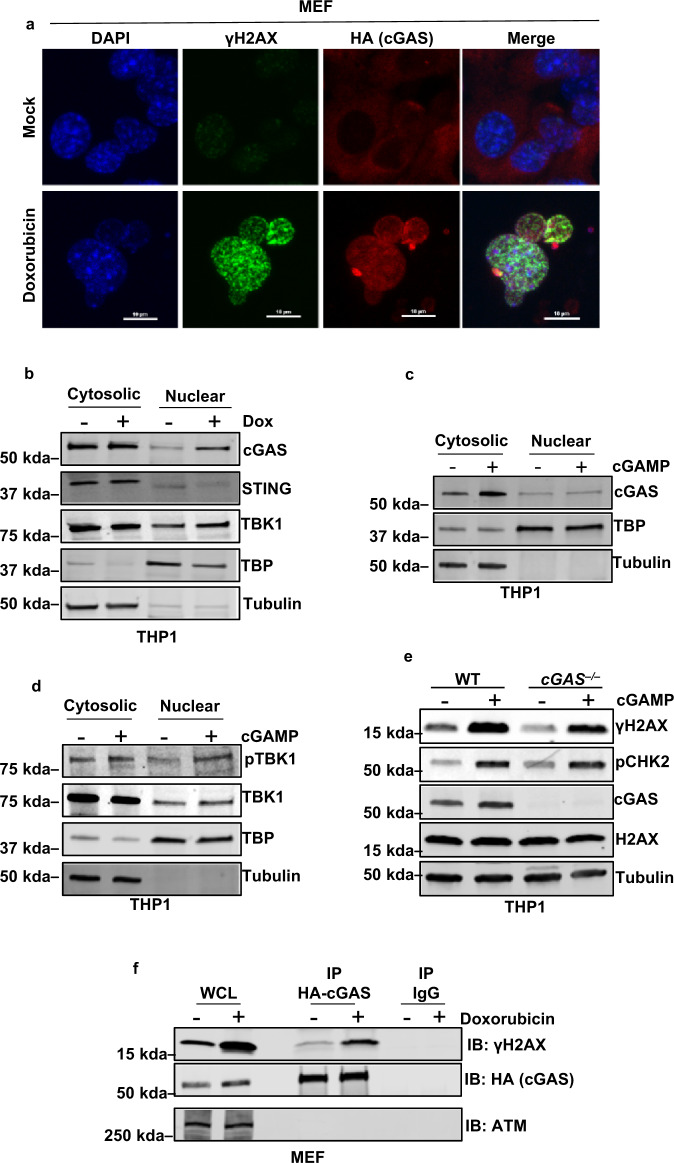
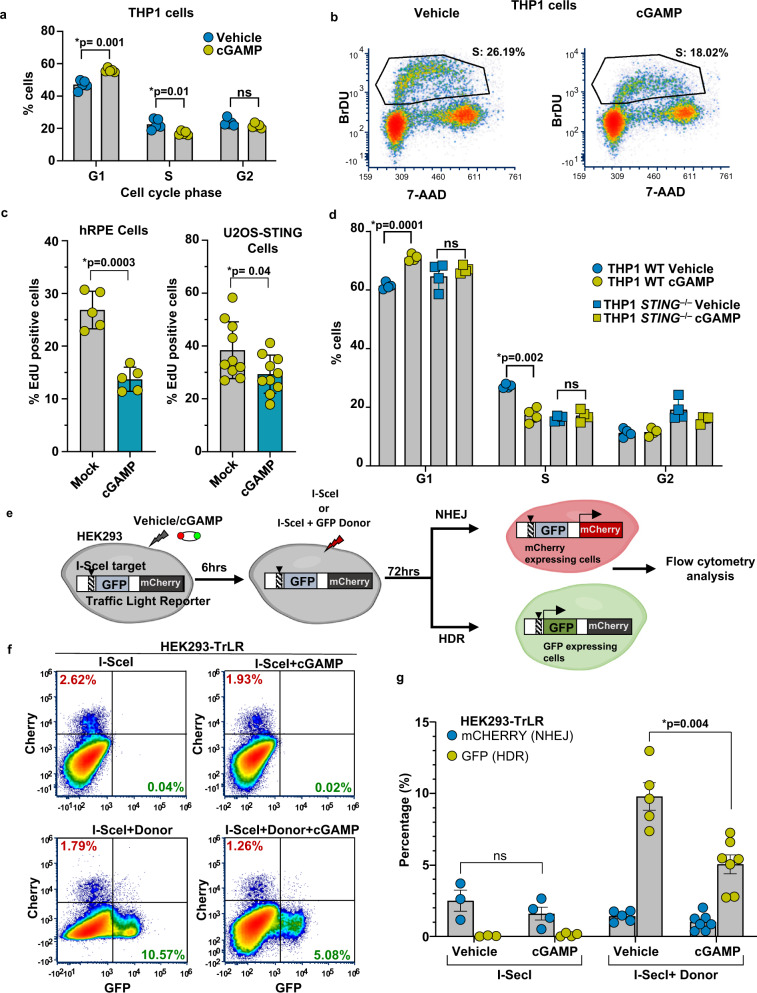
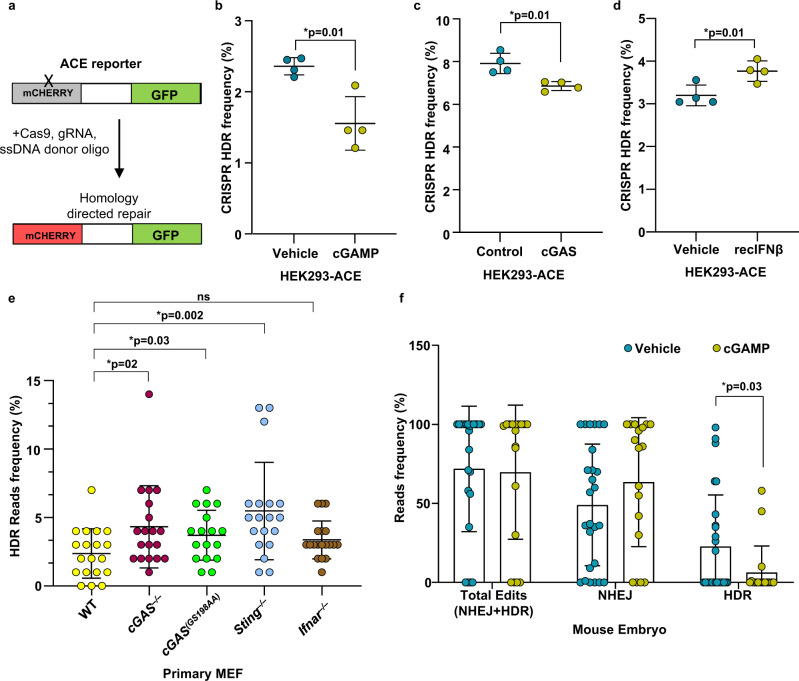
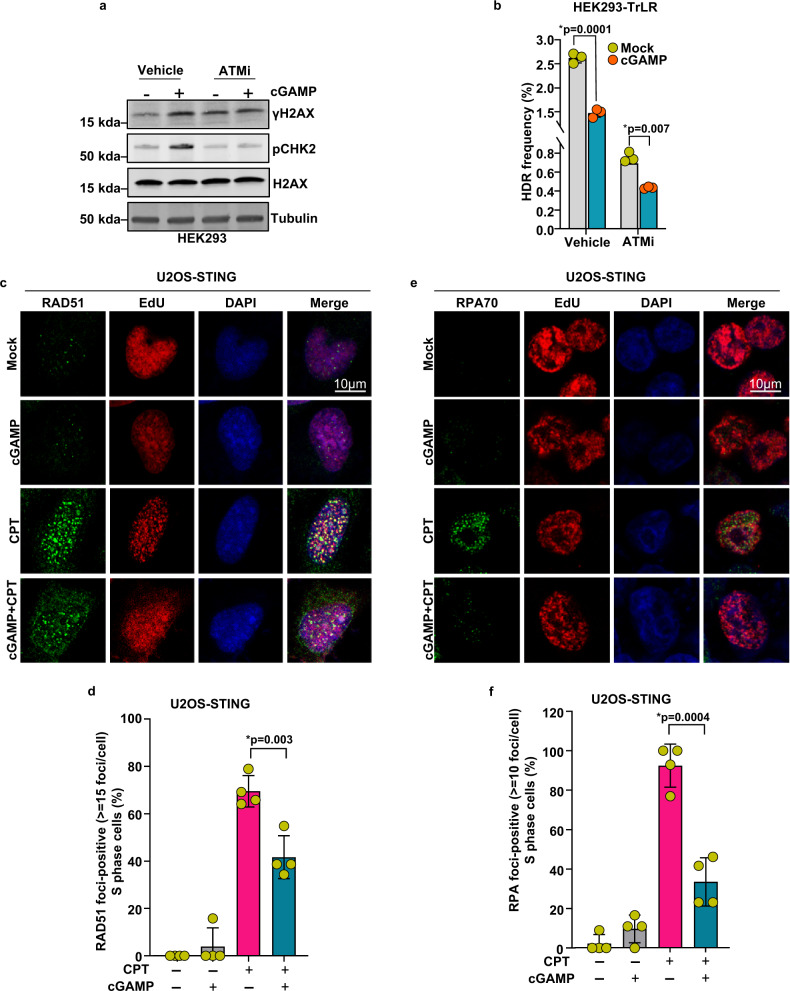
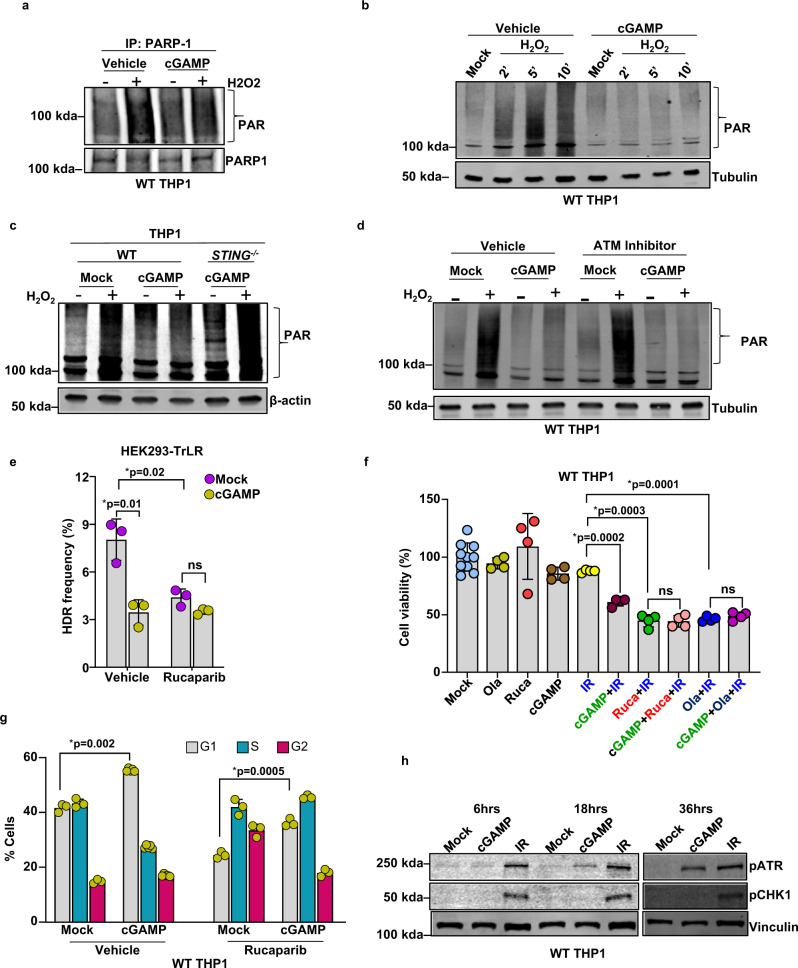
Cyclic guanosine monophosphate-adenosine monophosphate (cGAMP), produced by cyclic GMP-AMP synthase (cGAS), stimulates the production of type I interferons (IFN). Here we show that cGAMP activates DNA damage response (DDR) signaling independently of its canonical IFN pathways. Loss of cGAS dampens DDR signaling induced by genotoxic insults. Mechanistically, cGAS activates DDR in a STING-TBK1-dependent manner, wherein TBK1 stimulates the autophosphorylation of the DDR kinase ATM, with the consequent activation of the CHK2-p53-p21 signal transduction pathway and the induction of G1 cell cycle arrest. Despite its stimulatory activity on ATM, cGAMP suppresses homology-directed repair (HDR) through the inhibition of polyADP-ribosylation (PARylation), in which cGAMP reduces cellular levels of NAD+; meanwhile, restoring NAD+ levels abrogates cGAMP-mediated suppression of PARylation and HDR. Finally, we show that cGAMP also activates DDR signaling in invertebrate species lacking IFN (Crassostrea virginica and Nematostella vectensis), suggesting that the genome surveillance mechanism of cGAS predates metazoan interferon-based immunity.


Conflict of interest statement

B.D.G., J.A., and N.K. are named as inventors on patent applications on macular degeneration filed by the University of Virginia or the University of Kentucky. J.A. is a co-founder of iVeena Holdings, iVeena Delivery Systems, and Inflammasome Therapeutics and has been a consultant for Allergan, Biogen, Boehringer-Ingelheim, Immunovant, Olix Pharmaceuticals, Retinal Solutions, and Saksin LifeSciences unrelated to this work. J.A. and B.D.G. are co-founders of DiceRx. N.K. and D.L.B. are named as inventors on a patent application on non-canonical signaling activity of cGAMP filed by the University of Virginia. The other authors declare no competing interests.

Figures

Fig. 1
Fig. 1. cGAMP activates DNA damage response signaling.
a Schematic of the proposed hypothesis: the catalysis of cGAMP during genomic instability promotes DNA damage response (DDR). b Immunoblots showing the phosphorylation status of DDR signaling proteins H2AX (γH2AX), ATM (pATM), and CHK2 (pCHK2) in THP1 cells stimulated with cGAMP (+) or vehicle (−) for 16 h. Molecular-weight markers (kDa) are indicated to the left of the blots. Quantification of γH2AX, pCHK2, and pATM bands is presented in the bar graph (n = 4 independent experiments; data presented are mean ± s.d.; two-tailed paired t test; *p < 0.05 indicates significance compared to respective groups; ns indicates not significant). c Immunoblots for phosphorylated H2AX (γH2AX), CHK2 (pCHK2), and STAT2 (pSTAT2) in THP1 cells stimulated with vehicle, cGAMP, or signaling incompetent linearized cGAMP (Lin-cGAMP) for 16 h. Bands of interest from representative immunoblots from three independent experiments are shown. d Alkaline comet assay was performed to assess DNA damage in THP1 cells that were mock treated, treated with 2 μM doxorubicin, stimulated with vehicle, or stimulated with cGAMP for 16 h. DNA (green) was visualized by staining with Vista Green DNA Dye. While the comet head is composed of intact DNA, the tail consists of genetic fragments and has a length reflective of the amount of DNA damage the cell has sustained. Representative images are presented. Scale bar = 100 μm. e Comets with n = 28 for Mock, n = 23 for Dox, n = 15 for vehicle, and n = 25 for cGAMP group cells per condition were analyzed using OpenComet; quantification of DNA signal intensity in comet tails as a measure of DNA damage is presented (data presented are mean ± s.d.; two-tailed unpaired t test; *p < 0.05 indicates significance compared to respective groups; ns indicates not significant). f Immunoblots for γH2AX, pCHK2, pSTAT2, and pNF-κB (p-p65) in THP1 stimulated with LPS (500 ng/ml, 6 h) from S. minnesota R595 or cGAMP (16 h). Bands of interest from representative immunoblots from three independent experiments are shown. g Immunoblots show phosphorylated H2AX (γH2AX) and NF-κB (p-p65) in WT primary mouse embryonic fibroblasts stimulated with Pam3CSK4 (500 ng/ml, 6 h) or HT-DNA (4 μg/6 well for 6 h). Bands of interest from representative immunoblots from three independent experiments are shown. h Immunoblots for γH2AX and pSTAT2 in WT primary MEF transfected with 5’ppp-dsRNA (0.5 μg/6 well for 6 h) or cGAMP (16 h). Total H2AX (H2AX), Tubulin, and/or β-actin were used as loading controls for immunoblots, as indicated. Bands of interest from representative immunoblots from three independent experiments are shown.
Fig. 2
Fig. 2. cGAMP-driven DDR signaling requires STING and TBK1 but operates independently of interferon signaling.
a Immunoblots for phosphorylated H2AX (γH2AX), ATM (pATM), CHK2 (pCHK2), and STING in WT and STING−/− THP1 cells treated with vehicle (−) or cGAMP (+) for 16 h. Bands of interest from representative immunoblots from three independent experiments are shown. b Immunoblots for γH2AX, pATM, pCHK2, and TBK1 in control (shSCR) or TBK1 shRNA knockdown (shTBK1) THP1 cells stimulated with vehicle (−) or cGAMP (+) for 16 h. Quantification of pCHK2 bands is presented in the bar graph (n = 3 independent experiments; data presented are mean ± s.d.; two-tailed unpaired t test *p < 0.05 indicates significance compared to respective groups; ns indicates not significant). c Immunoblots for phosphorylated H2AX (γH2AX) and total IRF3 in WT and Irf3−/− primary mouse embryonic fibroblasts mock transfected (−) or transfected with cGAMP (+) for 16 h. Bands of interest from representative immunoblots from three independent experiments are shown. d Immunoblots for phosphorylated H2AX (γH2AX) and CHK2 (pCHK2) in control (shSCR) or shIFNAR1 knockdown THP1 cells stimulated with cGAMP (+) or vehicle (−) for 16 h. Bands of interest from representative immunoblots from three independent experiments are shown. e Immunoblots for phosphorylated H2AX (γH2AX), CHK2 (pCHK2), and STAT2 in control (shSCR) or shSTAT2 knockdown THP1 cells stimulated with cGAMP (+) or vehicle (−) for 16 h. Bands of interest from representative immunoblots from three independent experiments are shown. f Schematic of the experimental design employed to test whether cGAMP-induced paracrine signaling mediates activation of DDR. Supernatants from vehicle- or cGAMP-stimulated WT or STING−/− THP1 cells were collected after 18 h and added to target THP1 cells: shSCR, shIFNAR1, and shSTAT2 for 18 h. These cultures were analyzed by immunoblotting for γH2AX and pSTAT2. g Immunoblots for γH2AX and pSTAT2 in target THP1 cells (shSCR and shIFNAR1) incubated with conditioned media from vehicle- or cGAMP-stimulated WT or STING−/− THP1 cells (experimental design described in f). Bands of interest from representative immunoblots from three independent experiments are shown. h Immunoblots for γH2AX and pSTAT2 in target THP1 cells (shSCR and shSTAT2) incubated with conditioned media from vehicle- or cGAMP-stimulated WT or STING−/− THP1 cells (experimental design described in f). Lysates from cGAMP-stimulated wild type THP1 cells were run alongside test samples as positive controls in g, h. Total H2AX (H2AX), Tubulin, and/or β-actin were used as loading controls for immunoblots as indicated. Bands of interest from representative immunoblots from three independent experiments are shown.
Fig. 3
Fig. 3. cGAS-cGAMP-STING-TBK1 signaling axis promotes DDR signaling induced by genotoxic agents.
a, b Immunoblots for γH2AX and cGAS in whole-cell lysates collected from WT, cGAS–/–, and catalytically inactive mutant cGAS(GS198AA) primary MEF cultures mock treated (−) or treated with doxorubicin (0.5 μM for 2 h) or ionizing radiation (5 Gy for 1 h) (+). Bands of interest from representative immunoblots from three independent experiments are shown. c, d Immunoblots for γH2AX, pATM, pCHK2, and cGAS in WT and cGAS−/− THP1 upon mock treatment (−) and ionizing radiation (5 Gy for 1 h) or camptothecin (2 μM for 4 h) (+) respectively. Quantification of pCHK2 bands is presented in the bar graph (n = 3 independent experiments; data presented are mean ± s.d.; two-tailed paired t test; *p < 0.05 indicates significance compared to respective groups; ns indicates not significant). Bands of interest from representative immunoblots from three independent experiments are shown. e Immunoblots for γH2AX, pATM, and pCHK2 in WT and STING−/− THP1 following Doxorubicin treatment (1 μM for 16 h). f Immunoblots for γH2AX and TBK1 in control (shSCR) or shTBK1 knockdown THP1 cells stimulated with Doxorubicin (1 μM for 16 h). Bands of interest from representative immunoblots from three independent experiments are shown. g Immunoblots for γH2AX, pATM, pCHK2, and TBK1 in control (shSCR) or shTBK1 knockdown THP1 cells following ionizing radiation (+) (5 Gy for 1 h). Bands of interest from representative immunoblots from three independent experiments are shown. h Immunoblots for γH2AX and IRF3 in WT and Irf3−/− primary MEF cells mock treated (−) or treated with doxorubicin (+) (0.5 μM for 2 h). Bands of interest from representative immunoblots from three independent experiments are shown. i, j Immunoblots for γH2AX in whole-cell lysates from shScrambled (shSCR) and shIFNAR1 (i) or shSTAT2 (j) THP1 cells mock treated (−) or treated with doxorubicin (+) (1 μM for 16 h). Total H2AX (H2AX), Tubulin, and/or β-actin were used as loading controls for immunoblots as indicated. Bands of interest from representative immunoblots from three independent experiments are shown.
Fig. 4
Fig. 4. cGAMP does not induce γH2AX foci formation.
a Immunofluorescence of γH2AX in human RPE cells mock treated, exposed to doxorubicin for 2 h, transfected with cGAMP, or incubated with HT-DNA for 6 h, scale bar = 10 μm. Bands of interest from representative immunoblots from three independent experiments are shown. b Quantification of γH2AX cells, each data point represents the percentage of cells with ≥5 foci in a microscopic field (n = 4 number of fields each condition, data presented are mean ± s.d.; two-tailed, unpaired t test; *p < 0.025 indicates significance compared to respective groups; ns indicates not significant; adjustments are made for multiple comparisons). c Immunofluorescence of γH2AX in WT, STING−/−, or shIFNAR THP1 cells stimulated with cGAMP for 16 h, scale bar = 10 μm. Representative images from three independent biological replicates are shown. d Immunofluorescence of γH2AX in WT, STING−/−, or cGAS−/− THP1 cells mock treated (WT only) or treated with doxorubicin, scale bar = 10 μm. e Quantification of γH2AX cells, each data point represents the percentage of cells with ≥5 foci in a microscopic field (n = 4 number of fields each condition, data presented are mean ± s.d.; two-tailed unpaired t test; *p < 0.025 indicates significance compared to respective groups; ns indicates not significant; adjustments are made for multiple comparisons).
Fig. 5
Fig. 5. cGAS-cGAMP-induced TBK1 kinase activity stimulates ATM autophosphorylation.
a Immunoblots for γH2AX, pCHK2, and pATM in THP1 cells pretreated with vehicle or 2 μM TBK1 inhibitor (MRT67307) and then stimulated with cGAMP (+) or vehicle (−) for 16 h. Bands of interest from representative immunoblots from three independent experiments are shown. b Schematic of TBK1 kinase assay. c Endogenous ATM in WT-THP1 cells that were pulled down using immunoprecipitation and used as substrates in kinase assays performed with a recombinant TBK1 protein and radiolabeled γ-ATP. Upper panel shows immunoblot of immunoprecipitated ATM. Lower panel shows autoradiogram of 32P incorporated into beads bound to endogenous ATM. Bands of interest from representative immunoblots from three independent experiments are shown. d Immunoblot showing phosphorylated ATM from the kinase assay reaction using Phospho-ATM (Ser1981) (IP: ATM beads) antibody. Bands of interest from representative immunoblots from three independent experiments are shown. e Immunoblot showing phosphorylated ATM from the kinase assay reaction with recombinant ATM and TBK1 proteins. The immunoblotting was carried out using Phospho-ATM (Ser1981) antibody. Quantification of pATM bands is presented in the bar graph (n = 4 independent experiments; data presented are mean ± s.d.; two-tailed, paired t test; *p < 0.05 indicates significance compared to respective groups; ns indicates not significant). f Immunoblot showing phosphorylated ATM from the kinase assay reaction using recombinant ATM and catalytically active TBK1, kinase-dead TBK1 (kd-TBK1), or heat-killed TBK1 (HK TBK1) as indicated. Bands of interest from representative immunoblots from three independent experiments are shown. g Immunoblot showing phosphorylated ATM from the kinase assay reaction using recombinant ATM and TBK1 in the presence of inhibitors of ATM or TBK1, as indicated. Bands of interest from representative immunoblots from three independent experiments are shown. h Immunoblot showing phosphorylated ATM from the kinase assay reaction entailing incubation of wild-type (wt) or catalytically dead (kd) ATM with recombinant TBK1. Bands of interest from representative immunoblots from three independent experiments are shown. i Immunoblot showing TBK1 enrichment in ATM immunoprecipitate in cells mock treated or treated with CPT 5 μM, etoposide (ETO) 10 μM, or 2 μg cGAMP for 16 h each. WCE is the whole-cell extract. Quantification of pATM bands is presented in the bar graph (n = 3 independent experiments; data presented are mean ± s.d.; *p < 0.0.016, two-tailed paired t test; ns = not significant; adjustments are made for multiple comparisons). j Interaction of ATM and TBK1 shown by Co-IP analysis. ATM and GFP were immunoprecipitated from GFP-positive HEK293 cells using target-specific or isotype antibodies. The resulting bead-bound ATM and GFP complexes were incubated with recombinant TBK1. The beads with immune complexes were washed and immunoblotted to examine for the presence of TBK1. TBK1 was found in complex with ATM but not with GFP. Bands of interest from representative immunoblots from three independent experiments are shown. k Immunofluorescence imaging of γH2AX and TBK1 in U2OS-STING cells mock treated or treated with etoposide 10 μM for 16 h. Representative images from three independent biological replicates are shown.
Fig. 6
Fig. 6. Doxorubicin treatment but not cGAMP signaling promotes nuclear cGAS localization.
a Immunofluorescence of HA-cGAS and γH2AX in MEF cells mock treated or exposed to doxorubicin (2 μM for 6 h), scale bar = 10 μm. Representative images from three independent biological replicates are shown. b Immunoblots for endogenous cGAS, STING, and TBK1 in the cytoplasmic and nuclear fractions of THP1 cells after mock treatment (−) or treatment with doxorubicin (+) (2 μM for 6 h). Tubulin and TBP served as cytoplasmic and nuclear loading controls, respectively. Bands of interest from representative immunoblots from three independent experiments are shown. c Immunoblots for endogenous cGAS in the cytoplasmic and nuclear fractions of THP1 cells after mock treatment (−) or treatment with cGAMP (+) for 16 h. Tubulin and TBP served as cytoplasmic and nuclear loading controls, respectively. Bands of interest from representative immunoblots from three independent experiments are shown. d Immunoblots for phosphorylated and total endogenous TBK1 in the cytoplasmic and nuclear fractions of THP1 cells after mock treatment (−) or treatment with cGAMP (+) for 16 h. Tubulin and TBP served as cytosolic and nuclear loading controls, respectively. Bands of interest from representative immunoblots from three independent experiments are shown. e Immunoblots for DDR signaling proteins H2AX (γH2AX), phosphorylated CHK2 (pCHK2), and endogenous cGAS in WT and cGAS−/− THP1 cells after treating with mock (−) or cGAMP (+) for 16 h. Total H2AX (H2AX) and tubulin serve as internal controls. Bands of interest from representative immunoblots from three independent experiments are shown. f Immunoblot (IB) for γH2AX, ATM, and HA-cGAS of anti-HA or anti-IgG immunoprecipitates (IP) from HA-cGAS-reconstituted cGAS−/− immortalized MEF’s in the presence (+) or absence (−) of doxorubicin (2 μM for 6 h). γH2AX but not ATM was enriched in the cGAS immunoprecipitate. Bands of interest from representative immunoblots from three independent experiments are shown.
Fig. 7
Fig. 7. cGAMP signaling induces G1 arrest and HDR suppression.
a The distribution of WT THP1 cells in the G1, S, and G2 cell cycle phases (BrdU-FITC positivity) 24 h after stimulation with vehicle or cGAMP (n = 5 independent experiments; data presented are mean ± s.d.; two-tailed unpaired t test; *p < 0.05 indicates significance compared to respective groups; ns indicates not significant). Bromodeoxyuridine (BrdU) was added to label cells for 1 h before harvesting. Fixed cells were stained with FITC-conjugated anti-BrdU antibody and 7-AAD for total DNA content. The percentage of cells in each cell cycle phrase is shown; 20,000 cells were counted for FACS analysis. b Representative cell cycle dot plots of WT THP1 cells stimulated with vehicle or cGAMP. c Cell proliferation in human RPE cells and U2OS-STING cells after vehicle or cGAMP treatment (18 h) is measured by EdU incorporation. Cells incubated with EdU for 1 h prior to harvesting were stained for EdU incorporation using a Click-iT EdU assay. The percentages of cells with incorporated EdU as visualized by confocal microscopy are indicated in the graph. Each data point represents the percentage of cells in one image field (n = 5 fields with over 100 cells collectively per condition for hRPE cells; n = 10 fields with over 200 cells collectively per condition for U2OS-STING cells; data presented are mean ± s.d.; two-tailed unpaired t test; *p < 0.05 indicates significance compared to respective groups; ns indicates not significant). d Cell cycle analysis (propidium iodide stain) of WT and STING−/− THP1 cells, 24 h after stimulation with cGAMP or vehicle (n = 4 independent experiments; data presented are mean ± s.d.; two-tailed unpaired t test; *p < 0.05 indicates significance compared to respective groups; ns indicates not significant). e Schematic of the experimental design utilizing a Traffic Light Reporter (TrLR) system in HEK293 cells employed to monitor DSB repair by non-homologous end joining (NHEJ) and HDR. HEK293 cells with stably integrated TrLR (HEK293-TrLR) were mock stimulated or stimulated via cGAMP transfection. Six hours post cGAMP transfection, DSBs were induced via enforced expression of the endonuclease I-SceI with or without GFP donor repair template. Seventy-two hours later, cells were trypsinized and analyzed by flow cytometry for mCherry+ or GFP+ fluorescence, indicative of NHEJ or HDR at the reporter locus, respectively. f Flow cytometric analysis of HEK293-TrLR cells transfected with vehicle/cGAMP expressing I-SceI only or I-SceI with donor. Representative graphs from n = 3 independent experiments are presented. g Quantification of data from f is presented (n = 3 Vehicle+I-SceI, n = 4 cGAMP+I-SceI, n = 5 Vehicle+I-SceI+Donor, and n = 7 cGAMP+I-SceI+Donor, Samples are from independent experiments; data presented are mean ± s.e.m.; two-tailed unpaired t test; *p < 0.05 indicates significance compared to respective groups; ns indicates not significant).
Fig. 8
Fig. 8. cGAMP suppresses CRISPR-Cas9 genome editing.
a GFP-positive HEK293-ACE CRISPR/Cas9 reporter cells were transfected with recombinant Cas9, gRNA, and donor template to repair DNA sequences encoding mutant non-fluorescent mCherry to functional fluorescent mCherry expression cassettes. b The percentages of HEK293-ACE CRISPR/Cas9 reporter cells mock stimulated and stimulated with cGAMP determined to be mCherry positive are presented (n = cell culture replicates, data presented are mean ± s.d.; two-tailed unpaired t test; *p < 0.05 indicates significance compared to respective groups; ns indicates not significant). c The percentages of HEK293-ACE cells stably expressing cGAS and control (empty plasmid) determined by flow cytometry to be mCherry positive are presented (data presented are mean ± s.d., n = 4 cell culture replicates, data presented are mean ± s.d.; two-tailed unpaired t test; *p < 0.05 indicates significance compared to respective groups; ns indicates not significant). d GFP-positive HEK293-ACE CRISPR/Cas9 reporter cells were treated with human recombinant interferon-β (50 ng/ml) and then transfected with recombinant Cas9, gRNA, and donor template to repair DNA sequences encoding mutant non-fluorescent mCherry to functional fluorescent mCherry expression cassettes, followed by flow cytometry. Quantification of flow cytometry data is presented (n = 5 cell culture replicate; data presented are mean ± s.d.; two-tailed unpaired t test; *p < 0.05 indicates significance compared to respective groups; ns indicates not significant). e The Rosa26 locus was edited using CRISPR/Cas9 in WT, cGAS−/−, cGAS(GS198AA), Sting−/−, and Ifnar−/− mouse primary embryonic fibroblasts and subsequently PCR amplified for next-generation sequencing and CRISPResso analysis. The frequency of CRISPR/Cas9-mediated homology-directed repair outcomes in these genotypes are presented (N = 19 for WT, N = 19 for cGAS−/−, N = 17 for cGAS(GS198AA), N = 19 for Sting−/−, and N = 19 for Ifnar−/− cell culture replicates; data presented are mean ± s.d.; two-tailed unpaired t test, no adjustments were made for multiple comparisons; *p < 0.05 indicates significance compared to respective groups; ns indicates not significant). Each data point represents percentage of sequence reads, indicative of HDR, n = 19 cell culture replicates for each genotype. f The frequency of CRISPR/Cas9-mediated genome-editing outcomes in mouse embryos in the presence or absence of cGAMP was determined as described in the schematic (Supplementary Fig. 10c; n = 26 embryos for vehicle, n = 18 embryos for cGAMP; data presented are mean ± s.d.; two-tailed unpaired t test; *p < 0.05 indicates significance compared to respective groups; ns indicates not significant). Each data point represents percentage of sequence reads within the indicated outcomes (Total edits, NHEJ, HDR).
Fig. 9
Fig. 9. HDR-suppressive activity of cGAMP proceeds independently of its effect on cell cycle.
a Immunoblots showing phosphorylated H2AX (γH2AX) and CHK2 (pCHK2) in HEK293 cells that were pretreated with 25 μM ATM inhibitor (KU-55933) for 1 h and then transfected with cGAMP for 16 h. Total H2AX (H2AX) and tubulin serve as internal controls. Bands of interest from representative immunoblots from three independent experiments are shown. b Quantification of flow cytometric analysis of HEK293-TrLR cells pretreated with 25 μM ATM inhibitor (KU-55933) and then transfected with vehicle/cGAMP before being subjected to the expression of I-SceI with donor for 72 h. HDR events (GFP+ cells) are represented as HDR frequency percentages (n = 3 independent experiments, data presented are mean ± s.d.; two-tailed unpaired t test; *p < 0.05 indicates significance compared to respective groups; ns indicates not significant). c Immunofluorescence of RAD51 in EdU+ U2OS-STING cells that were transfected with cGAMP for 6 h, then treated with camptothecin (5 μM for 16 h), scale bar = 10 μm. d Quantification of RAD51 foci in S phase cells, each data point represents the percentage of EdU+ cells with >15 foci in a microscopic field (n = 4 fields with over 100 cells collectively per condition, data presented are mean ± s.d.; two-tailed unpaired t test; *p < 0.05 indicates significance compared to respective groups; ns indicates not significant). e Immunofluorescence of RPA70 in EdU+ U2OS-STING cells that were transfected with cGAMP for 6 h, then treated with camptothecin (5 μM for 16 h), scale bar = 10 μm. f Immunofluorescence and quantification, respectively, of RPA70 foci in EdU+ U2OS-STING cells that were transfected with cGAMP for 6 h followed by camptothecin treatment for (5 μM 16 h), scale bar = 10 μm (n = 4 fields with over 100 cells collectively per condition; data presented are mean ± s.d.; two-tailed unpaired t test *p < 0.05 indicates significance compared to respective groups; ns indicates not significant).
Fig. 10
Fig. 10. cGAMP-induced suppression of polyADP-ribosylation (PARylation) mediates HDR inhibition.
a Immunoblots (IB) for polyADP-ribosylated (PAR) proteins of anti-PARP1 immunoprecipitates (IP) from WT THP1 cells treated with vehicle or cGAMP for 6 h and then challenged with 250 μM H2O2 for 10 min. Bands of interest from representative immunoblots from three independent experiments are shown. b Immunoblot of polyADP-ribosylated proteins (PAR) in WT THP1 cells treated with vehicle or cGAMP followed by 250 μM H2O2 for the indicated time periods. Tubulin served as the loading control. Bands of interest from representative immunoblots from three independent experiments are shown. c Immunoblots of polyADP-ribosylated (PAR) proteins in WT and STING−/− THP1 cells treated with vehicle or cGAMP followed by 250 μM H2O2 for 10 min. β-Actin served as the loading control. d Immunoblots of polyADP-ribosylated (PAR) proteins in WT THP1 cells pretreated with 25 μM ATM inhibitor (KU-55933) or vehicle and then transfected with mock/cGAMP (6 h) and treated with 250 μM H2O2 (+) for 10 min. Tubulin served as the loading control. Bands of interest from representative immunoblots from three independent experiments are shown. e Quantification of flow cytometric analysis of HEK293-TrLR cells pretreated with 10 μM PARP inhibitor (rucaparib) and then transfected with mock/cGAMP (for 6 h) before being subjected to the expression of I-SceI with donor (for 72 h). HDR events (GFP+ cells) are represented as HDR frequency percentages (n = 3 independent experiments, data presented are mean ± s.d.; *two-tailed unpaired t test; *p < 0.016 indicates significance compared to respective groups; ns indicates not significant; adjustments are made for multiple comparisons). f Cellular proliferation was assessed using a CellTiter 96 AQueous One Solution Cell Proliferation Assay of WT THP1 cells. Cells were consecutively pretreated with 10 μM of the PARP inhibitor olaparib or rucaparib (1 h), stimulated with cGAMP (6 h), then exposed to 10 Gy ionizing radiation for 48 h before being tested with the viability assay (n = 10 for mock or 4 for the rest of the groups, samples are from independent biological replicates, data presented are mean ± s.d.; two-tailed unpaired t test; *p < 0.05 indicates significance compared to respective groups; ns indicates not significant). g Cell cycle analysis (propidium iodide stain) of WT THP1 cells pretreated with 10 μM of the PARP inhibitor rucaparib (or vehicle) for 1 h and stimulated with mock or cGAMP for 24 h (n = 4 independent experiments; data presented are mean ± s.d.; two-tailed unpaired t test; *p < 0.05 indicates significance compared to the respective groups; ns indicates not significant). h Immunoblots for phosphorylated ATR (pATR) and CHK1 (pCHK1) in WT-THP1 cells post cGAMP treatment (at the indicated time points) or ionizing radiation (1 h). Tubulin serves as the internal control. Bands of interest from representative immunoblots from three independent experiments are shown.

References

    1. Sun L, Wu J, Du F, Chen X, Chen ZJ. Cyclic GMP-AMP synthase is a cytosolic DNA sensor that activates the type I interferon pathway. Science. 2013;339:786–791. doi: 10.1126/science.1232458. - DOI - PMC - PubMed
    1. Wu J, et al. Cyclic GMP-AMP is an endogenous second messenger in innate immune signaling by cytosolic DNA. Science. 2013;339:826–830. doi: 10.1126/science.1229963. - DOI - PMC - PubMed
    1. Li T, Chen ZJ. The cGAS–cGAMP–STING pathway connects DNA damage to inflammation, senescence, and cancer. J. Exp. Med. 2018;215:1287–1299. doi: 10.1084/jem.20180139. - DOI - PMC - PubMed
    1. Yang H, Wang H, Ren J, Chen Q, Chen ZJ. cGAS is essential for cellular senescence. Proc. Natl Acad. Sci. USA. 2017;114:E4612–E4620. doi: 10.1073/pnas.1705499114. - DOI - PMC - PubMed
    1. Glück S, et al. Innate immune sensing of cytosolic chromatin fragments through cGAS promotes senescence. Nat. Cell Biol. 2017;19:1061. doi: 10.1038/ncb3586. - DOI - PMC - PubMed

Publication types

MeSH terms

Substances