Comparative Study
. 2021 Oct 27;12(1):6201.
doi: 10.1038/s41467-021-26431-4.

Daily caloric restriction limits tumor growth more effectively than caloric cycling regardless of dietary composition

Affiliations
Comparative Study

Daily caloric restriction limits tumor growth more effectively than caloric cycling regardless of dietary composition

Laura C D Pomatto-Watson et al. Nat Commun. .

Abstract

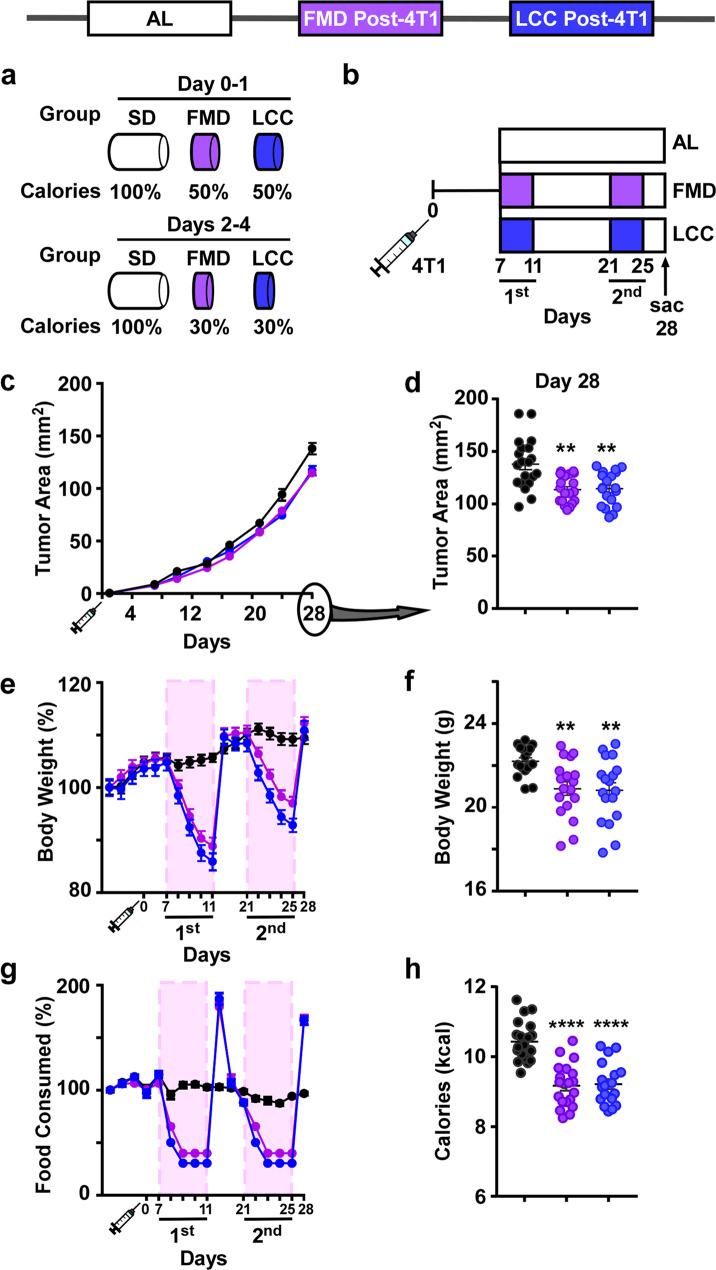
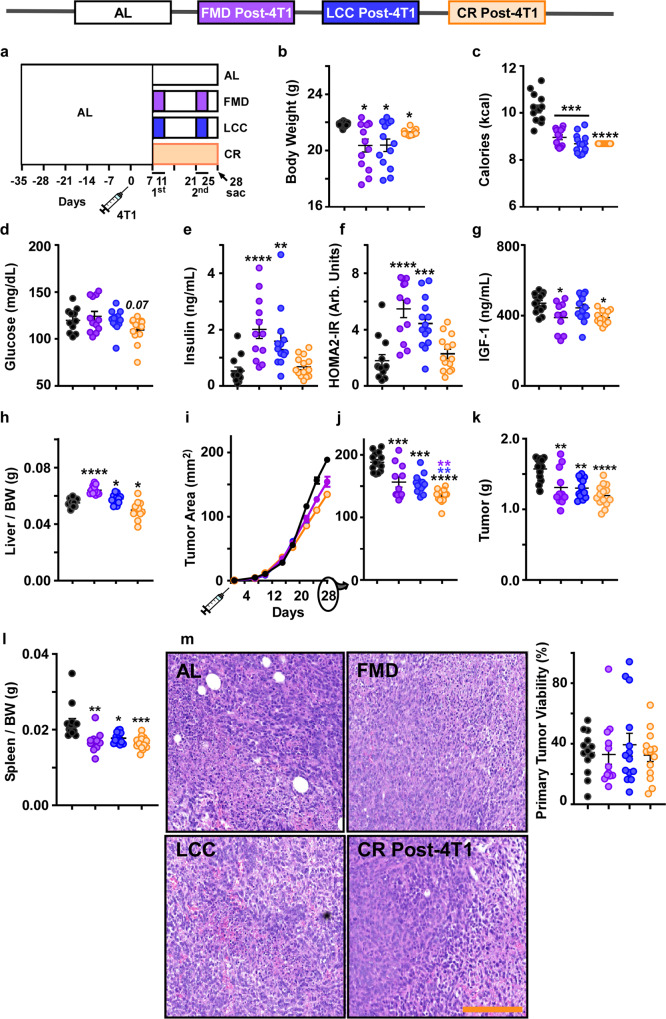
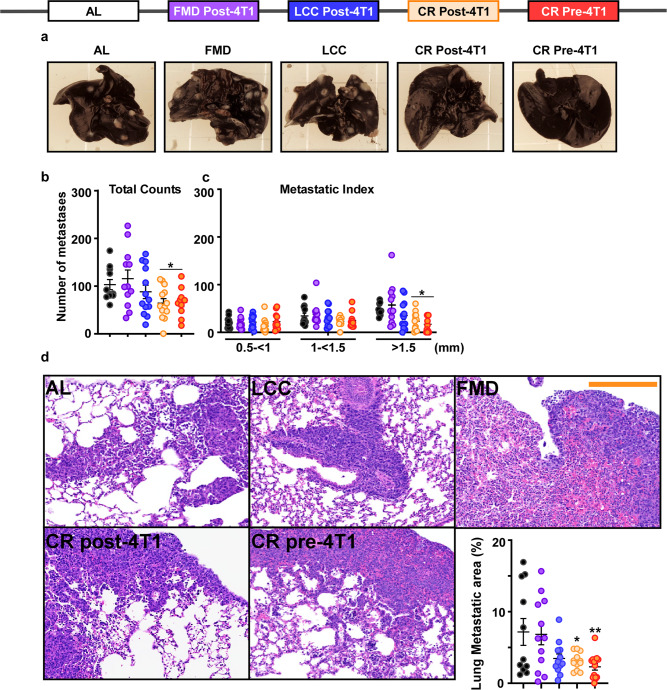
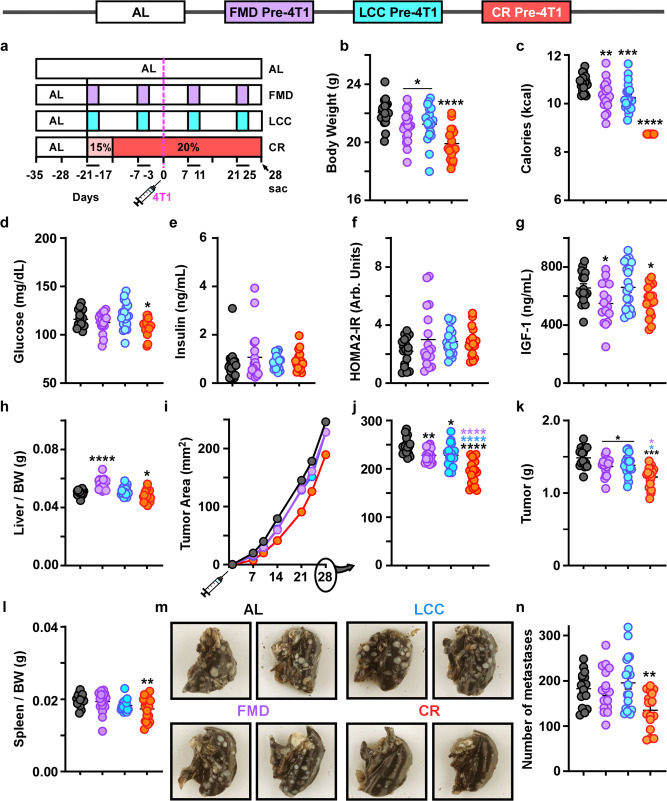
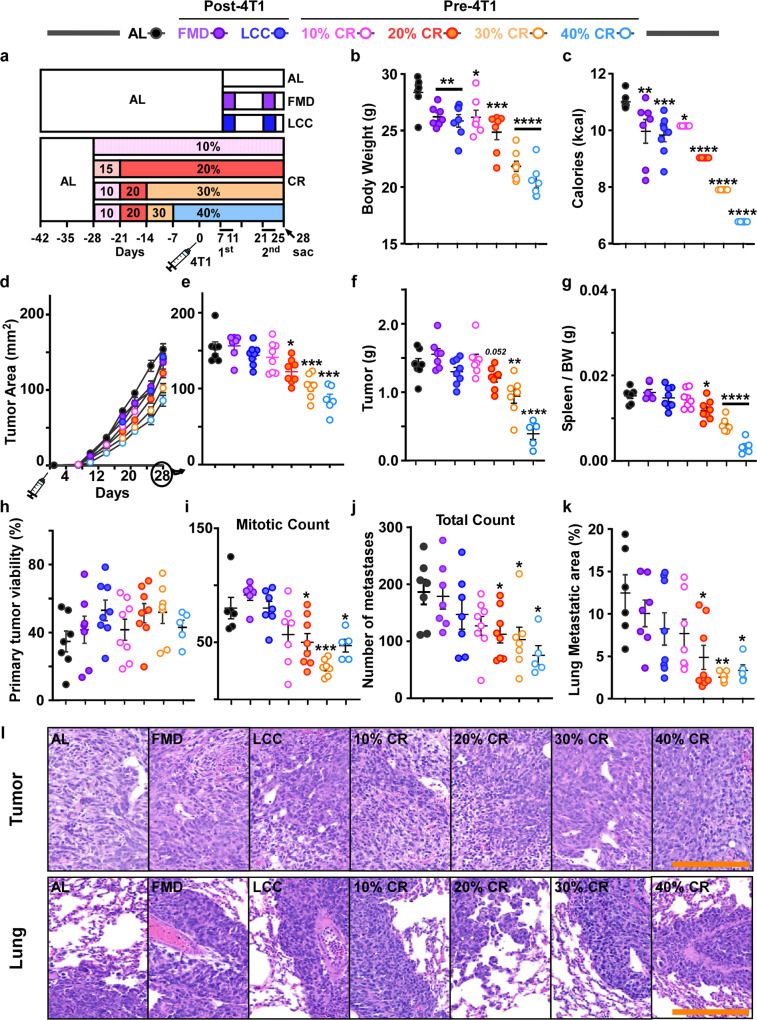
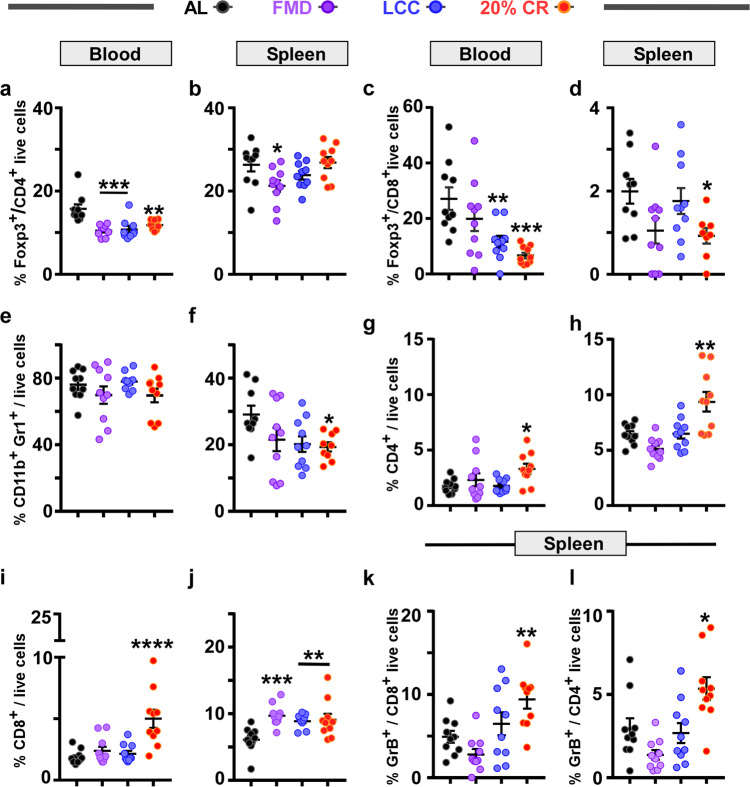
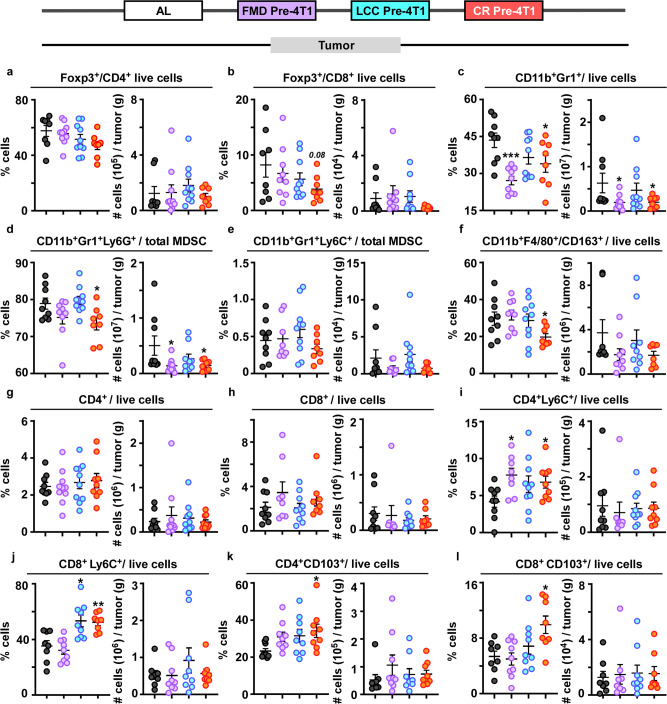
Cancer incidence increases with age and is a leading cause of death. Caloric restriction (CR) confers benefits on health and survival and delays cancer. However, due to CR's stringency, dietary alternatives offering the same cancer protection have become increasingly attractive. Short cycles of a plant-based diet designed to mimic fasting (FMD) are protective against tumorigenesis without the chronic restriction of calories. Yet, it is unclear whether the fasting time, level of dietary restriction, or nutrient composition is the primary driver behind cancer protection. Using a breast cancer model in mice, we compare the potency of daily CR to that of periodic caloric cycling on FMD or an isocaloric standard laboratory chow against primary tumor growth and metastatic burden. Here, we report that daily CR provides greater protection against tumor growth and metastasis to the lung, which may be in part due to the unique immune signature observed with daily CR.


Conflict of interest statement

The experimental FMD diet was provided by L-Nutra, Inc. The funding sources had no involvement in study design; collection, analysis, and interpretation of data; writing of the report; or decision to submit the article for publication. USC has licensed intellectual property to L-Nutra that is under study in this research. As part of this license agreement, the University has the potential to receive royalty payments from L-Nutra. V.D.L. who has equity interest in L-Nutra, did not participate in the collection and analysis of the data. One-hundred percent of V.D.L.’s equity will be assigned to the nonprofit foundation Create Cures. R.S. reports non-financial support from Merck and Bristol Myers Squibb, research support from Merck, Puma Biotechnology, and Roche and personal fees from Roche for an advisory board related to a trial-research project. He has no conflict of interest related to this work. The remaining authors have no competing interest to declare.

Figures

Fig. 1
Fig. 1. Caloric cycling provides protection against primary tumor growth.
a Percent reduction in caloric intake during the ‘ON’ period of the fasting mimicking diet (FMD) and very low-calorie cycle (LCC) regimens (Days 0–4) compared to ad libitum (AL) feeding on standard laboratory chow (SD). b Experimental layout. 7 days after injection with 4T1 breast cancer cells (106 cells/mL) 16-week-old BALB/cJ females were subjected to caloric cycling (FMD or LCC) or maintained on AL. A second round of caloric cycling was performed on days 21–25, after which tissues were collected at day 28. c Growth rate of primary tumors. d Tumor area on day 28. e Percent change in body weight trajectories. f Average body weight during the course of the study. g Percent change in food consumption from baseline. h Average caloric intake. Most of the data are represented as scatter plots with mean values ± SEM. One-way ANOVA with Tukey post hoc analysis was used to determine statistical significance with **p < 0.01, ****p < 0.0001 compared to AL. c–h AL, n = 20; FMD, n = 19; LCC, n = 19 mice per treatment group. Source data are provided as a Source Data file.
Fig. 2
Fig. 2. Daily CR provides greater protection against primary tumor growth than caloric cycling when initiated concurrently.
a Experimental Layout. A post-tumor implantation daily CR-fed group was incorporated into the study. All treatment groups were on ad libitum feeding during injection with 4T1 cells (106 cells/mL) at day 0. One week after injection (day 7), mice underwent 2 rounds of caloric cycling (FMD or LCC) or daily CR until tissue collection at day 28. b Average body weight and c average calorie intake throughout the study. d Blood glucose, e serum insulin levels, f the homeostatic model assessment calculation of insulin resistance (HOMA2-IR), and g serum IGF-1 levels collected at day 28. h Liver mass per unit of body weight. i Growth rates of the primary tumor. j Primary tumor area at day 28. k Tumor mass and l spleen mass per unit of body weight. m Representative images of H&E staining of primary tumors, including both viable and necrotic areas, under different experimental conditions [original magnification ×200] and histological quantification of tumor viability. Scale bar = 100 μm. Most of the data are represented as scatter plots with mean values ± SEM. One-way ANOVA with Tukey post hoc analysis was used to determine statistical significance with *p < 0.05, **p < 0.01, ***p < 0.001, ****p < 0.0001 compared to AL (black), FMD (purple), or LCC (blue). b, c, h–m AL n = 13; FMD, n = 12; LCC, n = 13; CR, n = 13. d-f AL, n = 12; FMD, n = 12; LCC, n = 13; CR, n = 13. g AL n = 13; FMD, n = 10; LCC, n = 13; CR, n = 13 mice per treatment group. Source data are provided as a Source Data file. BW body weight, arb. units arbitrary units.
Fig. 3
Fig. 3. Preventive and therapeutic effect of CR but not caloric cycling in reducing metastatic burden.
a Representative images demonstrating the appearance of white masses in india ink-stained lungs, indicative of metastases. b Macroscopic quantification of lung metastases. c Macroscopically, lung metastases were scored in a blinded fashion and divided into three groups based on size: 0.5 < 1 mm, 1 < 1.15 mm, and >1.5 mm. Large primary tumors have a greater metastatic index. d Representative images and histological quantification of lung metastatic areas [H&E staining, original magnification ×200]. Scale bar = 200 μm. The lung and primary tumors presented in Fig. 2 and Supplementary Fig. 3 for each dietary intervention are from the same mouse. Most of the data are represented as scatter plots with mean values ± SEM. One-way ANOVA with Tukey post hoc analysis was used to determine statistical significance with *p < 0.05 compared to AL. b, c AL, n = 11; FMD post-4T1, n = 12; LCC post-4T1, n = 13; CR post-4T1, n = 13; CR pre-4T1, n = 11. d AL, n = 11; FMD post-4T1, n = 12; LCC post-4T1, n = 12; CR post-4T1, n = 12; CR pre-4T1, n = 13 mice per treatment group. Source data are provided as a Source Data file.
Fig. 4
Fig. 4. Initiation of caloric cycling and daily CR prior to 4T1 implantation slows primary tumor growth.
a Experimental layout. AL-fed BALB/cJ mice began the first cycle of caloric cycling (FMD and LCC) or daily CR concurrently, 21 days prior to 4T1 injection, or remained on AL. Daily CR underwent a stepwise decrease in caloric intake until 20% reduction was achieved. Two cycles of the FMD and LCC feeding regimen were completed prior to 4T1 implantation. b Average body weight and c average calorie intake throughout the study. d Blood glucose, e serum insulin levels, f the homeostatic model assessment calculation of insulin resistance (HOMA2-IR), and g serum IGF-1 levels collected at day 28. h Liver mass per unit of body weight. i primary tumor growth rate and j primary tumor area at day 28. k Tumor mass and l spleen mass per unit body weight. m Representative images demonstrating the appearance of white masses in india ink-stained lungs, indicative of metastases. n Total number of lung metastases. Most of the data are represented as scatter plots with mean values ± SEM. One-way ANOVA with Tukey post hoc analysis was used to determine statistical significance with *p < 0.05, **p < 0.01, ***p < 0.001, ****p < 0.0001 compared to AL (black), FMD (purple), LCC (blue). b, c, h–j, l AL, n = 18; FMD pre-4T1, n = 17; LCC pre-4T1, n = 18; CR pre-4T1, n = 19. d–f AL, n = 18; FMD pre-4T1, n = 17; LCC pre-4T1, n = 18; CR pre-4T1, n = 16. g AL, n = 17; FMD pre-4T1, n = 16; LCC pre-4T1, n = 18; CR pre-4T1, n = 16. k AL, n = 18; FMD pre-4T1, n = 17; LCC pre-4T1, n = 18; CR pre-4T1, n = 18. n AL, n = 16; FMD pre-4T1, n = 16; LCC pre-4T1, n = 17; CR pre-4T1, n = 16 mice per treatment group. Source data are provided as a Source Data file. BW, body weight; arb.units, arbitrary units.
Fig. 5
Fig. 5. Dose-dependent protective effect of daily CR against primary tumor growth in post-reproductive females.
a Experimental layout. AL-fed retired BALB/cJ breeders were randomized to varying degrees of CR (10–40%) using a ramp-down approach. Mice were then injected with 4T1 cells (106 cells/mL) at day 0 and remained on the specified doses of CR until tissue collection at day 28. Another AL-fed group of retired breeders was also injected with 4T1 cells and 7 days later was randomly divided into three groups; mice were maintained either on AL or subjected to two low caloric cycles of FMD or LCC before tissue collection at day 28. b Average body weight during the course of the study. c Average caloric intake. d Growth rates of the primary tumor. e Average tumor area at day 28. f Tumor mass and g spleen mass per unit of body weight (BW). h Histological quantification of primary tumor viability and i mitotic counts. j Macroscopic quantification of lung metastases [india ink-stained lungs]. k Histological quantification of lung metastatic areas. l Representative images of primary tumors (top) and corresponding lungs (bottom) under different experimental conditions [H&E staining, original magnification ×200]. Scale bar = 100 μm. Most of the data are represented as scatter plots with mean values ±  SEM. One-way ANOVA with Tukey post hoc analysis was used to determine statistical significance with *p < 0.05, **p < 0.01, ***p < 0.001, ****p < 0.0001 compared to AL. b, c AL, n = 7; FMD, n = 7; LCC, n = 8; 10% CR, n = 6; 20% CR, n = 7; 30% CR, n = 7; 40% CR, n = 6. d, e AL, n = 7; FMD, n = 7; LCC, n = 8; 10% CR, n = 8; 20% CR, n = 8; 30% CR, n = 7; 40% CR, n = 6. f–h, j AL, n = 7; FMD, n = 7; LCC, n = 8; 10% CR, n = 8; 20% CR, n = 8; 30% CR, n = 7; 40% CR, n = 5. i AL, n = 6; FMD, n = 6; LCC, n = 7; 10% CR, n = 7; 20% CR, n = 8; 30% CR, n = 7; 40% CR, n = 5. k AL, n = 6; FMD, n = 7; LCC, n = 8; 10% CR, n = 7; 20% CR, n = 8; 30% CR, n = 7; 40% CR, n = 5 mice per treatment group. Source data are provided as a Source Data file.
Fig. 6
Fig. 6. Daily CR leads to a unique immune profile in response to 4T1 tumor burden.
Percentage of immune cells detected in the peripheral blood (a, c, e, g, i) and spleen (b, d, f, h, j). a, b Foxp3+CD4+ T regulatory cells; c, d Foxp3+CD8+ T regulatory cells; e, f CD11b+Gr1+ cells (MDSCs); g, h effector CD4+ cells; i, j effector CD8+ cells. k Percentage of GrB+CD8+ cells and l GrB+CD4+ cells in the spleen. The data is represented as scatter plots showing mean values ± SEM. One-way ANOVA with Tukey post hoc analysis was used to determine statistical significance with *p < 0.05, **p < 0.01, ***p < 0.001, ****p < 0.0001 compared to AL.a AL, n = 10; FMD, n = 9; LCC, n = 10; CR, n = 10. b, c, e, g-l AL, n = 10; FMD, n = 10; LCC, n = 10; CR, n = 10. d AL, n = 9; FMD, n = 10; LCC, n = 10; CR, n = 8. f AL, n = 9; FMD, n = 10; LCC, n = 10; CR, n = 9 mice per treatment group. Source data are provided as a Source Data file.
Fig. 7
Fig. 7. Immunological remodeling in the tumor microenvironment.
Frequency (%) (left) and cell count per gram of tumor (#) (right) of immune cells identified in the primary tumor collected from mice undergoing dietary regimens initiated prior to 4T1 implantation (Fig. 4). a Foxp3+CD4+ T regulatory cells; b Foxp3+CD8+ T regulatory cells; and c CD11b+Gr1+ cells (MDSCs). MDSC subset detected in the primary tumor, d CD11b+Gr1+Lys6G+ (granulocytic-MDSCs), and e CD11b+Gr1+Lys6C+ (monocytic-MDSCs). f CD11b+F480+CD163+ immunosuppressive cells. g Effector CD4+ and h effector CD8+ cells. i CD4+Lys6C+ cells and j CD8+Lys6C+ cells. k CD4+CD103+ cells and l CD8+CD103+ cells. Scatter plots represent mean values ± SEM. One-way ANOVA with Tukey post hoc analysis was used to determine statistical significance with *p < 0.05, **p < 0.01, ***p < 0.001. a AL, n = 8; FMD pre-4T1, n = 10; LCC pre-4T1, n = 10; CR pre-4T1, n = 8. b AL, n = 8; FMD pre-4T1, n = 9; LCC pre-4T1, n = 10; CR pre-4T1, n = 8. c, d, f AL, n = 9; FMD pre-4T1, n = 9; LCC pre-4T1, n = 10; CR pre-4T1, n = 8. e AL, n = 9; FMD pre-4T1, n = 8; LCC pre-4T1, n = 10; CR pre-4T1, n = 8. g AL, n = 9; FMD pre-4T1, n = 10; LCC pre-4T1, n = 10; CR pre-4T1, n = 9. h AL, n = 9; FMD pre-4T1, n = 8; LCC pre-4T1, n = 10; CR pre-4T1, n = 8. i AL, n = 9; FMD pre-4T1, n = 8; LCC pre-4T1, n = 10; CR pre-4T1, n = 9. j, l AL, n = 8; FMD pre-4T1, n = 9; LCC pre-4T1, n = 9; CR pre-4T1, n = 8. k AL, n = 9; FMD pre-4T1, n = 9; LCC pre-4T1, n = 9; CR pre-4T1, n = 9 mice per treatment group. Source data are provided as a Source Data file.

References

    1. Ingram DK, de Cabo R. Calorie restriction in rodents: caveats to consider. Ageing Res. Rev. 2017;39:15–28. doi: 10.1016/j.arr.2017.05.008. - DOI - PMC - PubMed
    1. Di Francesco A, Di Germanio C, Bernier M, de Cabo R. A time to fast. Science. 2018;362:770–775. doi: 10.1126/science.aau2095. - DOI - PMC - PubMed
    1. Mitchell SJ, et al. Daily fasting improves health and survival in male mice independent of diet composition and calories. Cell Metab. 2019;29:221–228.e223. doi: 10.1016/j.cmet.2018.08.011. - DOI - PMC - PubMed
    1. Acosta-Rodríguez VA, de Groot MH, Rijo-Ferreira F, Green CB, Takahashi JS. Mice under caloric restriction self-impose a temporal restriction of food intake as revealed by an automated feeder system. Cell Metab. 2017;26:267–277. e262. doi: 10.1016/j.cmet.2017.06.007. - DOI - PMC - PubMed
    1. Lv M, Zhu X, Wang H, Wang F, Guan W. Roles of caloric restriction, ketogenic diet and intermittent fasting during initiation, progression and metastasis of cancer in animal models: a systematic review and meta-analysis. PLoS ONE. 2014;9:e115147–e115147. doi: 10.1371/journal.pone.0115147. - DOI - PMC - PubMed

Publication types

LinkOut - more resources