. 2021 Oct 27;11(1):21174.
doi: 10.1038/s41598-021-99548-7.

Socioeconomic differences and persistent segregation of Italian territories during COVID-19 pandemic

Affiliations

Socioeconomic differences and persistent segregation of Italian territories during COVID-19 pandemic

Giovanni Bonaccorsi et al. Sci Rep. .

Abstract

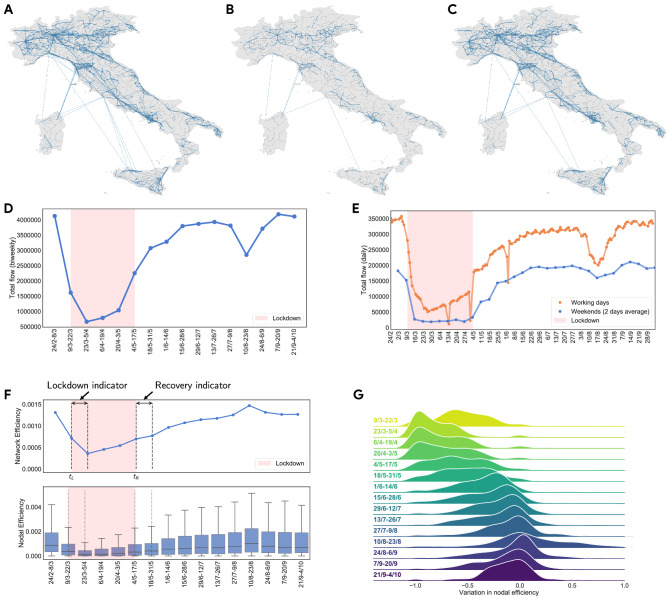
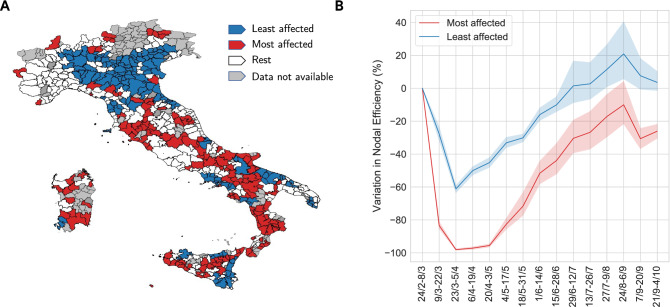
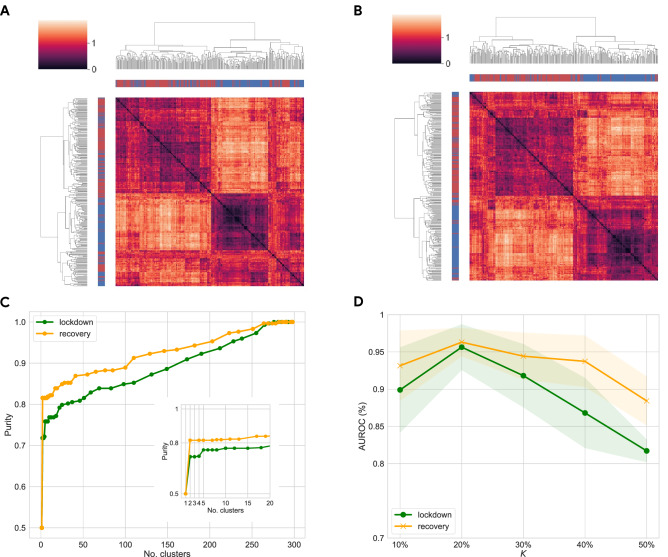
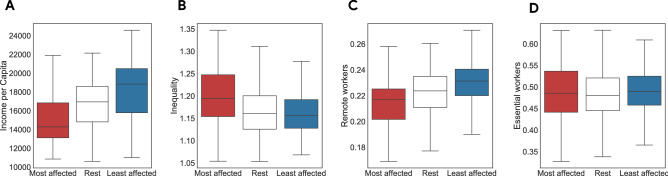
Lockdowns implemented to address the COVID-19 pandemic have disrupted human mobility flows around the globe to an unprecedented extent and with economic consequences which are unevenly distributed across territories, firms and individuals. Here we study socioeconomic determinants of mobility disruption during both the lockdown and the recovery phases in Italy. For this purpose, we analyze a massive data set on Italian mobility from February to October 2020 and we combine it with detailed data on pre-existing local socioeconomic features of Italian administrative units. Using a set of unsupervised and supervised learning techniques, we reliably show that the least and the most affected areas persistently belong to two different clusters. Notably, the former cluster features significantly higher income per capita and lower income inequality than the latter. This distinction persists once the lockdown is lifted. The least affected areas display a swift (V-shaped) recovery in mobility patterns, while poorer, most affected areas experience a much slower (U-shaped) recovery: as of October 2020, their mobility was still significantly lower than pre-lockdown levels. These results are then detailed and confirmed with a quantile regression analysis. Our findings show that economic segregation has, thus, strengthened during the pandemic.


Conflict of interest statement

The authors declare no competing interests.

Figures

Figure 1
Figure 1
(AC) Snapshots of Italian mobility during three distinct windows of 14-day, 24/2-8/3, 23/3-5/4, and 15/6-29/6, chosen to capture the pre-lockdown, lockdown, and recovery periods, respectively. Nodes represent LLMs and edges represent mobility flows between two locations, with thickness proportional to their weight. Figures created with Python (version 3.7.4) using networkx package (version 2.6.2). (D) Temporal evolution of the total number of individuals moving between LLMs, aggregated over windows of 14 days. (E) Temporal evolution of the total number of individuals moving between LLMs daily, separating working days from weekends. (F) Temporal evolution of the global network efficiency (top) and the distribution of nodal efficiency (bottom). We also annotate the periods in which we computed the two performance indicators, respectively Lockdown and Recovery. (G) Kernel density estimation of the distribution of relative variation (%) in nodal efficiency for each window w.r.t. the baseline (24/2-8/3).
Figure 2
Figure 2
(A) Most (red) and least (blue) affected LLMs identified using the lockdown indicator and K=30%. White color indicates remaining 40% of LLMs in the data, whereas grey indicates LLMs not present in our data. Figure created with Python (version 3.7.4) using networkx package (version 2.6.2). (B) Temporal evolution of variation in nodal efficiency, w.r.t. baseline (24/2-8/3), for the most (red) and the least (blue) affected LLMs, identified using lockdown indicator and K=30%. Solid lines show mean values with 95% confidence interval (dashed area). We excluded from the plot the period corresponding to Assumption (10/8-23/8).
Figure 3
Figure 3
(A, B) Results of hierarchical clustering using features of the most and the least affected LLMs identified with lockdown (A) and recovery (B) indicators, with K=30%. Red and blue labels of rows and columns identify respectively the most and the least affected areas. (C) Plot of purity score vs number of clusters for lockdown (green) and recovery (orange) dendrograms, shown respectively in panels (A) and (B). In the recovery phase, the two classes are more homogeneous and better separated, as indicated by purity scores higher compared to the lockdown period. This might signal that the effects of lockdown were more uniformly applied among LLMs, whereas recovery dynamics present more heterogeneity which allows us to better identify the most and the least affected territories. (D) Area under the Receiving Operator characteristic Curve (AUROC) for a Random Forest classifier evaluated on features of the most and the least affected LLMs, using lockdown (green) and recovery (orange) indicators and different values of K to obtain the binary label. Note the best performance for K = 20%, with AUROC values around 95% for both indicators. Similar to panel (C), we observe in general better results when identifying the most and the least affected LLMs during the recovery phase.
Figure 4
Figure 4
(AD) Distributions of socioeconomic features for the most (red) and the least (blue) affected LLMs, and remaining ones (white), identified using lockdown variable and K=30%. For variables in panels (AC), the Kruskal–Wallis test to assess statistical differences between the distributions of the classes of LLMs is significant at a level α=0.001. For the variable in panel (D), it is not significant. According to the pairwise multiple comparison tests with Conover procedure and Bonferroni correction for p-values, distributions are statistically different at a level α=0.01 in all cases for variables in panels (AC), with the following exceptions: in panel (B), there is no significant difference between Rest and Least; in panel (C) the difference between Rest and Least is significant at a level α=0.05.

References

    1. Davies NG, et al. Effects of non-pharmaceutical interventions on COVID-19 cases, deaths, and demand for hospital services in the UK: A modelling study. Lancet Public Health. 2020 doi: 10.1016/S2468-2667(20)30133-X. - DOI - PMC - PubMed
    1. Flaxman S, et al. Estimating the effects of non-pharmaceutical interventions on COVID-19 in Europe. Nature. 2020 doi: 10.1038/s41586-020-2405-7. - DOI - PubMed
    1. Li Y, et al. The temporal association of introducing and lifting non-pharmaceutical interventions with the time-varying reproduction number (R) of SARS-CoV-2: A modelling study across 131 countries. Lancet Infect. Dis. 2020 doi: 10.1016/S1473-3099(20)30785-4. - DOI - PMC - PubMed
    1. Maier BF, Brockmann D. Effective containment explains subexponential growth in recent confirmed COVID-19 cases in China. Science. 2020;368:742–746. doi: 10.1126/science.abb4557. - DOI - PMC - PubMed
    1. Dehning J, et al. Inferring change points in the spread of COVID-19 reveals the effectiveness of interventions. Science. 2020 doi: 10.1126/science.abb9789. - DOI - PMC - PubMed