. 2021 Nov;599(7883):136-140.
doi: 10.1038/s41586-021-04025-w. Epub 2021 Oct 27.

SLC25A39 is necessary for mitochondrial glutathione import in mammalian cells

Affiliations

SLC25A39 is necessary for mitochondrial glutathione import in mammalian cells

Ying Wang et al. Nature. 2021 Nov.

Abstract

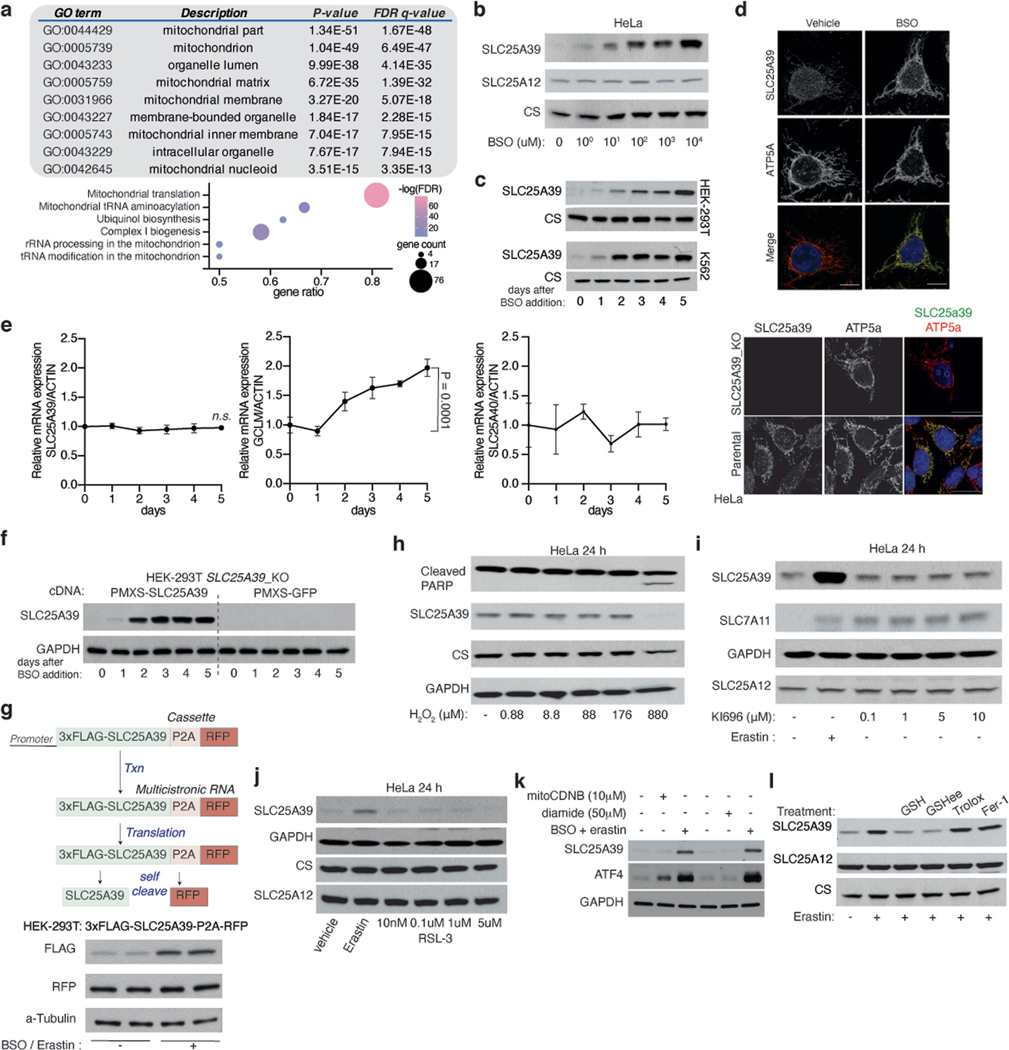
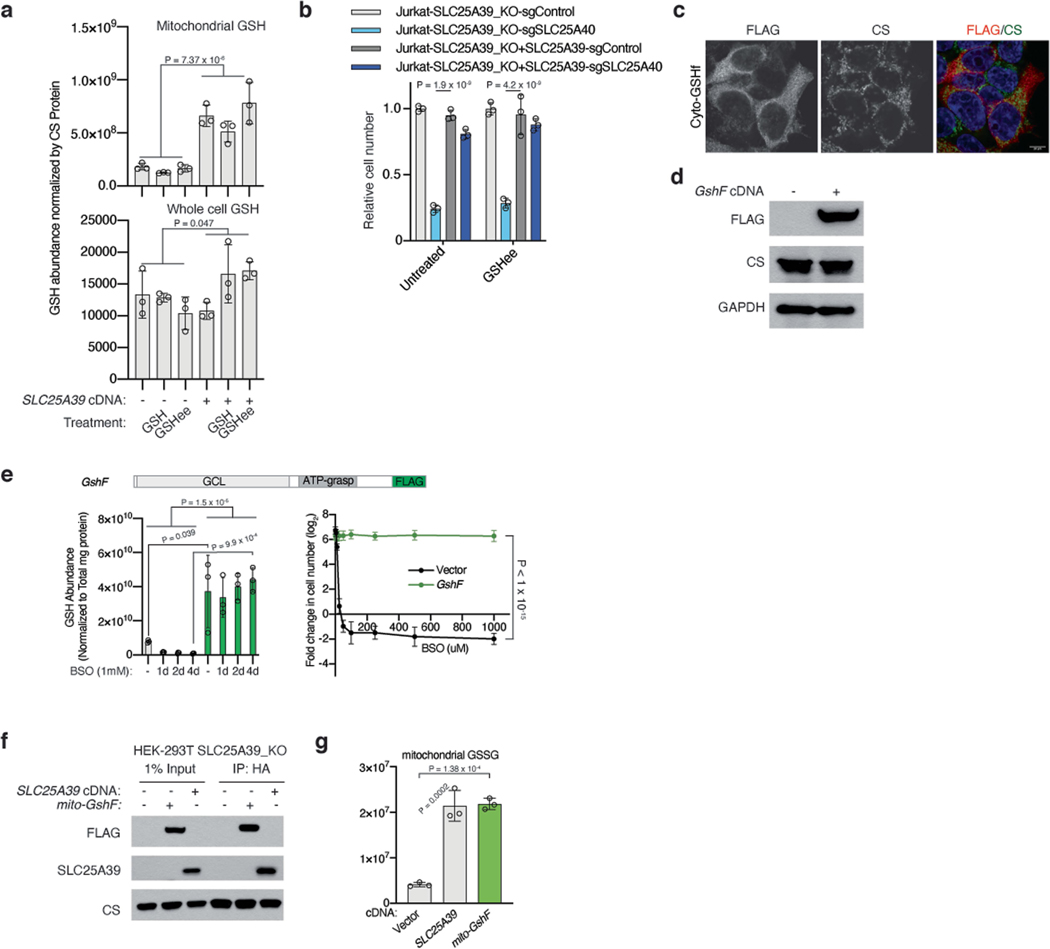
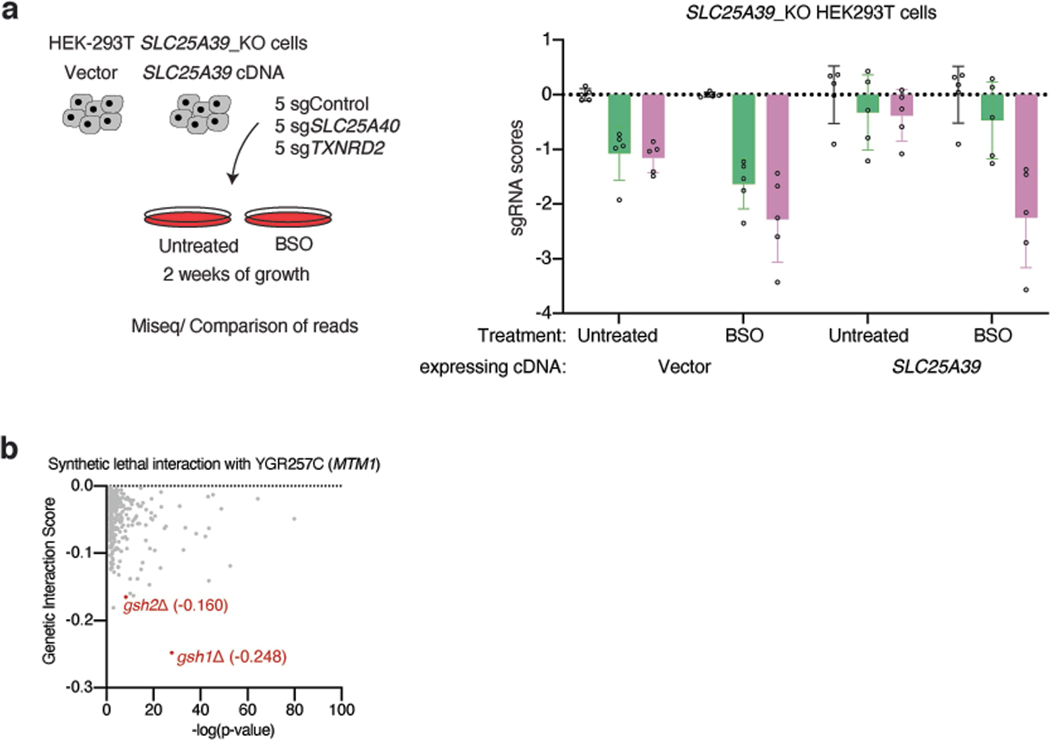
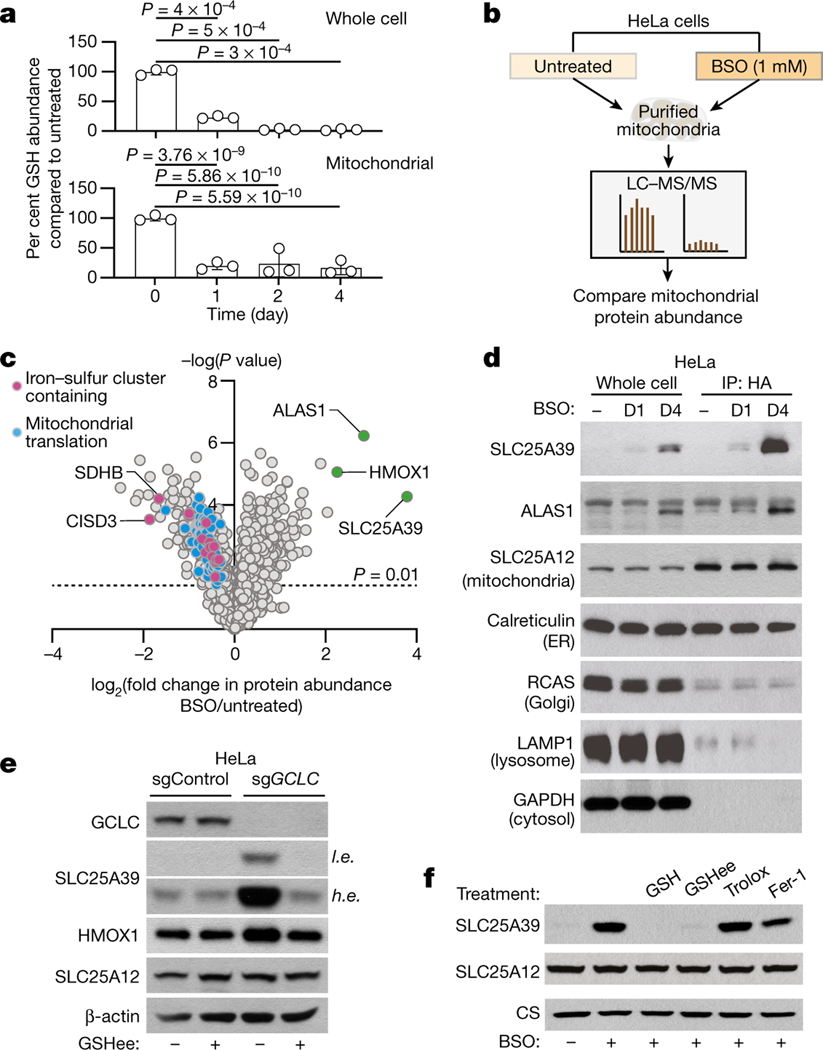
Glutathione (GSH) is a small-molecule thiol that is abundant in all eukaryotes and has key roles in oxidative metabolism1. Mitochondria, as the major site of oxidative reactions, must maintain sufficient levels of GSH to perform protective and biosynthetic functions2. GSH is synthesized exclusively in the cytosol, yet the molecular machinery involved in mitochondrial GSH import remains unknown. Here, using organellar proteomics and metabolomics approaches, we identify SLC25A39, a mitochondrial membrane carrier of unknown function, as a regulator of GSH transport into mitochondria. Loss of SLC25A39 reduces mitochondrial GSH import and abundance without affecting cellular GSH levels. Cells lacking both SLC25A39 and its paralogue SLC25A40 exhibit defects in the activity and stability of proteins containing iron-sulfur clusters. We find that mitochondrial GSH import is necessary for cell proliferation in vitro and red blood cell development in mice. Heterologous expression of an engineered bifunctional bacterial GSH biosynthetic enzyme (GshF) in mitochondria enables mitochondrial GSH production and ameliorates the metabolic and proliferative defects caused by its depletion. Finally, GSH availability negatively regulates SLC25A39 protein abundance, coupling redox homeostasis to mitochondrial GSH import in mammalian cells. Our work identifies SLC25A39 as an essential and regulated component of the mitochondrial GSH-import machinery.


Conflict of interest statement

Competing interests K.B. is scientific advisor to Nanocare Pharmaceuticals and Barer Institute.

Figures

Extended Data Fig. 1 |
Extended Data Fig. 1 |. SLC25A39 protein levels are directly regulated by cellular GSH availability.
a, Gene enrichment analysis (Gorilla) for proteomics data from the immunopurified mitochondria of HeLa cells (top). Gene ontology analysis of proteins altered by BSO treatment (bottom). Log (FDR), log false discovery rate (bottom). Statistical significance was determined by Fisher’s exact or binomial distribution test. b, Immunoblot of SLC25A39, SLC25A12 and CS in HeLa cells treated with the indicated doses of BSO for 24 h. CS was used as the loading control. c, Immunoblot of indicated proteins in HEK-293T (top) and K562 (bottom) cells treated with BSO (1 mM;10 μM, respectively) for the indicated days. CS and GAPDH were used as loading controls. d, Immunofluorescence analysis of indicated proteins in HeLa cells treated with vehicle or BSO (1 mM) for 24 h. Micrographs are representative images. Scale bar, 10 μm (top). Immunofluorescence analysis of SLC25A39 in parental and SLC25A39 knockout HeLa cells treated with BSO (1 mM) and erastin (5 uM) for 24 h (bottom). Micrographs are representative images of three independent experiments. Scale bar, 20 μm. e, Relative abundance of SLC25A39, GCLM and SLC25A40 transcripts in HEK-293T cells treated with BSO (1 mM) for the indicated days using quantitative reverse transcription PCR (RT-qPCR), normalized to transcripts of β-ACTIN. Error bars represent mean ± s.d.; n = 3 biologically independent samples. Statistical significance was determined by one-way ANOVA followed by Bonferroni post-hoc analysis. f, Immunoblot of indicated proteins in HEK-293T SLC25A39 knockout cells expressing a vector control or SLC25A39 cDNA treated with BSO (1 mM) for the indicated times. GAPDH was used as the loading control. g, The design of 3xFLAG- SLC25A39-P2A-RFP construct (top). Immunoblot of indicated proteins in HEK-293T cells expressing 3xFLAG- SLC25A39-P2A-RFP treated with BSO (1 mM) and erastin (5 μM) for 48 h (bottom). α-Tubulin was used as the loading control. h, Immunoblot of indicated proteins in HeLa cells treated with indicated doses of H2O2 for 24 h. CS and GAPDH were used as loading controls. i, Immunoblot of indicated proteins in HeLa cells treated with erastin (5 μM) or indicated doses of KI696 (NRF2 activator) for 24 h. GAPDH were used as loading controls. j, Immunoblot of indicated proteins in HeLa cells treated with erastin (5 μM) or indicated doses of RSL-3, an inhibitor of glutathione peroxidase 4 (GPX4), for 24 h. CS was used as a loading control. k, Immunoblot of SLC25A39 and ATF4 proteins in HeLa cells treated with indicated doses of mitoCDNB, diamide and BSO (1 mM)/erastin (5 μM) for 24 h. GAPDH was used as loading control. l, Immunoblot of indicated proteins in HeLa cells treated with erastin (5 μM) and co-treated with either GSH (10 mM), GSHee (10 mM), Trolox (50 μM) or Ferrostatin-1 (5 μM) for 48 h. CS was used as a loading control. GSHee, glutathione ethyl ester.
Extended Data Fig. 2 |
Extended Data Fig. 2 |. Mitochondrial GSH import is mediated by SLC25A39.
a, Volcano plots showing the fold change in mitochondrial metabolite abundance (log2) versus P values (-log) from K562 and HEK-293T SLC25A39 knockout cell lines expressing a vector control or SLC25A39 cDNA. Red data points highlight GSH and GSSG. The dotted line represents P = 0.05. Statistical significance was determined by multiple two-tailed unpaired t-tests with correction for multiple comparisons using the Holm-Šídák method. b, Immunoblot of indicated proteins in whole cell lysates and mitochondria isolated from HEK-293T (top) and HeLa (bottom) SLC25A39 knockout cells expressing a vector control or SLC25A39 cDNA. c, Mitochondrial GSH and GSSG abundance (top and middle panels) and total intracellular GSH levels in HEK-293T parental or SLC25A39 knockout cells expressing a vector control or SLC25A39 cDNA. Data are normalized by citrate synthase (CS) protein levels. d, Uptake of indicated concentrations of [13C2,15N]-GSH into mitochondria isolated from parental HEK-293T mitotag cells for 10 min. Data are normalized to the NAD+ abundance. e, Uptake of indicated concentrations of [13C2,15N]-GSH or GSH into mitochondria isolated from parental HEK-293T mitotag cells for 10 min. Data are normalized to the NAD+ abundance. f, Uptake of [13C2,15N]-GSH (5 mM, top) or [13C4,15N2]-GSSG (0.5 mM, bottom) into mitochondria isolated from HEK-293T SLC25A39 knockout cells expressing a vector control or SLC25A39 cDNA for 10 min. Data are normalized by citrate synthase (CS) protein levels. g, Uptake of [13C2,15N]-GSH (5 mM) into mitochondria isolated from HEK-293T SLC25A39 knockout cells expressing SLC25A39 cDNA for 10 min in the presence or absence of DTT (100 mM). Data are normalized by citrate synthase (CS) protein levels. h, Mitochondrial GSH abundance in HeLa SLC25A39 knockout cells expressing indicated cDNAs (top). Data are normalized by citrate synthase (CS) protein levels. Immunoblot of indicated proteins in HeLa SLC25A39 knockout cells expressing indicated cDNAs (bottom). α-Tubulin was used as a loading control. c, d, e, f, g, h, Bars represent mean ± s.d.; a, c, d, e, f, g, h, n = 3 biologically independent samples. Statistical significance in c, d, f, g and h was determined by one-way ANOVA followed by Bonferroni post-hoc analysis; a, e by two-tailed unpaired t-test.
Extended Data Fig. 3 |
Extended Data Fig. 3 |. SLC25A40, the mammalian paralog for SLC25A39 can compensate SLC25A39 loss.
a, Individual sgRNA scores of SLC25A40 and TXNRD2 from the CRISPR screens in indicated cell lines from Fig. 3b. b, CRISPR gene scores in indicated SLC25A39 knockout HEK-293T cells expressing a vector control or SLC25A39 cDNA. SLC25A40 data point is highlighted in blue (top). Top 15 scoring genes differentially required for the proliferation of HEK-293T SLC25A39 knockout cells (bottom). c, Phylogenetic tree of SLC25A39 homologs across model organisms. d, Top ranked (z-scores) co-evolved genes with SLC25A40 across species. e, Relative conservation of SLC25A40 and SLC25A39 in different species compared to their human homologs. f, Representative bright-field micrographs of Jurkat SLC25A39 knockout cells transduced with the indicated sgRNA at the end of the cell proliferation assay. Scale bar, 50 μm (right). g, Relative fold change in cell number of the indicated HEK-293T SLC25A39 knockout cells expressing a vector control or SLC25A39 cDNA transduced with the indicated sgRNAs. Cells were cultured for 4 days (mean ± SD, n = 3). Cell doublings were normalized to the average of the SLC25A39 knockout cells expressing SLC25A39 cDNA. Statistical significance was determined by one-way ANOVA followed by Bonferroni post-hoc analysis. h, Volcano plots of the fold change in mitochondrial metabolite abundance (log2) versus P values (-log) from HEK-293T SLC25A39 knockout cell line expressing a vector control or SLC25A40 cDNA. Red data points highlight GSH and GSSG. The dotted line represents P = 0.05. i, Immunoblot of indicated proteins in HEK-293T cells expressing an SLC25A40 cDNA in the presence or absence of BSO. CS and β-actin were used as loading controls.
Extended Data Fig. 4 |
Extended Data Fig. 4 |. Expression of S.thermophilus GshF can modulate cellular GSH levels in mammalian cells.
a, Mitochondrial abundance of GSH in HEK-293T SLC25A39 knockout cells expressing a vector control or SLC25A39 cDNA treated with GSH (5 mM) or GSHee (5 mM) for 24 h. Data are normalized by CS protein levels. b, Relative cell number of indicated SLC25A39 knockout Jurkat cells transduced with indicated sgRNAs. Cells were cultured for 4 days with or without GSHee (10 mM). Cell numbers were normalized to the average of the SLC25A39 knockout cells in each treatment condition. c, Immunofluorescence analysis of GshF (FLAG, red) and CS (green) in HeLa cells. Micrographs are representative images. Scale bar, 20 μm. d, Immunoblots of indicated proteins in HEK-293T cells expressing a vector control or GshF cDNA. GAPDH was used as the loading control. e, Schematic of engineered GshF construct for mammalian expression and the domains of the protein with GCL and GS function (top). Whole cell GSH abundance (bottom left) and fold change in cell number (log2) of HEK-293T cells expressing a vector control or engineered GshF cDNA treated with indicated BSO concentrations for 5 days (bottom right). f, Immunoblot analysis of indicated proteins in whole-cell lysates and mitochondria isolated from SLC25A39 knockout HEK-293T cells expressing a vector control, mito-GshF or SLC25A39 cDNA. g, Mitochondrial abundance of GSSG in HEK-293T SLC25A39 knockout cells transduced with the indicated cDNAs. Data are normalized by CS protein levels. a, b, e, g Bars represent mean ± s.d.; a, b, e, g n = 3 biologically independent samples. Statistical significance in a, g were determined by one-way ANOVA followed by Bonferroni post-hoc analysis; b, e were determined by two-way ANOVA followed by Bonferroni post-hoc analysis.
Extended Data Fig. 5 |
Extended Data Fig. 5 |. Mitochondrial GSH depletion sensitizes cells to BSO treatment.
a, Scheme of the in vitro sgRNA competition assay performed in HEK-293T SLC25A39 knockout cells expressing a vector control or SLC25A39 cDNA transduced with a pool of 5 control sgRNAs (sgControl, gray) and sgRNAs targeting TXNRD2 (pink) and SLC25A40 (green) (left). Differential guide scores in the indicated cell lines upon treatment with 20 μM BSO (right). Bars represent mean ± s.d. b, Synthetic lethal genetic interactions of mtm1 with other genes in S. cerevisiae.
Extended Data Fig. 6 |
Extended Data Fig. 6 |. Slc25a39 is essential for embryonic development and red cell differentiation in vivo.
a, Targeting scheme for Slc25a39 knockout mice. b, Gross appearance of E12.5 embryos of the indicated genotypes. Genotyping of Slc25a39 E12.5 embryos from heterozygous mating. PCR of wild type allele and targeted allele result in ~1,500bp and ~800bp bands, respectively (left). The number of viable pups with indicated genotypes is shown (right). c, Targeting scheme for Slc25a39 conditional knockout (Slc25a39fl/fl) mice in which two loxp sites were inserted in the indicated intronic regions. The resultant Slc25a39fl/fl mice were mated with erythroid-lineage specific Cre-recombinase (ErGFP-cre) mice to generate an erythroid-specific conditional knockout mice. d, The number of viable pups with indicated genotypes is shown resulting from the indicated mating. e, Representative images of H&E staining of fetal liver cells from E12.5 Slc25a39fl/fl and ErGFP-cre+/− Slc25a39fl/fl embryos. The bottom images are the boxed area of the top images. Arrows show that many haematopoietic cells in the fetal liver display nuclear fragmentation and cellular shrinkage. Bars, 50 μm (top panel), 12.5 μm (bottom panel). f, Percent of Prussian blue positive peripheral blood cells from indicated E12.5 embryos (top). Representative images of Prussian blue staining of indicated E12.5 whole embryo sections (bottom). Blue and orange arrows indicate blood cells in developing heart with negative or positive staining, respectively. Bar, 360 μm. g, Gating strategy and quantification of erythroblast populations at different differentiation stages using surface markers: Ter119 and CD44, and FSC (size). Percentage of cells of indicated populations among total fetal liver cells (left). Gating strategy (right). n = 3, ErGFP-cre+/− Slc25a39fl/fl; n = 4 Slc25a39fl/fl embryos. h, Profiling of cells of myeloid lineage (top), myeloid progenitor cells (middle) and lymphoid lineage (bottom). Data are presented as the population among total fetal liver cells. E12 embryos: n = 12 Slc25a39fl/fl or Slc25a39fl/-, n = 7 ErGFP-cre+/− Slc25a39fl/-, n = 4 ErGFP-cre+/− Slc25a39fl/fl. i, Relative RPKM values of SLC25A39, FTL and HBB genes in human erythroblasts at differing stages of terminal differentiation. f, g and h, Bars represent mean ± s.d.; statistical significance in f and h was determined by one-way ANOVA followed by Bonferroni post-hoc analysis; g was determined by two-tailed unpaired t-test.
Extended Data Fig. 7 |
Extended Data Fig. 7 |. Loss of SLC25A39/40 decreases the steady state levels of iron-sulfur containing proteins and phenocopies iron-sulfur cluster deficiency.
a, Comparison of proteomics data from BSO treated HeLa cells and SLC25A39/40 double knockout Jurkat cells. The criteria are indicated on the Venn diagram. b, Gene ontology analysis of significantly downregulated genes in SLC25A39/40 double knockout Jurkat cells. FDR, false discovery rate. c, Immunoblot of indicated proteins in the indicated HEK-293T SLC25A39 knockout cells expressing a vector control or SLC25A39 cDNA transduced with the indicated sgRNA. β-ACTIN was used as a loading control. d, Immunoblot of indicated proteins in indicated HEK-293T cells transduced with shRNA targeting either GFP as a control or NFS1 (two different shRNAs). Proteins were extracted from cells 6 days after transduction. GAPDH was used as a loading control. e, Schematic showing how the iron-sulfur cluster-containing protein LIAS enables OGDH and PDH activity by transferring lipoic acid as a cofactor to their enzyme complexes (left). Heatmap showing fold change in metabolite levels (log2) of the indicated cell lines relative to the average of those in SLC25A39 knockout cells complemented with SLC25A39 cDNA (middle). Metabolites were extracted 5 days after transduction with indicated sgRNAs. Values were normalized to the protein concentration of each cell line (left). Relative ratios of pyruvate to citrate metabolite levels of each indicated cell line from the metabolomics analysis in Fig. 4e (middle). Ratios were normalized to the average of the SLC25A39 knockout cells expressing SLC25A39 cDNA. Immunoblot with antibody against lipoic acid in the indicated Jurkat SLC25A39 knockout cells expressing a vector control or SLC25A39 cDNA transduced with the indicated sgRNA. Arrows indicate E2 complexes of PDH and OGDH containing lipoic acid (right). f, Representative bright-field micrographs of Jurkat SLC25A39 knockout cells transduced with the indicated sgRNA at the end of the cell proliferation assay. Scale bar, 50 μm. g, Relative cell number of the indicated Jurkat SLC25A39 knockout cells expressing a vector control or SLC25A39 cDNA transduced with the indicated sgRNA. Cells were cultured for 4 days with or without hemin (1 μM) and pyruvate (1 mM). Cell numbers were normalized to the average of the SLC25A39 knockout cells in each treatment condition. e, g, Bars represent mean ± s.d.; e, g, n = 3 biologically independent samples. Statistical significance in e was determined by one-way ANOVA followed by Bonferroni post-hoc analysis; g was determined by two-way ANOVA followed by Bonferroni post-hoc analysis.
Extended Data Fig. 8 |
Extended Data Fig. 8 |. Expression of DIC/OGC does not complement the decrease of mitochondrial GSH availability in SLC25A39 knockout cells.
a, Uptake of [13C2,15N]-GSH into mitochondria isolated from HEK-293T SLC25A39 knockout cells expressing a vector control, SLC25A39 cDNA, SLC25A10 (DIC, mitochondrial dicarboxylate carrier) or SLC25A11 (OGC, mitochondrial oxoglutarate carrier) cDNA at 5 s and 10 min. Bars represent mean ± s.d.; n = 3 biologically independent samples. Statistical significance was determined by two-way ANOVA followed by Bonferroni post-hoc analysis. b, PrediXcan-based TWAS design in UK biobank and summary graph of SLC25A39-associated phenotypes. Bonferroni-adjusted p-values are reported.
Fig. 1 |
Fig. 1 |. Global analysis of mitochondrial proteome under GSH depletion.
a, Relative abundance of GSH in whole cells (top) and mitochondria (bottom) immunopurified from HeLa cells treated with BSO (1 mM) for the indicated times compared with untreated controls. Data are mean ± s.d.; n = 3 biologically independent samples. One-way analysis of variance (ANOVA) followed by Bonferroni post hoc analysis. b, Schematic showing proteomics analysis of mitochondria isolated from indicated HeLa cells. c, Volcano plot showing relative fold change (log2) in mitochondrial protein abundance versus –log (P values) from HeLa cells treated with BSO (1 mM) for 4 days compared with untreated. The dotted line represents P = 0.01. Colours denote indicated protein families. Statistical significance was determined by two-tailed unpaired t-test. d, Immunoblot analysis of indicated proteins in whole-cell lysates and mitochondria isolated from HeLa cells (IP: HA) treated with BSO (1 mM) for the indicated days. D1, day 1; D4, day 4. e, Immunoblot of indicated proteins in HeLa cells infected with the indicated sgRNAs. Cells were plated 6 days after transduction and treated for 4 days with GSHee (10 mM). SLC25A12 and β-actin were used as loading controls. GSHee, GSH ethyl ester. f, Immunoblot of indicated proteins in HeLa cells treated with BSO (1 mM) and co-treated with either GSH (10 mM), GSHee (10 mM), trolox (50 μM) or ferrostatin-1 (5 μM) for 48 h. SLC25A12 and citrate synthase (CS) were used as loading controls. For gel source data, see Supplementary Fig. 1.
Fig. 2 |
Fig. 2 |. SLC25A39 is required for mitochondrial GSH import.
a, Volcano plot showing the log2 fold change in mitochondrial metabolite abundance versus − log P values from SLC25A39-knockout HeLa cells expressing a vector control or SLC25A39 cDNA. GSH and GSSG are shown in red; 3-PGA, 3-phosphoglyceric acid. The dotted line represents P = 0.05. Statistical significance was determined by multiple two-tailed unpaired t-tests with correction for multiple comparisons using the Holm–Šídák method. b, Relative metabolite abundance of indicated whole-cell or mitochondrial metabolites from SLC25A39-knockout K562, HEK 293T and HeLa cell lines compared with those expressing SLC25A39 cDNA. Mitochondrial NAD+ abundance is shown to indicate mitochondrial health. c, Uptake of [13C2,15N]-GSH into mitochondria isolated from SLC25A39-knockout HEK 293T cells expressing a vector control or SLC25A39 cDNA during the indicated times. Metabolite abundance is normalized to citrate synthase protein level. d, Top, structural and sequence comparison of SLC25A39 with the ADP/ATP carrier identifies M133, D226 and K329 as potential substrate contact points. Bottom, sequence alignment of SLC25A39 homologues for indicated residues. Dm, Drosophila melanogaster; Dr, Danio rerio; Hs, Homo sapiens; Mm, Mus musculus; Sc, Saccharomyces cerevisiae. e, Top, uptake of [13C2,15N]-GSH into mitochondria isolated from SLC25A39-knockout HEK 293T cells expressing a vector control or indicated SLC25A39 cDNAs at 5 s and 10 min. Metabolite abundance is normalized to citrate synthase protein level. Bottom, mitochondrial NAD+ abundance is shown to indicate the mitochondrial health. Data are mean ± s.d. (b, c, e); n = 3 biologically independent samples (ac, e). Two-tailed unpaired t-test (a, b); two-way ANOVA followed by Bonferroni post hoc analysis (c, e). NS, not significant.
Fig. 3 |
Fig. 3 |. Mitochondrial GSH import is essential for cell proliferation.
a, Schematic depicting the metabolism-focused CRISPR genetic screens in SLC25A39-knockout Jurkat cells expressing a vector control or SLC25A39 cDNA. b, CRISPR gene scores in SLC25A39-knockout Jurkat cells expressing a vector control or SLC25A39 cDNA. c, Per cent of fold change in cell number of the indicated SLC25A39-knockout Jurkat cells expressing a vector control or SLC25A39 cDNA transduced with the indicated sgRNAs. Cell doublings were normalized to the average for the SLC25A39-knockout cells. d, Steady-state mitochondrial abundance of GSH in HEK 293T SLC25A39-knockout cells expressing the indicated cDNAs. Data are normalized to citrate synthase protein levels. e, Schematic of GSH synthesis in mammals and S. thermophilus. f, Top, schematic of engineered GshF construct targeted to mitochondria (mito-GshF), with regions corresponding to GCL and GSS (ATP-grasp domain). Bottom, immunofluorescence analysis of mito-GshF (Flag, red) and citrate synthase (CS, green) in HeLa cells (bottom). Micrographs are representative of two independent experiments. Scale bar, 20 μm. g, Mitochondrial abundance of GSH in SLC25A39-knockout HEK 293T cells transduced with the indicated cDNAs. Data are normalized to citrate synthase protein level. h, Left, schematic showing the restoration of mitochondrial GSH levels by mito-GshF. Right, log2 fold change in cell number of SLC25A39-knockout Jurkat cells expressing a vector control or mito-GshF transduced with the indicated sgRNA. i, Log2 fold change in cell number of SLC25A39-knockout Jurkat (left) or HEK 293T (right) cells expressing a vector control or SLC25A39 cDNA transduced with the indicated sgRNA. Cells were treated for 4 days with the indicated BSO concentrations. Data are mean ± s.d., n = 3 biologically independent samples (c, d, gi). One-way ANOVA followed by Bonferroni post hoc analysis (c, d, g, h); two-way ANOVA followed by Bonferroni post hoc analysis (i).
Fig. 4 |
Fig. 4 |. Mitochondrial GSH depletion impairs erythropoiesis and iron-sulfur cluster proteins.
a, Representative images of embryos of indicated genotypes at E12.5. Scale bar, 1 mm. b, Immunohistochemical staining of developing hearts (left) and livers (right) of E12.5 embryos for indicated genotypes with a Ter119 antibody (black). Nuclei were counterstained with fast red. Scale bar, 100 μm. c, Volcano plot showing log2 fold change in whole-cell protein abundance versus −log P values for SLC25A39/40 double-knockout Jurkat cells compared to those expressing SLC25A39 cDNA. Colours indicate protein groups whose abundance change significantly upon SLC25A39/40 loss. d, Immunoblot of indicated proteins in SLC25A39-knockout Jurkat cells expressing a vector control or SLC25A39 cDNA transduced with the indicated sgRNA. β-Actin was used as a loading control. e, Aconitase activity (Vmax) in whole-cell lysates of SLC25A39-knockout Jurkat cells expressing a vector control or mito-GshF transduced with the indicated sgRNAs (mean ± s.d., n = 3; mU, milli units). f, Ratios of α-ketoglutarate to succinate in indicated cell lines. Values are normalized to the average for SLC25A39-knockout cells expressing SLC25A39 cDNA. g, Immunoblot of indicated proteins in SLC25A39-knockout Jurkat cells expressing vector control or mito-GshF transduced with the indicated sgRNA. β-Actin was used as a loading control. a, b, n = 3 ErGFP-cre+/− Slc25a39fl/fl, n = 4 Slc25a39fl/fl, n = 4 ErGFP-cre+/− Slc25a39fl/− embryos. e, f, Data are mean ± s.d. c, e, f, n = 3 biologically independent samples. Two-tailed unpaired t-test (c); one-way ANOVA followed by Bonferroni post hoc analysis (e, f). For gel source data, see Supplementary Fig. 1.

References

    1. Meister A. & Anderson ME Glutathione. Annu. Rev. Biochem 52, 711–760 (1983). - PubMed
    1. Mårtensson J, Lai JC & Meister A. High-affinity transport of glutathione is part of a multicomponent system essential for mitochondrial function. Proc. Natl Acad. Sci. USA 87, 7185–7189 (1990). - PMC - PubMed
    1. Deponte M. The incomplete glutathione puzzle: just guessing at numbers and figures? Antioxid. Redox Signal 27, 1130–1161 (2017). - PMC - PubMed
    1. Griffith OW & Meister A. Origin and turnover of mitochondrial glutathione. Proc. Natl Acad. Sci. USA 82, 4668–4672 (1985). - PMC - PubMed
    1. Hwang C, Sinskey AJ & Lodish HF Oxidized redox state of glutathione in the endoplasmic reticulum. Science 257, 1496–1502 (1992). - PubMed

Publication types