. 2021 Oct;598(7882):611-617.
doi: 10.1038/s41586-021-03900-w. Epub 2021 Oct 27.

Global potential for harvesting drinking water from air using solar energy

Affiliations

Global potential for harvesting drinking water from air using solar energy

Jackson Lord et al. Nature. 2021 Oct.

Abstract

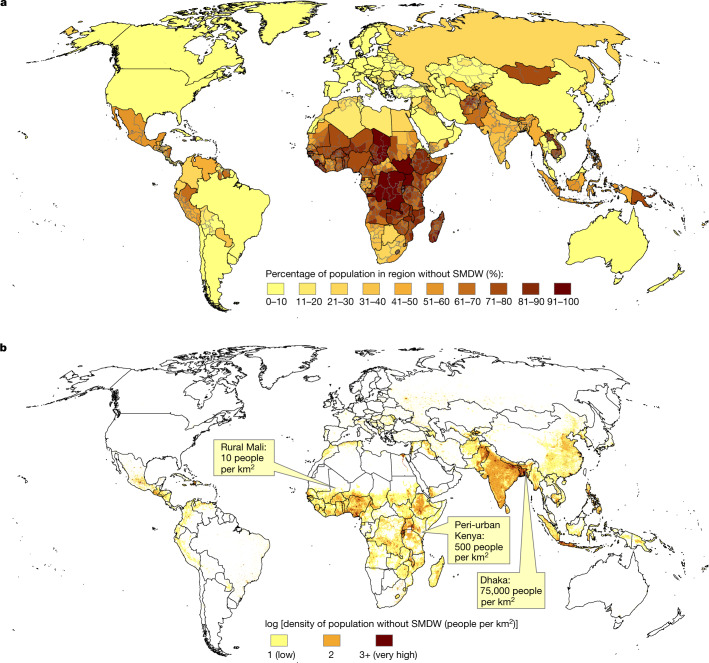
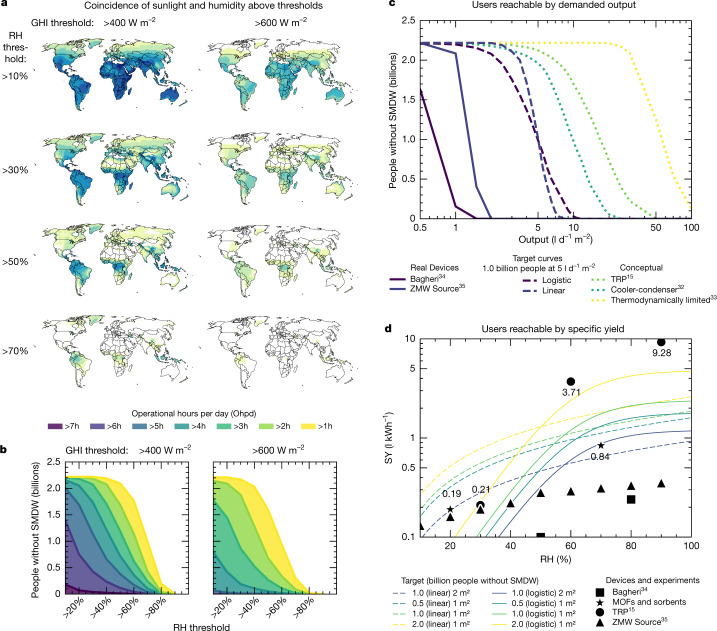
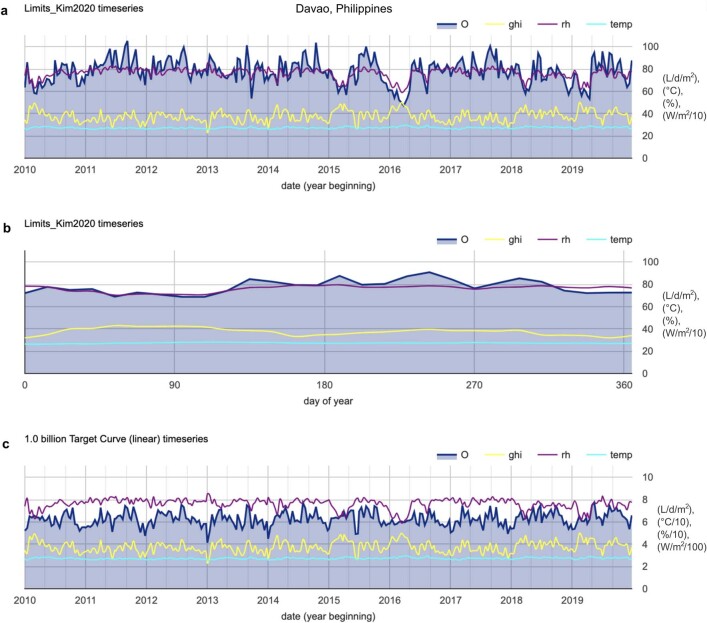
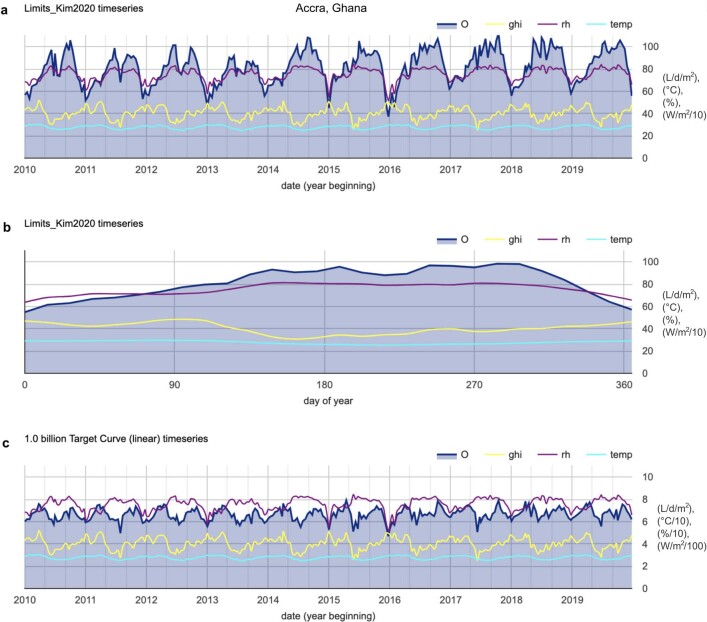
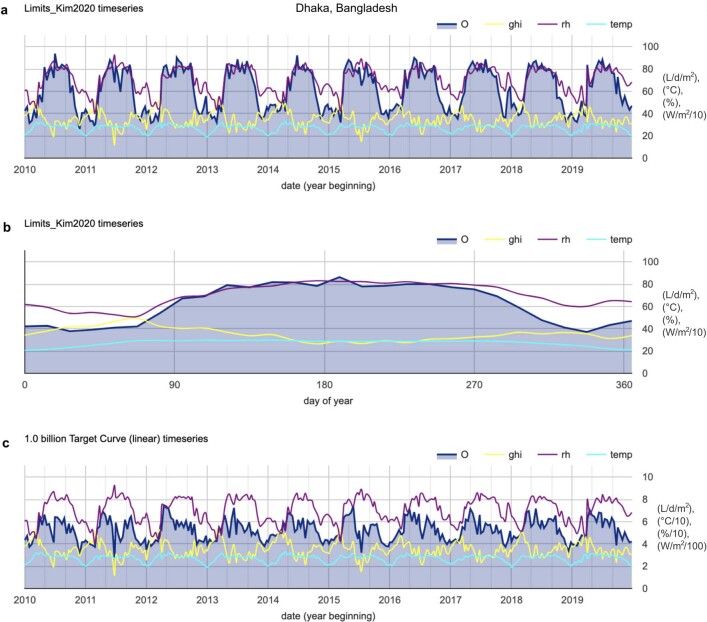
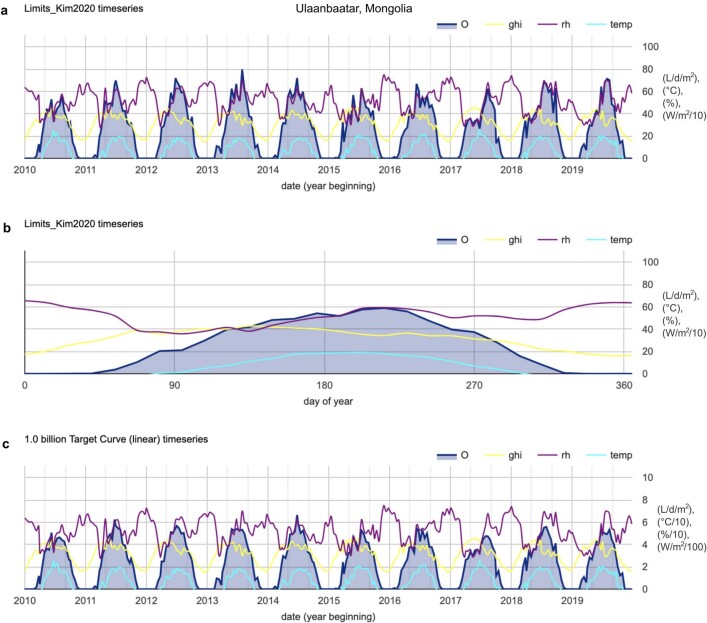
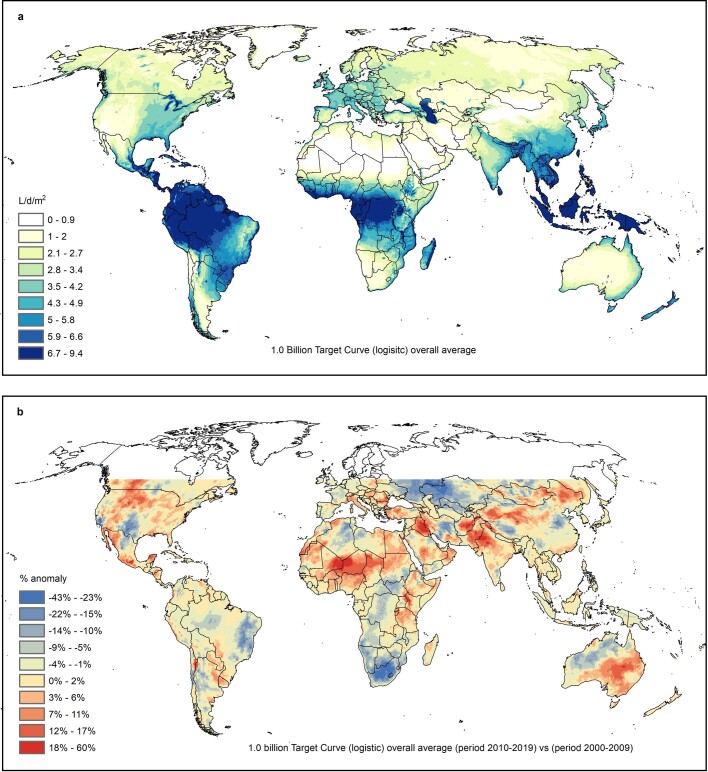
Access to safely managed drinking water (SMDW) remains a global challenge, and affects 2.2 billion people1,2. Solar-driven atmospheric water harvesting (AWH) devices with continuous cycling may accelerate progress by enabling decentralized extraction of water from air3-6, but low specific yields (SY) and low daytime relative humidity (RH) have raised questions about their performance (in litres of water output per day)7-11. However, to our knowledge, no analysis has mapped the global potential of AWH12 despite favourable conditions in tropical regions, where two-thirds of people without SMDW live2. Here we show that AWH could provide SMDW for a billion people. Our assessment-using Google Earth Engine13-introduces a hypothetical 1-metre-square device with a SY profile of 0.2 to 2.5 litres per kilowatt-hour (0.1 to 1.25 litres per kilowatt-hour for a 2-metre-square device) at 30% to 90% RH, respectively. Such a device could meet a target average daily drinking water requirement of 5 litres per day per person14. We plot the impact potential of existing devices and new sorbent classes, which suggests that these targets could be met with continued technological development, and well within thermodynamic limits. Indeed, these performance targets have been achieved experimentally in demonstrations of sorbent materials15-17. Our tools can inform design trade-offs for atmospheric water harvesting devices that maximize global impact, alongside ongoing efforts to meet Sustainable Development Goals (SDGs) with existing technologies.


Conflict of interest statement

We disclose the following potential competing interests. This work was funded by X, The Moonshot Factory (formerly known as Google[x]). X is a part of Alphabet. Both are for-profit entities. X has filed for patent protection for water-from-air devices, on which multiple authors are listed as inventors. Water-from-air devices may represent significant commercial opportunities upon meeting certain metrics. This work may be pursued further in various ways, including as a possible spinout company in which one or more authors may become founders, officers, shareholders, employees or otherwise involved with a financial interest.

Figures

Fig. 1
Fig. 1. Geographic distribution of world population without SMDW.
a, Percentage share of total population in survey region living without SMDW as reported by the WHO/UNICEF JMP. b, Log population density of people without SMDW from WorldPop at 1 km resolution adjusted by JMP proportions at 1 km resolution. Produced in ArcGIS 10.
Fig. 2
Fig. 2. Data processing workflow of AWH-Geo.
Cylinders indicate data stores from Google Earth Engine, the WHO/UNICEF JMP or open online content. Shown are processes (rectangles), geo-images (parallelograms) and outputs (circles).
Fig. 3
Fig. 3. Upper bounds water output of solar-driven AWH in relation to global user base.
ac, Mean daily water output of solar-driven AWH given overall thermodynamic limits of any process (Thot = 100 °C) (a), cooler–condenser processes driven by PV (b) and example of active sorbent device types (TRP gels from ref. ) (c). Callout charts in a show select seasonal profiles in bi-weekly intervals of mean output and primary climate drivers: GHI, RH and temperature. Output (in l d−1 m−2) normalized to horizontal device area in sunlight. Real devices will perform below maximum theoretical potentials. Overlaid dot density (red) of 2.2 billion people without SMDW. Placement of dots is spatially arbitrary across the survey region. Produced in ArcGIS 10. Source data
Fig. 4
Fig. 4. AWH technology parameters in relation to global impact targets.
a, b, Geographic distribution (a) and sum (b) of population without SMDW living in areas meeting parametric thresholds relevant to operation of SC-AWH devices. Operational hours per day (Ophd) is the mean daily duration of both sunlight (GHI) and RH thresholds exceeded simultaneously. Usage example: a device requiring more than 5 h d−1 of sunlight above 400 W m−2 must operate down to 40% RH to reach approximately 700 million users. c, d, People without SMDW reachable in relation to mean daily output normalized to horizontal device area in sunlight (c) and SY profile (d). Target curves are hypothetical SY profiles capable of providing 5 l d−1 for a given solar collection area. Water output and SY targets scale linearly with device area in sunlight. For demonstration we therefore show that, for a given RH, doubling the area of a device from 1 m2 to 2 m2 halves the target SY requirement to achieve SMDW for a target population. ZMW Source profile approximated from the manufacturer’s technical specifications sheet. Note that the full ZMW panel is approximately 3 m2. Experimental values for MOFs and sorbents are taken from experiments, (0.19 l kWh−1 and 0.84 l kWh−1), and TRP is taken from ref. , all converted as in ref. . Values for the Bagheri device assume work instead of heat input; therefore photovoltaic efficiencies were applied when converting from GHI. Maps are produced in ArcGIS 10. Source data
Extended Data Fig. 1
Extended Data Fig. 1. Comparison of coincidence analysis results to input datasets.
Main results from coincidence analysis (Fig. 4b, people without SMDW served by opH/d of coincident climate threshold) with ERA5-Land and WorldPop 2017 datasets compared with results from (a) GLDAS 2.1 climate and WorldPop 2017 population, and (b) GLDAS 2.1 climate and LandScan 2017 population datasets. Operational hours per day (opH/d) shown across global horizontal irradiance (GHI) and relative humidity (rH) thresholds.
Extended Data Fig. 2
Extended Data Fig. 2. Validation of SMDW using household surveys reporting SMDW at household-level.
(a) Charted and (b) tabulated validation of cross-estimation of percentage safely managed (SM) from at least basic (ALB) drinking water ladders at sub-national (SN) level from national (N) breakdowns using known reference data set at SN level from WHO/UNICEF JMP data. Reference values from nationally representative Multiple Indicator Cluster Surveys integrating water quality testing (ref. SM) compared with our estimates from the JMP Geoprocessor combining JMP sub-national estimates for ALB and national estimates for safely managed drinking water services (est. SM). Ordinary least squares regression (OLS) resulted in standard error (stdErr) as reported. Sample size n = 15. Table (b) shows main results (ERA5-Land) population counts after adjustment from regression. Population without safely managed drinking water (SMDW) shown across global horizontal irradiance (GHI) and relative humidity (rH) thresholds.
Extended Data Fig. 3
Extended Data Fig. 3. Visual representation of MADP90 concept from location in Tanzania.
Histograms of moving-averaged output (L/d/m2) across window periods (indicated in days) for a location in Manda, Tanzania. P90 availability value increases as averaging window period increases. P90 values are estimated and for illustrative purposes only.
Extended Data Fig. 4
Extended Data Fig. 4. Select MADP90 metrics of AWH upper bounds.
(a) MADP90-90day, and (b) MADP90-7day values (measure of availability through time) globally for AWH thermodynamic upper bounds (Kim 2020), during ten year 2010–2019 (inclusive) analysis period.
Extended Data Fig. 5
Extended Data Fig. 5. Bi-weekly timeseries of AWH output and climate drivers for equatorial profile in Davao, Philippines.
Bi-weekly mean output (L/d/m2), and climate inputs global horizontal irradiance (GHI, plotted from 0–1000 W/m2), relative humidity (rH, plotted from 0–100 %), and temperature (plotted from 0–100 °C) of (a) AWH thermodynamic upper bounds (Kim 2020) during ten year 2010–2019 (inclusive) analysis period for each bi-weekly interval and (b) averaged by bi-weekly period annually during this period, and (c) for the 1 billion user linear target curve for each bi-weekly interval. Example of a steady, low variability output profile characteristic of equatorial tropics.
Extended Data Fig. 6
Extended Data Fig. 6. Bi-weekly timeseries of AWH output and climate drivers for tropical savanna profile in Accra, Ghana.
Bi-weekly mean output (L/d/m2), and climate inputs global horizontal irradiance (GHI, plotted from 0–1000 W/m2), relative humidity (rH, plotted from 0–100 %), and temperature (plotted from 0–100 °C) of (a) AWH thermodynamic upper bounds (Kim 2020) during ten year 2010–2019 (inclusive) analysis period for each bi-weekly interval and (b) averaged by bi-weekly period annually during this period, and (c) for the 1 billion user linear target curve for each bi-weekly interval. Example of a seasonal wet-dry tropical savanna climate with moderate semi-annual fluctuations of AWH output driven by rH.
Extended Data Fig. 7
Extended Data Fig. 7. Bi-weekly timeseries of AWH output and climate drivers for tropical savanna profile in Dhaka, Bangladesh.
Bi-weekly mean output (L/d/m2), and climate inputs global horizontal irradiance (GHI, plotted from 0–1000 W/m2), relative humidity (rH, plotted from 0–100 %), and temperature (plotted from 0–100 °C) of (a) AWH thermodynamic upper bounds (Kim 2020) during ten year 2010–2019 (inclusive) analysis period for each bi-weekly interval and (b) averaged by bi-weekly period annually during this period, and (c) for the 1 billion user linear target curve for each bi-weekly interval. Example of a seasonal wet-dry tropical savanna climate with pronounced semi-annual fluctuations of AWH output driven by rH.
Extended Data Fig. 8
Extended Data Fig. 8. Bi-weekly timeseries of AWH output and climate drivers for mid-latitude profile in Ulaanbaatar, Mongolia.
Bi-weekly mean output (L/d/m2), and climate inputs global horizontal irradiance (GHI, plotted from 0–1000 W/m2), relative humidity (rH, plotted from 0–100 %), and temperature (plotted from 0–100 °C) of (a) AWH thermodynamic upper bounds (Kim 2020) during ten year 2010–2019 (inclusive) analysis period for each bi-weekly interval and (b) averaged by bi-weekly period annually during this period, and (c) for the 1 billion user linear target curve for each bi-weekly interval. Example of a mid-latitude climate with pronounced semi-annual fluctuations of AWH output driven by temperature.
Extended Data Fig. 9
Extended Data Fig. 9. Decadal anomaly of AWH output with logistic SY profile between 2000–2009 and 2010–2019.
(a) Overall mean output (L/d/m2) of 1 billion user target logistic curve at 5 L/d/m2 during ten year 2010–2019 (inclusive) period. (b) Ratio (%) anomaly of output of same specific yield (SY, in L/kWh) profile averaged over ten year 2000–2009 (inclusive) period. Red colors indicate increasing AWH output with time between the two decades. Blue colors indicate decreasing AWH output.

References

    1. Bain R, Johnston R, Mitis F, Chatterley C, Slaymaker T. Establishing Sustainable Development Goal baselines for household drinking water, sanitation and hygiene services . Water. 2018;10:1711. doi: 10.3390/w10121711. - DOI
    1. Progress on Drinking Water, Sanitation and Hygiene: 2017 Update and SDG Baselines (World Health Organization and the United Nations Children’s Fund, 2017).
    1. Hanikel N, et al. Rapid cycling and exceptional yield in a metal-organic framework water harvester. ACS Cent. Sci. 2019;5:1699–1706. doi: 10.1021/acscentsci.9b00745. - DOI - PMC - PubMed
    1. Li R, Shi Y, Wu M, Hong S, Wang P. Improving atmospheric water production yield: enabling multiple water harvesting cycles with nano sorbent. Nano Energy. 2020;67:104255. doi: 10.1016/j.nanoen.2019.104255. - DOI
    1. Qi H, et al. An interfacial solar‐driven atmospheric water generator based on a liquid sorbent with simultaneous adsorption–desorption. Adv. Mater. 2019;31:1903378. doi: 10.1002/adma.201903378. - DOI - PubMed

Publication types