. 2021 Oct 11:12:752484.
doi: 10.3389/fimmu.2021.752484. eCollection 2021.

Mechanisms by Which Obesity Promotes Acute Graft- Versus-Host Disease in Mice

Affiliations

Mechanisms by Which Obesity Promotes Acute Graft- Versus-Host Disease in Mice

Lam T Khuat et al. Front Immunol. .

Abstract

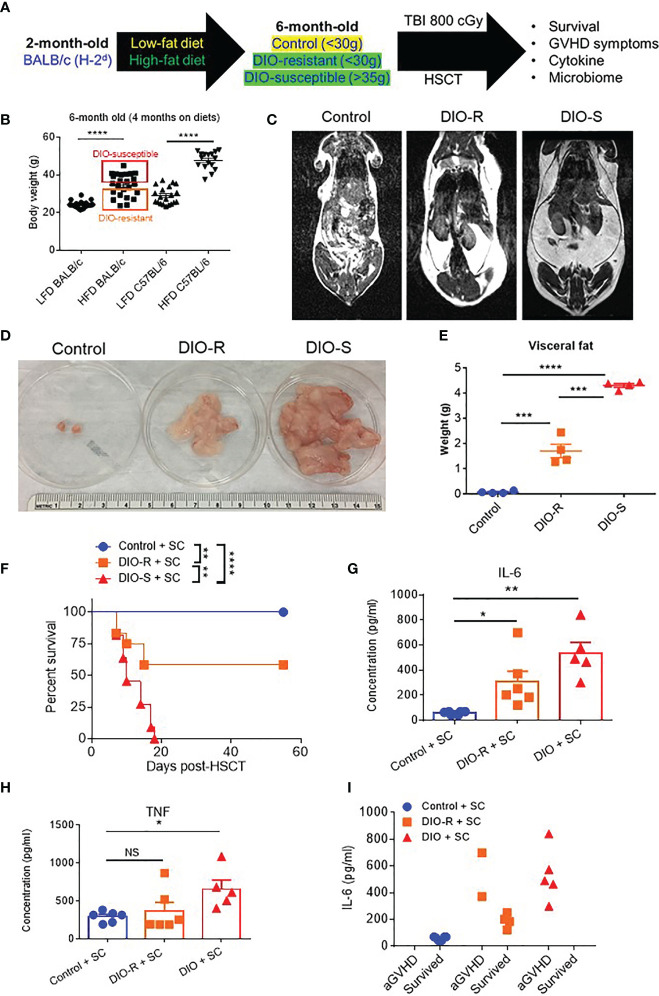
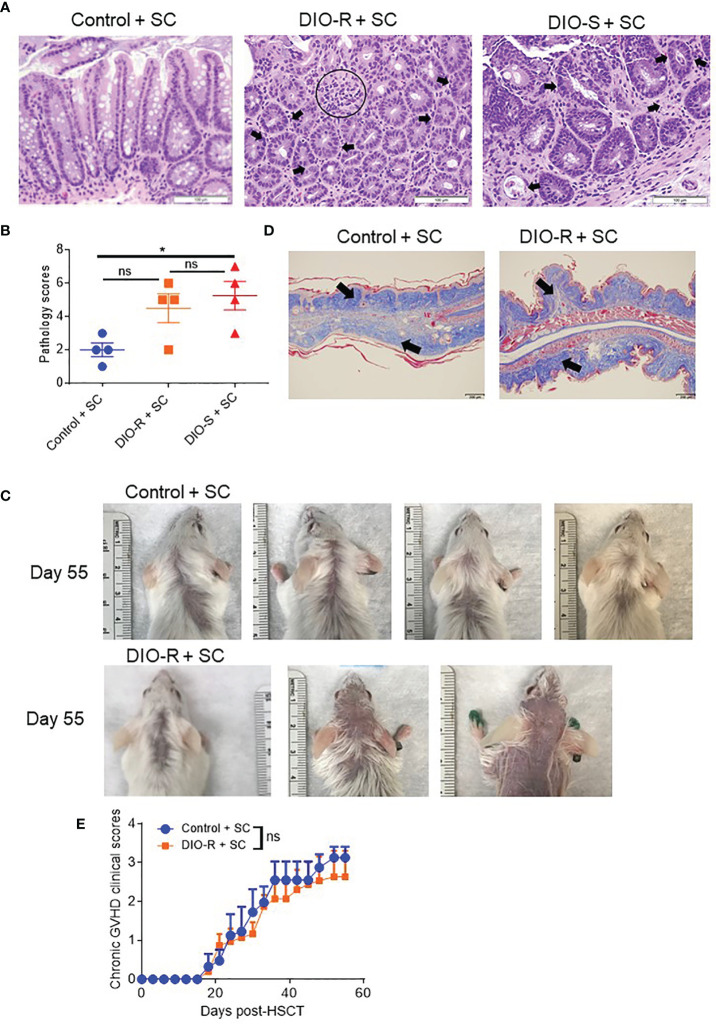
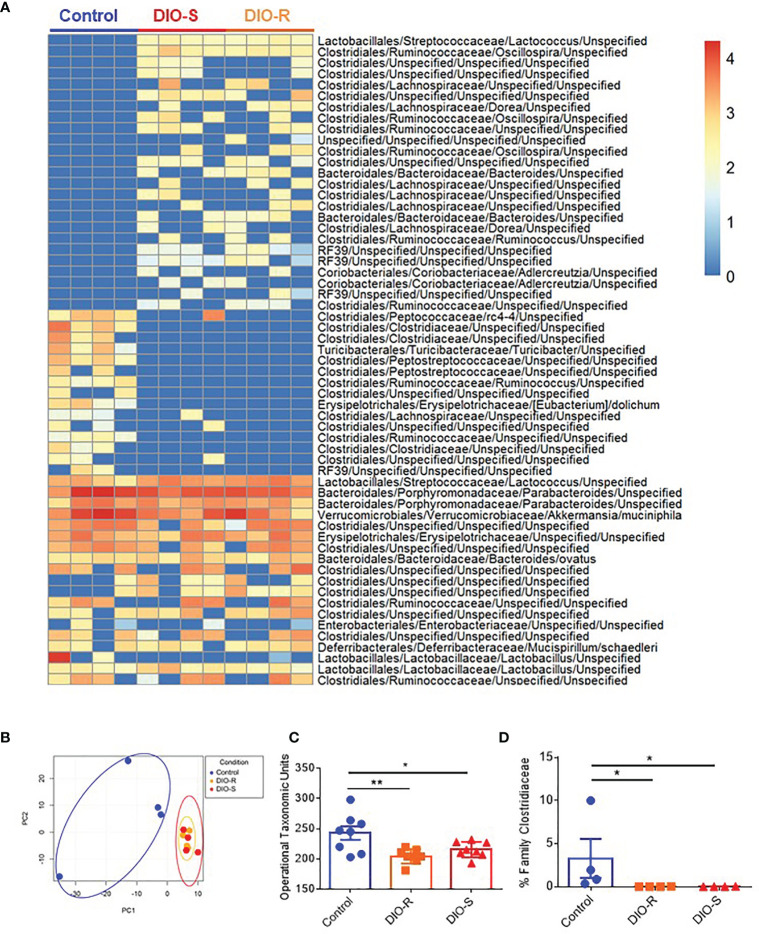
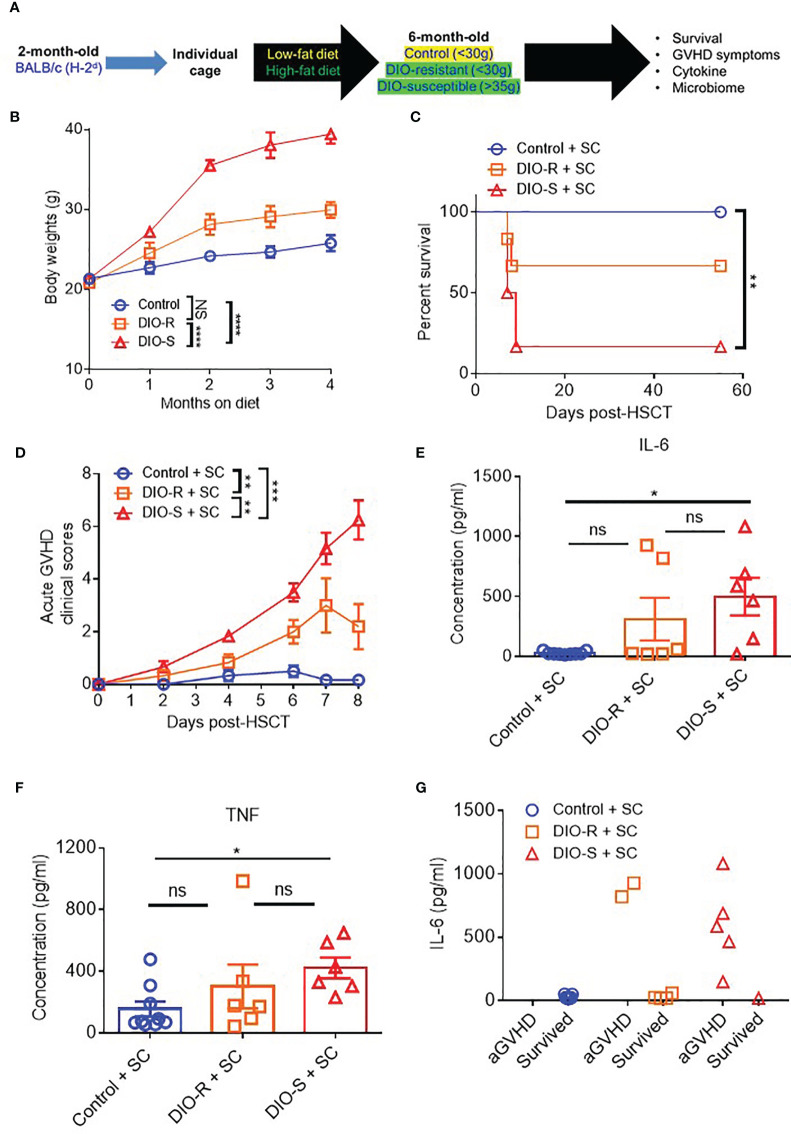
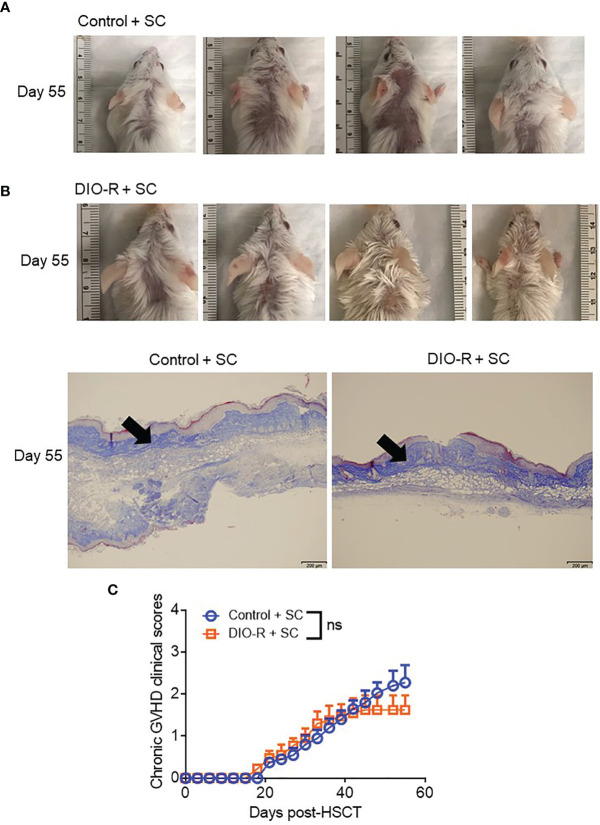
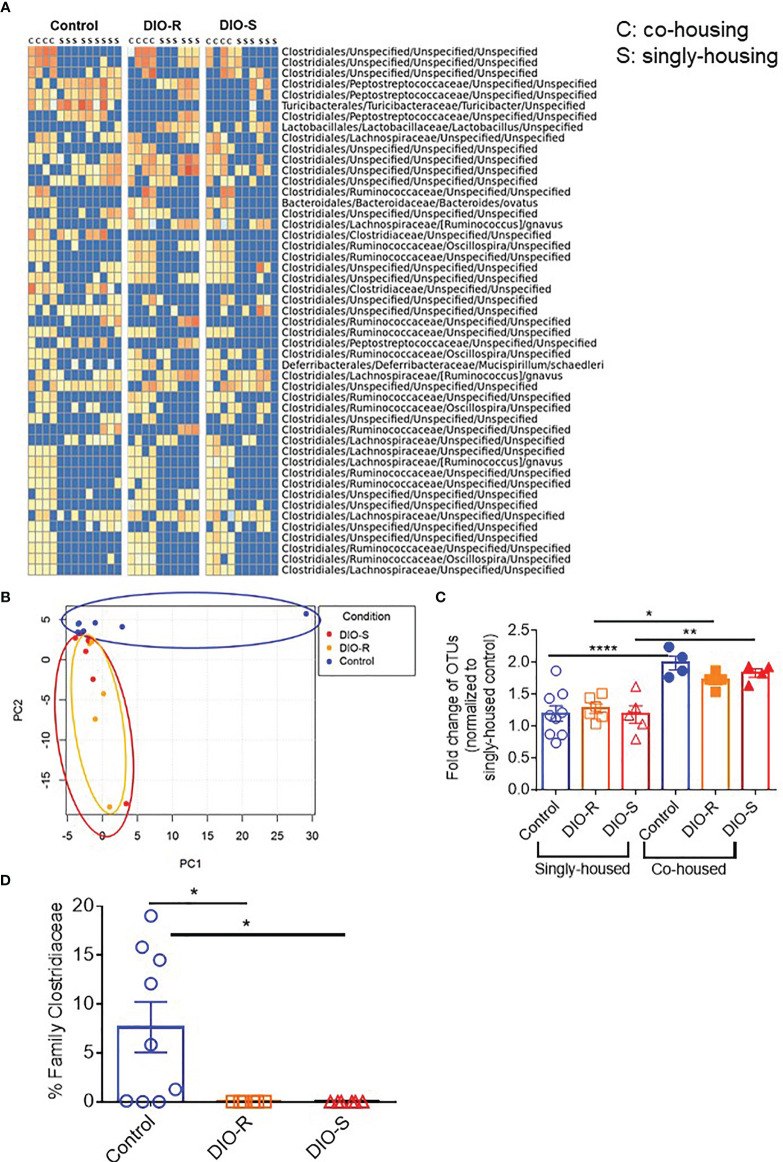
The efficacy of allogeneic hematopoietic stem cell transplantation (allo-HSCT) is limited by the occurrence of acute and chronic graft-versus-host disease (GVHD). We have recently demonstrated that obesity results in exacerbated acute gastrointestinal GVHD in both mouse models and clinical outcomes due to increased pro-inflammatory cytokine responses and microbiota alterations. We therefore wanted to delineate the role of the various parameters in obesity, adiposity, effects of high-fat (HF) diet, and the role of microbiome on GVHD pathogenesis, by taking advantage of a mouse strain resistant to diet-induced obesity (DIO). Female BALB/c mice are resistant to DIO phenotype with approximately 50% becoming DIO under HF diets. The DIO-susceptible recipients rapidly succumb to acute gut GVHD, whereas the DIO-resistant recipient littermates, which do not become obese, are partially protected from GVHD, indicating that being on HF diet alone contributes to but is not the primary driver of GVHD. Microbiome assessment revealed restricted diversity in both cohorts of mice, but coprophagy normalizes the microbiota in mice housed together. We then individually housed DIO-resistant, DIO-susceptible, and lean control mice. Notably, each of the individually housed groups demonstrates marked restricted diversity that has been shown to occur from the stress of single housing. Despite the restricted microbiome diversity, the GVHD pathogenesis profile remains consistent in the group-housed mice, with the lean control single-housed mice exhibiting no acute GVHD and DIO-resistant recipients showing again partial protection. These results demonstrate that the deleterious effects of obesity on acute gut GVHD are critically dependent on adiposity with the HF diet also playing a lesser role, and the microbiome alterations with obesity instead appear to fuel ongoing acute GVHD processes.

Keywords: GVHD; cytokine storm; high-fat (HF) diet; microbiome; obesity.


Conflict of interest statement

BB receives remuneration as an advisor to Magenta Therapeutics and BlueRock Therapeutics; Research funding from BlueRock Therapeutics, Rheos Medicines, Equilibre biopharmaceuticals, Carisma Therapeutics, Inc., and is a co-founder of Tmunity Therapeutics. AM has advisory role or research funding from Merck, Genentech, BMS, Incyte, Trisalus, MultiplexThera, EMD serono, Transgene. The remaining authors declare that the research was conducted in the absence of any commercial or financial relationships that could be construed as a potential conflict of interest.

Figures

Figure 1
Figure 1
(A) Lethally irradiated control, DIO-R, and DIO-S BALB/c mice received 8 million bone marrow cells and 25 million splenocytes from donor B10.D2 mice. (B) Body weights of BALB/c and C57BL/6 mice after 4 months on LF or HF diet (n=16-24/group). (C) Magnetic resonance imaging scans of control, DIO-R, and DIO-S mice. Fat tissue is white. (D) Representative images of visceral fat content of control, DIO-R, and DIO-S mice. (E) Quantification of visceral fat content of control, DIO-R, and DIO-S mice (n=4/group). (F) Survival rate post-HSCT (n=12/group). (G) Serum IL-6 and (H) TNF concentrations at day 7 post-HSCT (n=5-6/group). (I) Correlation between acute GVHD outcomes and IL-6 levels (n=5-6/group). Graphs depict mean ±s.e.m. Survival curve (F) was plotted on a Kaplan-Meier curve and analyzed by a log-rank test. One-way ANOVA test was used in (B, F, G). *p < 0.05, **p < 0.01, ***p < 0.001, ****p < 0.0001, NS, not significant.
Figure 2
Figure 2
(A) Representative images of H&E staining from colon samples at day 7 post-HSCT. The scale bar is 100μm. Circle indicates severe goblet cell loss and mild, multifocal lamina proprial inflammation. Arrows indicate piling of glandular epithelial cells, degenerate crypts, apoptotic crypt abscess and rare karyomegalic cells. (B) Pathology scores of samples from (A) (n=4/group). (C) Representative images of sclerodermatous GVHD with alopecia at day 55 post-HSCT. (D) Representative photos of sclerodermatous GVHD with tissue fibrosis by Trichrome staining. The scale bar is 200μm. Arrows indicate collagen deposition (blue). (E) Chronic GVHD clinical scores post-HSCT (n=3-4/group). Bar graphs depict mean ±s.e.m. One-way ANOVA test was used in (B). Unpaired Student’s t test was used in (E). *p < 0.05, NS, not significant.
Figure 3
Figure 3
(A) Taxonomic profiles of resting control, DIO-R, and DIO-S BALB/c mice (n=4/group). (B) Principle component analysis (PCA) of microbiome profiles of control, DIO-R, and DIO-S BALB/c mice (n=4/group). (C) Operational taxonomic units (OTUs) in control, DIO-R, and DIO-S BALB/c mice (n=8/group). (D) Abundance of family Clostridiaceae of control, DIO-R, and DIO-S BALB/c mice. Bar graphs depict mean ±s.e.m. One-way ANOVA test was used in (C, D). *p < 0.05, **p < 0.01.
Figure 4
Figure 4
(A) 8-week-old BALB/c mice were individually housed and put on LF or HF diet for 4 months. Mice were then lethally irradiated and received 8 million bone marrow cells and 25 million splenocytes from donor B10.D2 mice. (B) Kinetics of body weight gain of BALB/c mice on LF or HF diet. (C) Survival rate post-HSCT (n=6-9/group). (D) aGVHD clinical scores post-HSCT (n=6-9/group). (E) Serum IL-6 and (F) TNF concentrations at day 7 post-HSCT (n=6-9/group). (G) Correlation between acute GVHD outcomes and IL-6 levels (n=6-9/group). Bar graphs depict mean ±s.e.m. Survival curve (C) was plotted on a Kaplan-Meier curve and analyzed by a log-rank test. Body weght curve (B) and clinical scores (D) were analyzed by 2-way analysis of variance (ANOVA) with Tukey's post hoc test for comparison among groups. One-way ANOVA test was used in (E, F). *p < 0.05, **p < 0.01, ***p < 0.001, NS, not significant.
Figure 5
Figure 5
(A) Representative images of sclerodermatous GVHD with alopecia at day 55 post-HSCT. (B) Representative photos of sclerodermatous GVHD with tissue fibrosis by Trichrome staining. The scale bar is 200μm. Arrows indicate collagen deposition (blue). (C) Chronic GVHD clinical scores post-HSCT (n=4/group). Bar graphs depict mean ±s.e.m. Unpaired Student’s t test was used in (C). NS, not significant.
Figure 6
Figure 6
(A) Taxonomic profiles of resting control, DIO-R, and DIO-S BALB/c mice being co-housed or singly housed for 4 months (n=4-9/group). (B) Principle component analysis (PCA) of microbiome profiles of singly-housed control, DIO-R, and DIO-S BALB/c mice (n=6-9/group). (C) Fold change of OTUs in singly-housed versus co-housed control, DIO-R, and DIO-S BALB/c mice (n=4-9/group). (D) Abundance of family Clostridiaceae of singly-housed control, DIO-R, and DIO-S BALB/c mice (n=6-9/group). Bar graphs depict mean ±s.e.m. One-way ANOVA test was used in (C, D). *p < 0.05, **p < 0.01, ****p < 0.0001.

References

    1. de Heredia FP, Gomez-Martinez S, Marcos A. Obesity, Inflammation and the Immune System. Proc Nutr Soc (2012) 71(2):332–8. doi: 10.1017/S0029665112000092 - DOI - PubMed
    1. Milner JJ, Beck MA. The Impact of Obesity on the Immune Response to Infection. Proc Nutr Soc (2012) 71(2):298–306. doi: 10.1017/S0029665112000158 - DOI - PMC - PubMed
    1. Mirsoian A, Bouchlaka MN, Sckisel GD, Chen M, Pai CC, Maverakis E, et al. . Adiposity Induces Lethal Cytokine Storm After Systemic Administration of Stimulatory Immunotherapy Regimens in Aged Mice. J Exp Med (2014) 211(12):2373–83. doi: 10.1084/jem.20140116 - DOI - PMC - PubMed
    1. Khuat LT, Le CT, Pai CS, Shields-Cutler RR, Holtan SG, Rashidi A, et al. . Obesity Induces Gut Microbiota Alterations and Augments Acute Graft-Versus-Host Disease After Allogeneic Stem Cell Transplantation. Sci Transl Med (2020) 12(571):eaay7713. doi: 10.1126/scitranslmed.aay7713 - DOI - PMC - PubMed
    1. Navarro WH, Loberiza FR, Jr., Bajorunaite R, van Besien K, Vose JM, Lazarus HM, et al. . Effect of Body Mass Index on Mortality of Patients With Lymphoma Undergoing Autologous Hematopoietic Cell Transplantation. Biol Blood Marrow Transplant (2006) 12(5):541–51. doi: 10.1016/j.bbmt.2005.12.033 - DOI - PubMed

Publication types