Comparative Study
. 2021 Oct 11:12:754589.
doi: 10.3389/fimmu.2021.754589. eCollection 2021.

Characterization of the Infant Immune System and the Influence and Immunogenicity of BCG Vaccination in Infant and Adult Rhesus Macaques

Affiliations
Comparative Study

Characterization of the Infant Immune System and the Influence and Immunogenicity of BCG Vaccination in Infant and Adult Rhesus Macaques

Charlotte Sarfas et al. Front Immunol. .

Abstract

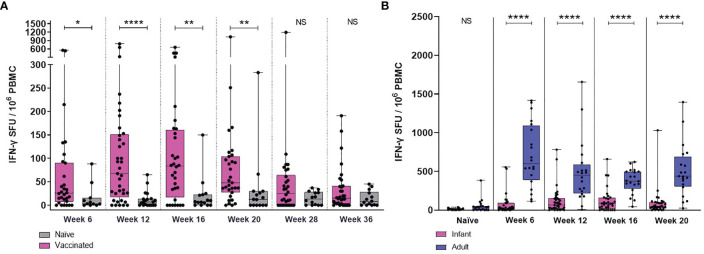
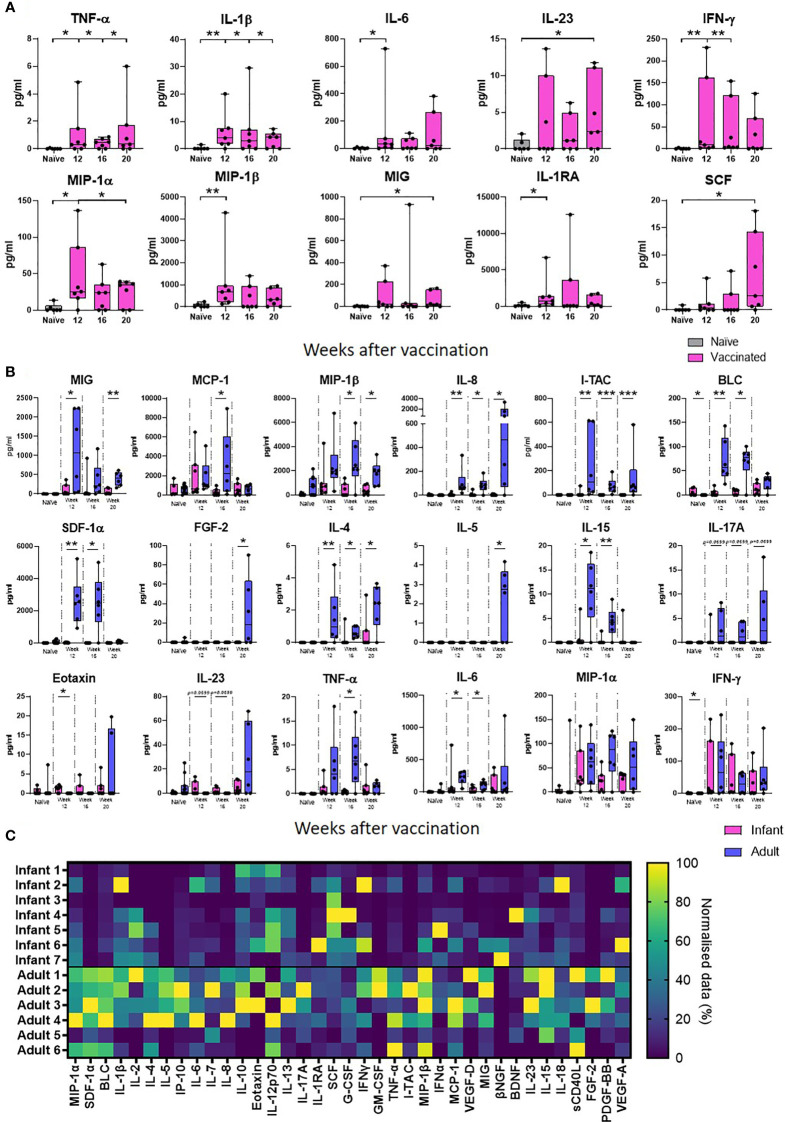
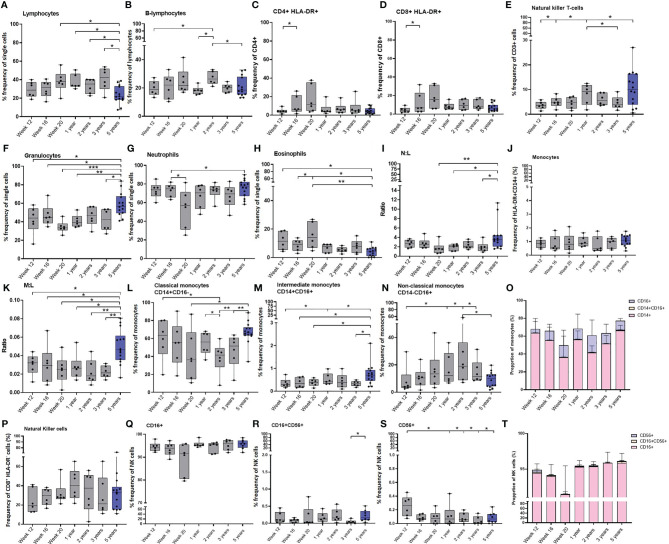
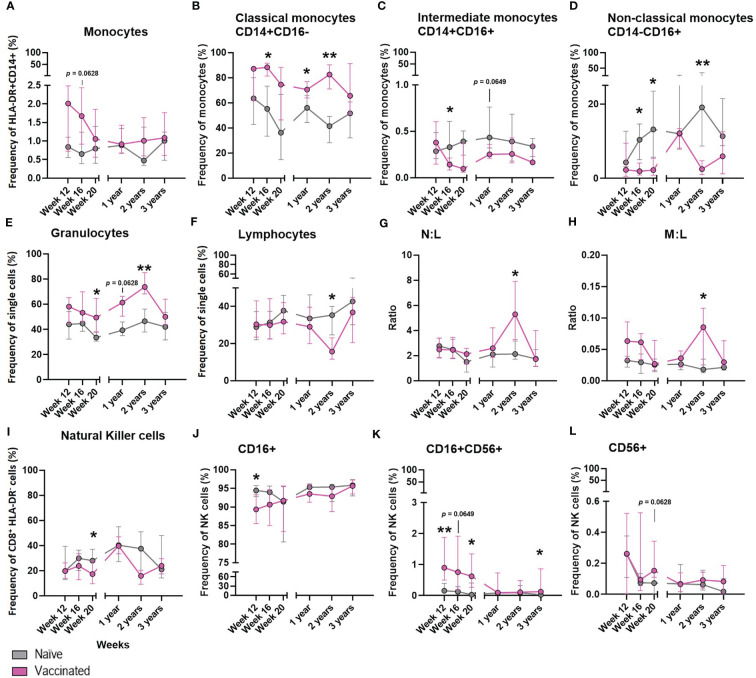
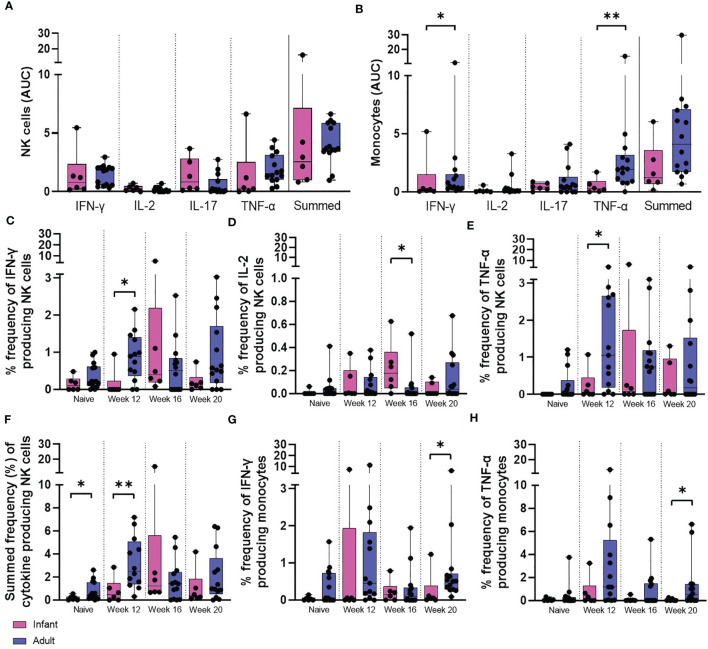
In many countries where tuberculosis (TB) is endemic, the Bacillus Calmette-Guérin (BCG) vaccine is given as close to birth as possible to protect infants and children from severe forms of TB. However, BCG has variable efficacy and is not as effective against adult pulmonary TB. At present, most animal models used to study novel TB vaccine candidates rely on the use of adult animals. Human studies show that the infant immune system is different to that of an adult. Understanding how the phenotypic profile and functional ability of the immature host immune system compares to that of a mature adult, together with the subsequent BCG immune response, is critical to ensuring that new TB vaccines are tested in the most appropriate models. BCG-specific immune responses were detected in macaques vaccinated within a week of birth from six weeks after immunization indicating that neonatal macaques are able to generate a functional cellular response to the vaccine. However, the responses measured were significantly lower than those typically observed following BCG vaccination in adult rhesus macaques and infant profiles were skewed towards the activation and attraction of macrophages and monocytes and the synthesis in addition to release of pro-inflammatory cytokines such as IL-1, IL-6 and TNF-α. The frequency of specific immune cell populations changed significantly through the first three years of life as the infants developed into young adult macaques. Notably, the CD4:CD8 ratio significantly declined as the macaques aged due to a significant decrease in the proportion of CD4+ T-cells relative to a significant increase in CD8+ T-cells. Also, the frequency of both CD4+ and CD8+ T-cells expressing the memory marker CD95, and memory subset populations including effector memory, central memory and stem cell memory, increased significantly as animals matured. Infant macaques, vaccinated with BCG within a week of birth, possessed a significantly higher frequency of CD14+ classical monocytes and granulocytes which remained different throughout the first three years of life compared to unvaccinated age matched animals. These findings, along with the increase in monokines following vaccination in infants, may provide an insight into the mechanism by which vaccination with BCG is able to provide non-specific immunity against non-mycobacterial organisms.

Keywords: BCG; age comparison; immunology; infant; infant vaccination; macaque.


Conflict of interest statement

The authors declare that the research was conducted in the absence of any commercial or financial relationships that could be construed as a potential conflict of interest.

Figures

Figure 1
Figure 1
Study timeline relative to BCG vaccination and immunological analysis. (A) shows the study timeline in which infant rhesus macaques received BCG delivered by intradermal injection (n = 39) within a week of birth (two to seven days after birth) or remained unvaccinated as controls (n = 20). (B) Young adult macaques aged between 3.7 and 5.2 years of age received BCG delivered by intradermal injection at study week 0 (n = 19). Circles represent points relative to vaccination at which clinical examinations were conducted and blood samples collected for application of immunological analyses.
Figure 2
Figure 2
PPD-specific IFN-γ spot forming unit (SFU) frequency measured by ELISPOT following ID BCG vaccination. (A) IFN-γ-specific SFU from BCG vaccinated macaques and unvaccinated macaques during the initial 36 weeks after vaccination. (B) IFN-γ-specific SFU from BCG vaccinated infant (pink) and young adult (blue) macaques during the first 20 weeks after vaccination. Box plots show the group median +/- the inter-quartile range measured at each time point after vaccination, with minimum and maximum values connected by whiskers. Significant differences measured by Mann-Whitney U-test between the groups are indicated. *p ≤ 0.05, **p < 0.01, ****p < 0.0001, NS, not significant. n=39 for BCG vaccinated (pink), n=20 for unvaccinated controls (grey) and n=19 for young adults (blue).
Figure 3
Figure 3
PPD-specific secretion of cytokine, chemokine and growth factor biomarkers measured in whole blood culture supernatant. Box plots (A) show the group median titre of each cytokine, chemokine or growth factor +/- the inter-quartile range measured in naïve (grey) infant macaques or at weeks 12, 16 and 20 after vaccination (pink), with minimum and maximum values connected by whiskers. Box plots (B) show the group median titre of each cytokine, chemokine or growth factor +/- the inter-quartile range measured in naïve infant macaques (pink) or naïve adult macaques (blue) at 12, 16 and 20 weeks after vaccination in each age group, with minimum and maximum values connected by whiskers. Dots represent individual animals. Significant differences measured by Mann-Whitney U-test between the groups are indicated. *p ≤ 0.05, **p < 0.01, ***p < 0.001. (C). Quantity of PPD-specific secretion of cytokine, chemokine and growth factor biomarkers between weeks 12 and 20 (AUC) in stimulated supernatants in macaques vaccinated as infants and adults in a heat map plot. Data was normalized to give a proportional (%) representation of AUC values calculated from the profile of each analyte relative to the maximal amount of each analyte measured.
Figure 4
Figure 4
Age related changes in lymphocyte and memory cell subset populations. Plots (A–D) show the frequency of lymphocytes subsets, (E) proportions of CD4+, CD8+ and CD4+CD8+ lymphocytes (F) CD4+CD95+ and (G) CD8+CD95+ memory cells measured in naïve macaques from infancy (6 weeks of age) through to three years (grey) compared with young adult macaques aged between 3.7 and 5.2 years of age (blue). Box plots show the group median +/- the inter-quartile range, with minimum and maximum values connected by whiskers. Significant differences measured by Wilcoxon matched-pairs rank test or Mann-Whitney U-test between the groups are indicated. *p < 0.05, **p < 0.01, ***p < 0.001, ****p < 0.0001.
Figure 5
Figure 5
PPD-specific cytokine production by CD4 and CD8 memory T-cells. Total PPD-specific cytokine production by CD4+ and CD8+ T-cells. Dots represent the summed frequency of CD4+ (A) and CD8+ (B) T-cells producing IFN-γ, IL-2, TNF-α and IL-17 and CD4+ (C) and CD8+ (D) T-cells producing cytokines IFN-γ, IL-2, TNF-α and IL-17 measured in PBMCs collected from individual infant (pink) and adult (blue) animals prior to and following ID BCG vaccination. Box plots show the group median +/- the inter-quartile range, with minimum and maximum values connected by whiskers. Significant differences measured by Mann-Whitney U-test between the groups are indicated. *p ≤ 0.05, **p < 0.01, ***p < 0.001.
Figure 6
Figure 6
Age related changes in white cell populations measured in whole blood. Plots show the frequency of (A) All lymphocytes, (B) B-cells, (C) activated CD4+ and (D) CD8+ T-cells, (E) NK T-cells, (F) Granulocytes, (G) Neutrophils, (H) Eosinophils, (I) Neutrophil: Lymphocyte (N:L) ratio, (J) All monocytes, (K) Monocyte: Lymphocyte (M:L) ratio, (L) Classical monocytes (M) Intermediate monocytes and (N) Non-classical monocytes. (O) Bars represent median values of monocyte subset populations. (P) Natural killer cells, (Q) CD16+ NK cells, (R) CD16+CD56+ NK cells, (S) CD16-CD56+ NK cells and (T) Bars represent median values of NK cell subsets. Cell frequency populations were measured in naïve macaques from infancy through to three years (grey) compared with young adult macaques aged 3.7 and 5.2 years of age (blue). Box plots show the group median +/- the inter-quartile range, with minimum and maximum values connected by whiskers. Significant differences measured by Wilcoxon matched-pairs rank test or Mann-Whitney U-test between the groups are indicated. *p ≤ 0.05, **p < 0.01, ***p < 0.001.
Figure 7
Figure 7
The effect of BCG on the development of whole blood cell populations in neonatal macaques. Plots show the median frequency of (A) total monocytes, (B) classical monocytes, (C) intermediate monocytes, (D) non-classical monocytes, (E) granulocytes, (F) Total lymphocytes, (G) neutrophil: lymphocyte ratio (N:L) (H) monocyte: lymphocyte ratio (M:L) (I) total natural killer cells (J) CD16+ NK cells (K) CD16+CD56+ NK cells and (L) CD56+ NK cells from infancy (12 weeks of age) through to three years in macaques vaccinated within a week of birth (pink) and unvaccinated age-matched controls (grey). Plots show the group median +/- the inter-quartile range. Significant differences measured by Mann-Whitney U-test between the groups at each time point are indicated in black. *p ≤ 0.05, **p < 0.01.
Figure 8
Figure 8
PPD-induced cytokine production by NK cells and monocytes. Total PPD-induced cytokine production by (A) NK cells and (B) monocytes. Dots represent the AUC of cells producing IFN-γ, IL-2, IL-17, TNF-α and summed frequencies of cytokine producing cells measured in stimulated whole blood collected from individual infant (pink bars) and adult (blue bars) animals between weeks 12 and 20. Plots show the frequency of (C) IFN-γ, (D) IL-2, (E) TNF-α and (F) Total summed cytokine produced by NK cells and (G) IFN-γ and (H) TNF-α produced by monocytes prior to and following ID BCG vaccination. Box plots show the group median +/- the inter-quartile range, with minimum and maximum values connected by whiskers. Significant differences measured by Mann-Whitney U-test between the groups are indicated. *p ≤ 0.05, **p < 0.01.

Similar articles

Cited by

References

    1. Fine PEM. Variation in Protection by BCG: Implications of and for Heterologous Immunity. Lancet (1995) 346(8986):1339–45. doi: 10.1016/S0140-6736(95)92348-9 - DOI - PubMed
    1. Mangtani P, Abubakar I, Ariti C, Beynon R, Pimpin L, Fine PEM, et al. . Protection by BCG Vaccine Against Tuberculosis: A Systematic Review of Randomized Controlled Trials. Clin Infect Dis (2014) 58(4):470–80. doi: 10.1093/cid/cit790 - DOI - PubMed
    1. Demirjian A, Levy O. Safety and Efficacy of Neonatal Vaccination. Eur J Immunol (2009) 39:36–46. doi: 10.1002/eji.200838620 - DOI - PMC - PubMed
    1. Libraty DH, Zhang L, Woda M, Acosta LP, Obcena A, Brion JD, et al. . Neonatal BCG Vaccination Is Associated With Enhanced T-Helper 1 Immune Responses to Heterologous Infant Vaccines. Trials Vaccinol (2014) 3(1):1–5. doi: 10.1016/j.trivac.2013.11.004 - DOI - PMC - PubMed
    1. Beveridge NER, Fletcher HA, Hughes J, Pathan AA, Scriba TJ, Minassian A, et al. . A Comparison of Ifnγ Detection Methods Used in Tuberculosis Vaccine Trials. Tuberculosis (2008) 88(6):631–40. doi: 10.1016/j.tube.2008.06.005 - DOI - PubMed

Publication types

MeSH terms