Review
. 2021 Sep 16;11(20):13723-13743.
doi: 10.1002/ece3.8076. eCollection 2021 Oct.

A brief history and popularity of methods and tools used to estimate micro-evolutionary forces

Affiliations
Review

A brief history and popularity of methods and tools used to estimate micro-evolutionary forces

Jonathan Kidner et al. Ecol Evol. .

Abstract

Population genetics is a field of research that predates the current generations of sequencing technology. Those approaches, that were established before massively parallel sequencing methods, have been adapted to these new marker systems (in some cases involving the development of new methods) that allow genome-wide estimates of the four major micro-evolutionary forces-mutation, gene flow, genetic drift, and selection. Nevertheless, classic population genetic markers are still commonly used and a plethora of analysis methods and programs is available for these and high-throughput sequencing (HTS) data. These methods employ various and diverse theoretical and statistical frameworks, to varying degrees of success, to estimate similar evolutionary parameters making it difficult to get a concise overview across the available approaches. Presently, reviews on this topic generally focus on a particular class of methods to estimate one or two evolutionary parameters. Here, we provide a brief history of methods and a comprehensive list of available programs for estimating micro-evolutionary forces. We furthermore analyzed their usage within the research community based on popularity (citation bias) and discuss the implications of this bias for the software community. We found that a few programs received the majority of citations, with program success being independent of both the parameters estimated and the computing platform. The only deviation from a model of exponential growth in the number of citations was found for the presence of a graphical user interface (GUI). Interestingly, no relationship was found for the impact factor of the journals, when the tools were published, suggesting accessibility might be more important than visibility.

Keywords: drift; migration; mutation; population genetics; selection; software; user bias.


Conflict of interest statement

The authors declare that the research was conducted in the absence of any commercial or financial relationships that could be construed as a potential conflict of interest.

Figures

FIGURE 1
FIGURE 1
Distribution of the programs estimating the various population genetic parameters. While the software suites for estimating mutation, gene flow (migration) and drift can be observed to follow the same distributions (hypergeometric tests, probability of coming from the same distribution p > .5), the same cannot be said of selection (hypergeometric test, p < 10–08). This may suggest that the development of software for detecting selection comes from a different research community compared to the other parameters
FIGURE 2
FIGURE 2
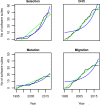
Comparison of linear (green) to exponential (blue) growth of the number of software suites for estimating the various parameters, plotted against the data (black). The data for selection, fit to the nonlinear model better than to the linear (linear‐MSS = 14.42, nonlinear‐MSS = 7.88; n = 38), although this difference is considerably weaker than for the other parameters. For mutation (linear‐MSS = 2.39, nonlinear‐MSS = 6.74; n = 17), migration (linear‐MSS = 3.37, nonlinear‐MSS = 31.43; n = 33) and drift (linear‐MSS = 2.48, nonlinear‐MSS = 26.14; n = 44), the linear models all fit considerably closer to the observed data. These differences are taken to illustrate a more rapid rate of growth in the development of software analyzing/estimating selection, over drift, mutation, and migration
FIGURE 3
FIGURE 3
Log‐normal and log‐series plots of the citation records for the different micro‐evolutionary parameters. In these series, the number of citations reported on ISI web of knowledge site are displayed as dependent on the citation rank. These results are reported as raw counts (a–d), or as plots of the log (to base 10, e–h) for both the dependent and independent variables. From all of these plots, the log‐normal model fits better to the observed data, independent of the parameter the programs estimate. Generally, the log‐series fits data with inflated single observations, here single citations, a situation that is unlikely to be common here. A situation that does not reflect the data where the greatest deviation from the log‐normal was observed (d, h)
FIGURE 4
FIGURE 4
Taylors power law graphs illustrating the relationship between the variance and mean in distribution of citations. Here, the pattern of the citation bias is plotted using the log of the means (to base 10) as a predictor of the variance. With the slope of the temporal variance and mean equal to 2 (the steeper dashed line, in all four graphs), the process of bias in citations follows a simple power law where the variation in citation follows previous frequencies of citation. Hence, alternative factors affecting the distribution of citation bias can be discarded. This relationship is observed for all four population genetic parameters (Mutation, upper‐left; Migration, upper‐right; Drift lower‐left; and Selection, lower‐right)
FIGURE 5
FIGURE 5
Effect of existence of a GUI on the citation rate. The differences in the geometric mean in citation rate according to the presence or absence of a GUI for software for estimating any of the four parameters considered here (mutation, drift, migration, or selection). Much greater range sizes are observed in the citation records for those software suites where a GUI has been developed, with this difference being highly significant (Wilcoxon rank sum test, W = 186, p‐value 4.8 × 10−04, N = 65)

References

    1. Alachiotis, N. , Stamatakis, A. , & Pavlidis, P. (2012). OmegaPlus: A scalable tool for rapid detection of selective sweeps in whole‐genome datasets. Bioinformatics, 28, 2274–2275. 10.1093/bioinformatics/bts419 - DOI - PubMed
    1. Allendorf, F. W. (2016). Genetics and the conservation of natural populations: Allozymes to genomes. Molecular Ecology, 26, 420–430. 10.1111/mec.13948 - DOI - PubMed
    1. Àlvarez, D. , Lourenço, A. , Oro, D. , & Veló‐Anton, G. (2015). Assessment of census (N) and effective population size (Ne) reveals consistency of Ne single‐sample estimators and a high Ne/N ratio in an urban and isolated population of fire salamander. Conservation Genetic Resources, 7, 705–712.
    1. Anderson, E. C. (2005). An efficient Monte Carlo method for estimating Ne from temporally spaced samples using a coalescent‐based likelihood. Genetics, 170, 955–967. 10.1534/genetics.104.038349 - DOI - PMC - PubMed
    1. Anderson, E. C. , Williamson, E. G. , & Thompson, E. A. (2000). Monte Carlo evaluation of the likelihood for Ne from temporally spaced samples. Genetics, 156, 2109–2118. - PMC - PubMed

LinkOut - more resources