. 2021 Sep 26;11(20):14101-14114.
doi: 10.1002/ece3.8123. eCollection 2021 Oct.

Probabilistic early warning signals

Affiliations

Probabilistic early warning signals

Ville Laitinen et al. Ecol Evol. .

Abstract

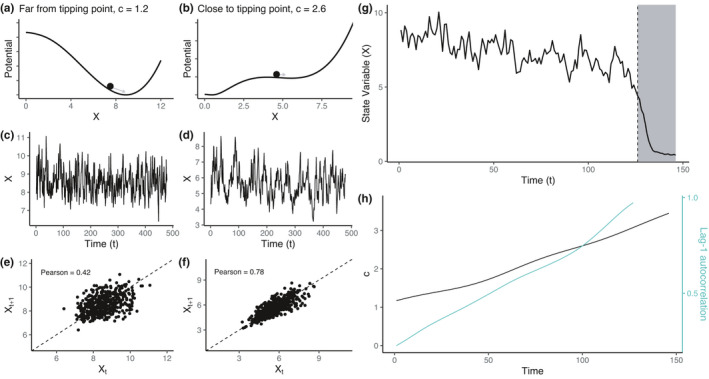
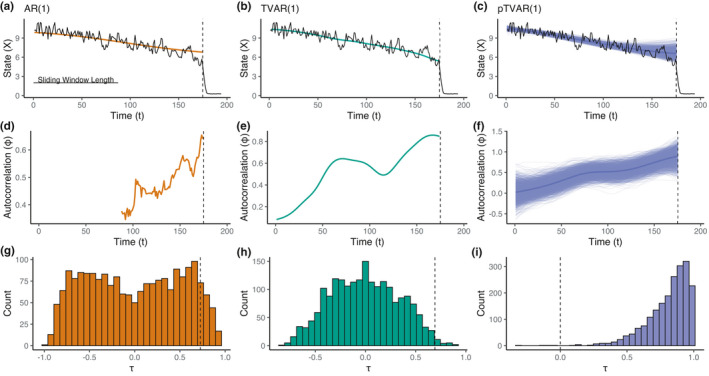
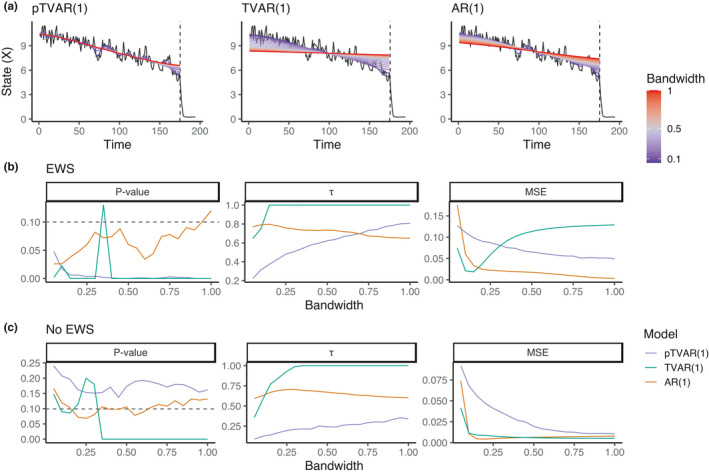
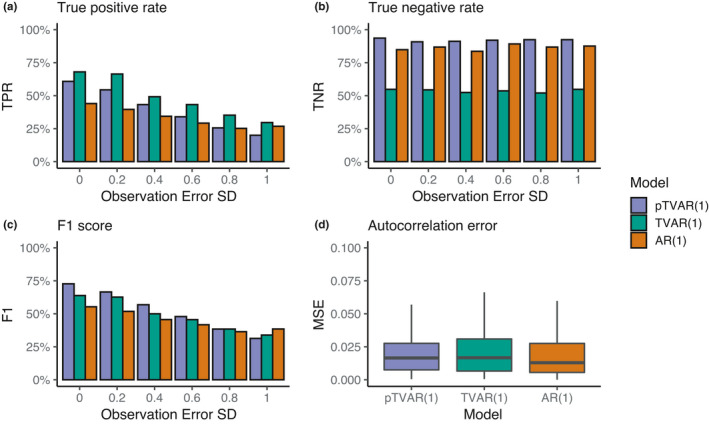
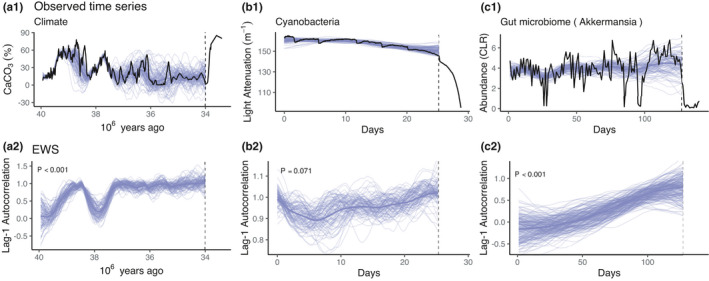
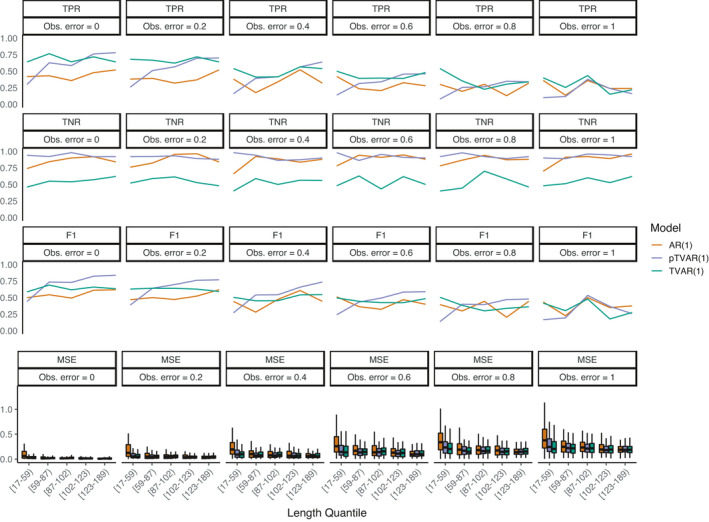
Ecological communities and other complex systems can undergo abrupt and long-lasting reorganization, a regime shift, when deterministic or stochastic factors bring them to the vicinity of a tipping point between alternative states. Such changes can be large and often arise unexpectedly. However, theoretical and experimental analyses have shown that changes in correlation structure, variance, and other standard indicators of biomass, abundance, or other descriptive variables are often observed prior to a state shift, providing early warnings of an anticipated transition. Natural systems manifest unknown mixtures of ecological and environmental processes, hampered by noise and limited observations. As data quality often cannot be improved, it is important to choose the best modeling tools available for the analysis.We investigate three autoregressive models and analyze their theoretical differences and practical performance. We formulate a novel probabilistic method for early warning signal detection and demonstrate performance improvements compared to nonprobabilistic alternatives based on simulation and publicly available experimental time series.The probabilistic formulation provides a novel approach to early warning signal detection and analysis, with enhanced robustness and treatment of uncertainties. In real experimental time series, the new probabilistic method produces results that are consistent with previously reported findings.Robustness to uncertainties is instrumental in the common scenario where mechanistic understanding of the complex system dynamics is not available. The probabilistic approach provides a new family of robust methods for early warning signal detection that can be naturally extended to incorporate variable modeling assumptions and prior knowledge.

Keywords: early warning signals; probabilistic programming.


Conflict of interest statement

All authors declared no conflict of interest.

Figures

FIGURE 1
FIGURE 1
Illustration of increasing lag‐1 autocorrelation prior to a state shift in a complex dynamical system. (a) When the dynamical system is far from a tipping point, the underlying potential landscape has a relatively clear minimum which strongly attracts the system state, represented by the black ball. (b) Close to the tipping point, the potential minimum has become shallow and the attraction is weaker. (c) Time series simulated far from the tipping point resembles white noise whereas closer to it the dynamics have slowed down (d). (e, f) System state mapped against successive time points shows changes in lag‐1 autocorrelation. (g) Time series simulated from an ecological model where a state shift can be observed at the dashed vertical line. (h) The model parameter c (black) is a bifurcation parameter that drives the system toward a tipping point when increased. Lag‐1 autocorrelation estimated from the example time series (green) increases prior to the state shift and signals a heightened risk for transitioning
FIGURE 2
FIGURE 2
Early warning signal detection with simulated data. (a, b, c) The observed system state X as a function of time (black curve). The system gradually approaches a tipping point before a state transition ultimately occurs around the dashed vertical line (T = 175). The colored lines correspond to the estimated time series trend based on the Gaussian kernel smoother applied on the data, the estimated TVAR(1), and the posterior samples of the pTVAR(1) mean parameter. Length of the sliding window was set to 50% of time series length prior to the transition. (d, e, f) Increasing autocorrelation can be observed prior to the state shift with all methods. The figure shows ordinary least squares estimates for autoregressive parameter for the standard (brown) and time‐varying (green) autoregressive models, and the posterior samples and mean for the probabilistic method (purple). (g, h) approximate sampling distributions for the autoregressive parameter trends, τϕ, for AR(1) and TVAR(1) are obtained with surrogate data analysis. Kendall's τϕ quantifies the association strength between the early warning indicator ϕt and time. A significant positive correlation indicates increasing risk of a state shift. The dashed vertical line denotes the point estimate and the proportion of the sampling distribution above it provides the p‐values .095 and .013 for the AR(1) and TVAR(1), respectively. (i) Posterior distribution of τϕ obtained with pTVAR(1). Altogether 99.95% of the posterior samples are positive, providing strong evidence for an increasing trend that is interpreted as an EWS. The probabilistic p value is the proportion of the τ posterior that is not positive. Note that the posterior is not a sampling distribution, which explains the qualitatively different shape of the distribution, compared to g and h
FIGURE 3
FIGURE 3
EWS detection accuracy depends on the smoothing bandwidth. (a) Fit for the observed trend for the probabilistic and comparison models in time series that include an EWS. The fit color indicates the bandwidth as a proportion of time series length, ranging from 0.05 to 1. Only the time points before the dashed vertical line were used in the inference. (b) EWS metrics as a function of bandwidth provide information of the expected true‐positive rate. p‐Values for the two TVAR(1)‐based methods exhibit similar significant ranges although the nonprobabilistic model exhibits some volatility. Increasing autocorrelation trend measured with τ is a standard EWS, here shown as a function of bandwidth. MSE is the mean squared error between the approximated autocorrelation trajectory and posterior mean autocorrelation (purple) or classical point estimates (green, brown) based on the simulation equation (see Methods). (c) EWS metrics for data without EWS provides information of the expected false‐positive rate
FIGURE 4
FIGURE 4
Early warning detection performance in simulated data (with 500 replications) across varying observation error levels. True‐positive rate (a), true‐negative rate (b), and F1 score (c) show the impact of observation error standard deviation on classification performance of early warning signals. (d) Mean squared error between the estimated and approximate autocorrelation trajectories. The MSE are based on data with and without EWS. Outliers have been omitted from the figure for clarity. We computed the approximated autocorrelations using the simulation equations (see Methods)
FIGURE 5
FIGURE 5
Application of the probabilistic EWS to real time series. (a1) The climate data depict sediment CaCO3 levels which have been used as a proxy for the climate (Tripati et al., 2005). (b1) Experimental cyanobacteria data. Sudden relocations to lower abundance levels are due to experimental perturbations. (c1) An example of a gut microbiome time series that displays a state shift. CLR transformed abundance levels of the genus Akkermansia collapse at T = 128. The lag‐1 autocorrelation posteriors in the corresponding lower panels (a2–c2) provide evidence for rising trend at levels p < .001, p = .063 and p < .001 for the climate, cyanobacteria, and gut microbiome time series, respectively. In all figures, the black line displays the data and purple thin lines samples from a posterior, while the thicker line represents the posterior mean. Only the time series data preceding the observed state shift (dashed vertical line) was used in the analysis
FIGURE A1
FIGURE A1
Comparison of EWS detection performance between different autoregressive models as a function of time series length. AR(1) is the standard autoregressive model, TVAR(1) the time‐varying autoregressive model, and pTVAR(1) the probabilistic time‐varying model. The panels depict results for different performance metrics and levels of observation error. TPR, TNR, F1, and MSE correspond to true‐positive rate, true‐negative rate, F1 score, and mean squared error between approximated and inferred autocorrelation trajectories, respectively

References

    1. Arani, B. M. S. , Carpenter, S. R. , Lahti, L. , van Nes, E. H. , & Scheffer, M. (2021). Exit time as a measure of ecological resilience. Science, 372(6547), eaay4895. 10.1126/science.aay4895 - DOI - PubMed
    1. Arkilanian, A. A. , Clements, C. F. , Ozgul, A. , & Baruah, G. (2020). Effect of Time Series Length and Resolution on Abundance‐ and Trait‐Based Early Warning Signals of Population Declines. Ecology, 101(7), e03040. 10.1002/ecy.3040 - DOI - PubMed
    1. Auger‐Méthé, M. , Field, C. , Albertsen, C. M. , Derocher, A. E. , Lewis, M. A. , Jonsen, I. D. , & Mills Flemming, J. (2016). State‐space models’dirty little secrets: even simple linear gaussian models can have estimation problems. Scientific Reports, 6, 26677. 10.1038/srep26677 - DOI - PMC - PubMed
    1. Carpenter, S. R. , & Brock, W. A. (2011). Early warnings of unknown nonlinear shifts: A nonparametric approach. Ecology, 92, 2196–2201. 10.1890/11-0716.1 - DOI - PubMed
    1. Carpenter, S. R. , Cole, J. J. , Pace, M. L. , Batt, R. , Brock, W. A. , Cline, T. , Coloso, J. , Hodgson, J. R. , Kitchell, J. F. , Seekell, D. A. , Smith, L. , & Weidel, B. (2011). Early Warnings of Regime Shifts: A Whole‐Ecosystem Experiment. Science, 332, 1079–1082. 10.1126/science.1203672 - DOI - PubMed