. 2021 Sep 28;11(20):14135-14145.
doi: 10.1002/ece3.8130. eCollection 2021 Oct.

Flyway-scale analysis reveals that the timing of migration in wading birds is becoming later

Affiliations

Flyway-scale analysis reveals that the timing of migration in wading birds is becoming later

Thomas O Mondain-Monval et al. Ecol Evol. .

Abstract

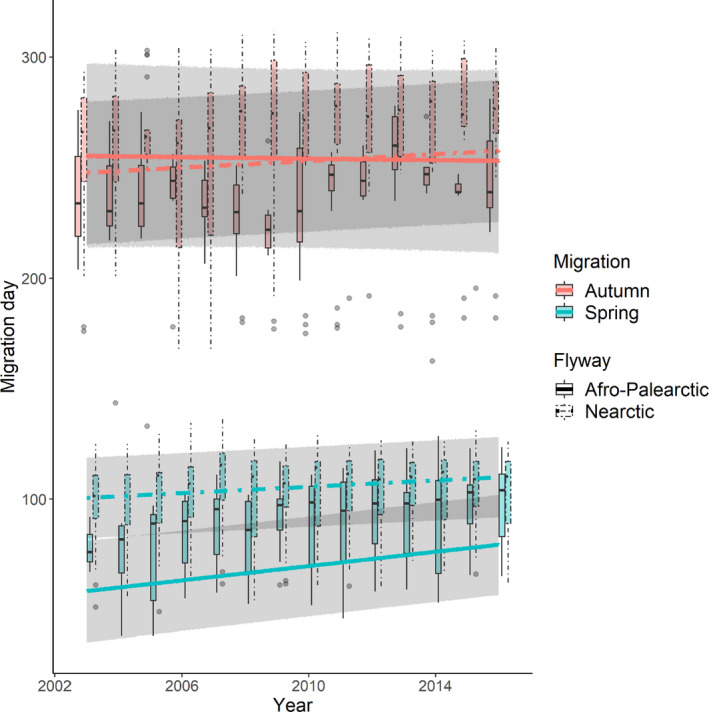
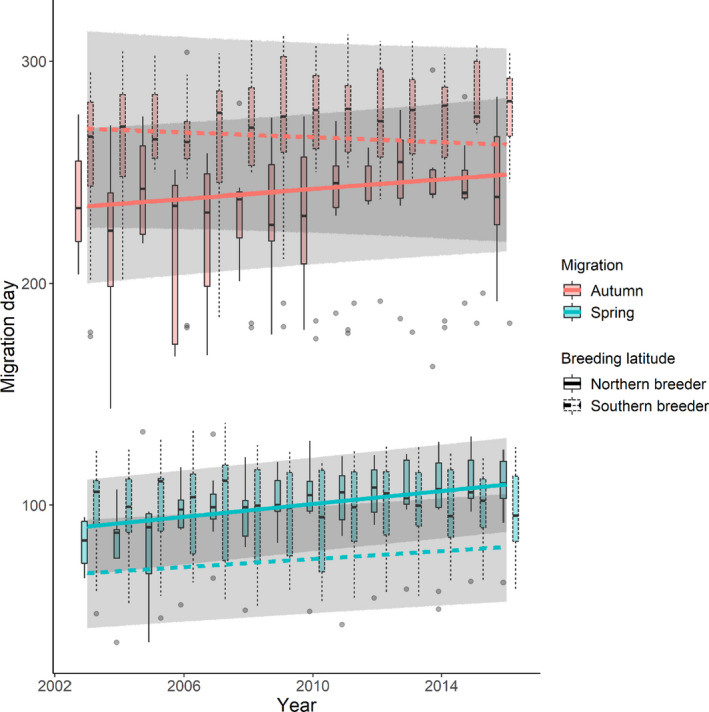
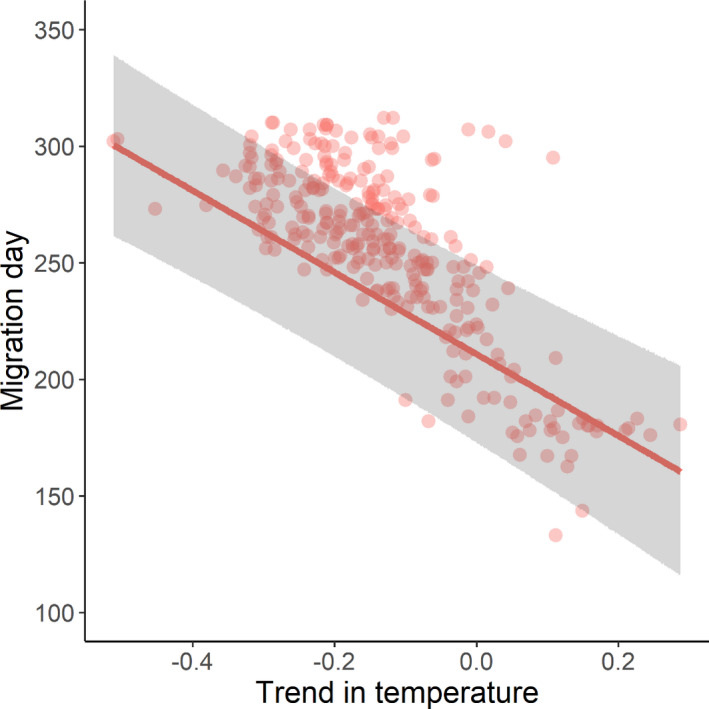
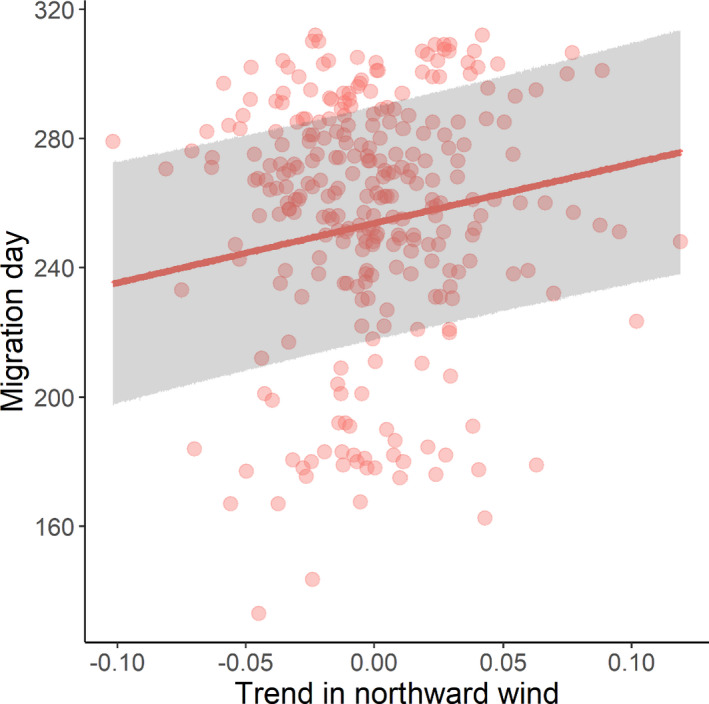
Understanding the implications of climate change for migratory animals is paramount for establishing how best to conserve them. A large body of evidence suggests that birds are migrating earlier in response to rising temperatures, but many studies focus on single populations of model species.Migratory patterns at large spatial scales may differ from those occurring in single populations, for example because of individuals dispersing outside of study areas. Furthermore, understanding phenological trends across species is vital because we need a holistic understanding of how climate change affects wildlife, especially as rates of temperature change vary globally.The life cycles of migratory wading birds cover vast latitudinal gradients, making them particularly susceptible to climate change and, therefore, ideal model organisms for understanding its effects. Here, we implement a novel application of changepoint detection analysis to investigate changes in the timing of migration in waders at a flyway scale using a thirteen-year citizen science dataset (eBird) and determine the influence of changes in weather conditions on large-scale migratory patterns.In contrast to most previous research, our results suggest that migration is getting later in both spring and autumn. We show that rates of change were faster in spring than autumn in both the Afro-Palearctic and Nearctic flyways, but that weather conditions in autumn, not in spring, predicted temporal changes in the corresponding season. Birds migrated earlier in autumn when temperatures increased rapidly, and later with increasing headwinds.One possible explanation for our results is that migration is becoming later due to northward range shifts, which means that a higher proportion of birds travel greater distances and therefore take longer to reach their destinations. Our findings underline the importance of considering spatial scale when investigating changes in the phenology of migratory bird species.

Keywords: birds; climate change; continental scale; eBird; migration; phenology; waders; weather.


Conflict of interest statement

The authors have no conflict of interest to declare.

Figures

FIGURE 1
FIGURE 1
The mean daily latitude of common sandpipers Actitis hypoleucos in the Afro‐Palearctic flyway between 2013 and 2017 and a comparison of the migration days identified by the two changepoint detection methods, mean, and mean and variance combined
FIGURE 2
FIGURE 2
Factors affecting the timing of spring and autumn migration. Positive values of the estimate indicate migration getting later and negative values migration getting earlier. The factors are depicted as the averaged estimates of fixed effects from the models within 2 AICc of the best‐fitting LME. Only variables that were deemed important after model averaging are shown here for clarity; for the full model outputs, see Tables S2 and S3. Horizontal error bars show the standard errors. If a circle and associated error bars do not appear for either spring or autumn migration, this means that the variable was not present in the best‐fitting model list. The intercepts of the models were 75.3 days in spring and 238.8 days in autumn, but were excluded for clarity. Breed lat = breeding latitude index; Winter lat = wintering latitude index
FIGURE 3
FIGURE 3
Changes in the timing of spring and autumn migration over time for fifty species of wader, in the Afro‐Palearctic and Nearctic flyways. Boxplots are the distribution of the raw migration day data, which show the median, interquartile range, 1.5 times the interquartile range, and any outliers. Lines show the model averaged predicted relationship from the models within 2 AICc of the best‐fitting LMEs. The ribbons show the 95% prediction intervals of the model averaged fixed effects
FIGURE 4
FIGURE 4
Changes in timing of spring and autumn migration over time for species breeding at northern (58°N) and southern (42°N) latitudes. Boxplots are the distribution of the raw migration day data, which show the median, interquartile range, 1.5 times the interquartile range, and any outliers. Lines show the model averaged predicted relationship from the models within 2 AICc of the best‐fitting LMEs. The ribbons show the 95% prediction intervals of the model averaged fixed effects
FIGURE 5
FIGURE 5
Relationship between the timing of autumn migration and changes in temperature. The x‐axis is the slope from the linear least‐squares regression. Closed circles show the raw data; the line shows the model averaged predicted relationship from the models within 2 AICc of the best‐fitting LME. The ribbon shows the 95% prediction intervals of the model averaged fixed effects. Trend in temperature data are the slopes of linear least‐squares regressions of temperature against day of the year for the twenty‐day window surrounding a migration day
FIGURE 6
FIGURE 6
Relationship between the timing of autumn migration and changes in northward winds. The x‐axis is the slope from the linear least‐squares regression. Circles show the raw data; the line is the model averaged predicted relationship from the models within 2 AICc of the best‐fitting LME. The ribbon shows the 95% prediction interval of the model averaged fixed effects. Trend in northward wind data are the slopes of linear least‐squares regressions of temperature against day of the year for the twenty‐day window surrounding a migration day

References

    1. Adamík, P. , & Pietruszková, J. (2008). Advances in spring but variable autumnal trends in timing of inland wader migration. Acta Ornithologica, 43(2), 119–128. 10.3161/000164508X395225 - DOI
    1. AEWA (2018). Report on the conservation status of migratory waterbirds in the agreement area. Retrieved from Durban, South Africa.
    1. Åkesson, S. , Bianco, G. , & Hedenström, A. (2016). Negotiating an ecological barrier: Crossing the Sahara in relation to winds by common swifts. Philosophical Transactions of the Royal Society B: Biological Sciences, 371(1704), 20150393. - PMC - PubMed
    1. Åkesson, S. , & Hedenström, A. (2000). Wind selectivity of migratory flight departures in birds. Behavioral Ecology and Sociobiology, 47(3), 140–144. 10.1007/s002650050004 - DOI
    1. Andersen, T. , Carstensen, J. , Hernandez‐Garcia, E. , & Duarte, C. M. (2009). Ecological thresholds and regime shifts: Approaches to identification. Trends in Ecology & Evolution, 24(1), 49–57. 10.1016/j.tree.2008.07.014 - DOI - PubMed

LinkOut - more resources