. 2022 Feb 1;43(2):816-832.
doi: 10.1002/hbm.25690. Epub 2021 Oct 28.

Mental health in the UK Biobank: A roadmap to self-report measures and neuroimaging correlates

Affiliations

Mental health in the UK Biobank: A roadmap to self-report measures and neuroimaging correlates

Rosie K Dutt et al. Hum Brain Mapp. .

Abstract

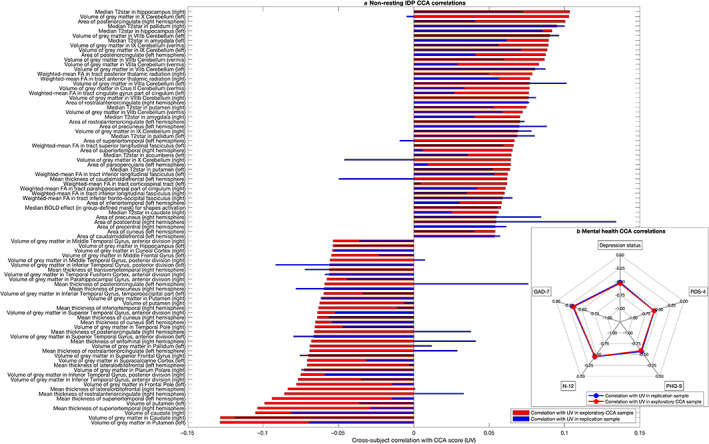
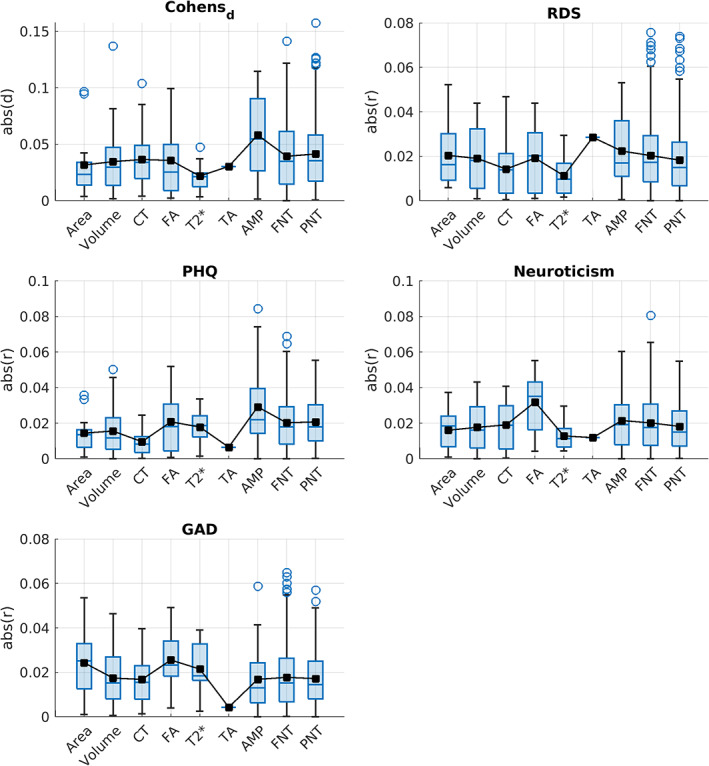
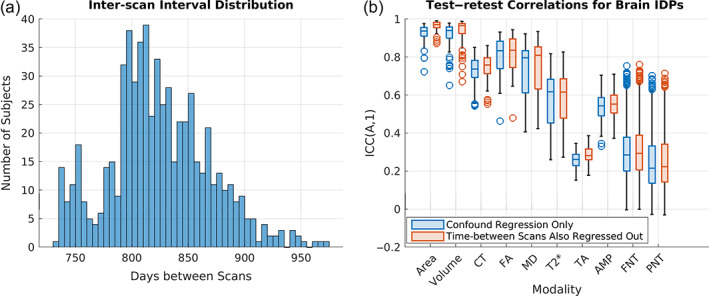
The UK Biobank (UKB) is a highly promising dataset for brain biomarker research into population mental health due to its unprecedented sample size and extensive phenotypic, imaging, and biological measurements. In this study, we aimed to provide a shared foundation for UKB neuroimaging research into mental health with a focus on anxiety and depression. We compared UKB self-report measures and revealed important timing effects between scan acquisition and separate online acquisition of some mental health measures. To overcome these timing effects, we introduced and validated the Recent Depressive Symptoms (RDS-4) score which we recommend for state-dependent and longitudinal research in the UKB. We furthermore tested univariate and multivariate associations between brain imaging-derived phenotypes (IDPs) and mental health. Our results showed a significant multivariate relationship between IDPs and mental health, which was replicable. Conversely, effect sizes for individual IDPs were small. Test-retest reliability of IDPs was stronger for measures of brain structure than for measures of brain function. Taken together, these results provide benchmarks and guidelines for future UKB research into brain biomarkers of mental health.

Keywords: UK Biobank; brain correlates; depression; mental health; replication; test-retest.


Figures

FIGURE 1
FIGURE 1
UK Biobank subject inclusion chart
FIGURE 2
FIGURE 2
Schematic overview of the acquisition timing of UK Biobank mental health measures in relation to imaging acquisition. Mental health measures in light green were obtained on the day of scanning, whereas mental health measures in light blue were obtained at an independent time point that varied from 1,185 days before to 964 days after scan 1 across participants. The range of possible scores for each mental health measure is included. All five measures were included in neuroimaging and questionnaire comparison analyses in this article
FIGURE 3
FIGURE 3
(a) Spearman rank correlation coefficients between each pair of mental health measures. Variables measured on the same date are labeled the same color (green = assessment center day‐of‐scan information; blue = online questionnaire). (b) Distributions of scores for subjects with probable depression status (pink) and without probable depression status (cyan). Subjects with probably depression status scores significantly higher on all mental health measures (KS‐statistic χ0.19,p1048)
FIGURE 4
FIGURE 4
Panels (a)–(d) are the distributions of scores for participant responses to each questionnaire. Panels (e)–(g) depict the equipercentile linkages of the scores for each questionnaire, mapping the equivalence of a score from one questionnaire to the score of the other questionnaire
FIGURE 5
FIGURE 5
Canonical correlation results. (a) Post‐hoc correlations for nonresting (structural and task) IDPs, showing only significant IDPs after Bonferroni correction. A similar figure for the resting state IDPs is included in Figure S2. (b) (inset): Post‐hoc CCA relations for mental health show that the first canonical covariate is broadly linked to affect‐based mental health
FIGURE 6
FIGURE 6
Effect sizes are shown for the grouped brain variables of structural (Area, Volume, Cortical Thickness, Fractional Anisotropy, and T2*) and functional (Task Activity, Amplitude, Full Network connectivity matrix, and Partial Network Connectivity Matrix) modalities. Blue boxes indicate the middle 50% of the data (i.e., the range between the first and third quartile), and small black squares and blue lines inside each box represent the mean and median values, respectively. Outliers for each grouped brain IDP are shown as blue circles, which are above the 1.5 times of inter‐quartile range (IQR), indicated by the whiskers extending from the boxes. For detailed assessments of effect sizes in specific IDPs, refer to Figures S3–S7
FIGURE 7
FIGURE 7
Test–retest analyses. (a) The histogram shows the inter‐scan interval distribution for the 624 subjects included in these analyses. The x‐axis shows days between scans, and the y‐axis shows the number of subjects. (b) The boxplots show the ICCs obtained using brain IDPs after standard confound regression (blue) versus ICCs obtained using brain IDPs after standard confound regression plus regressing out effects of inter‐scan interval length (orange). IDP measurement modality categories are organized along the x‐axis, and the y‐axis shows ICC values (see also Figure S8)

References

    1. Alfaro‐Almagro, F. , McCarthy, P. , Afyouni, S. , Andersson, J. L. R. , Bastiani, M. , Miller, K. L. , … Smith, S. M. (2021). Confound modelling in UK Biobank brain imaging. NeuroImage, 224, 117002. - PMC - PubMed
    1. Andreescu, C. , Gross, J. J. , Lenze, E. , Edelman, K. D. , Snyder, S. , Tanase, C. , & Aizenstein, H. (2011). Altered cerebral blood flow patterns associated with pathologic worry in the elderly. Depression and Anxiety, 28, 202–209. 10.1002/da.20799 - DOI - PMC - PubMed
    1. Barch, D. M. , Burgess, G. C. , Harms, M. P. , Petersen, S. E. , Schlaggar, B. L. , Corbetta, M. , … WU‐Minn HCP Consortium . (2013). Function in the human connectome: Task‐fMRI and individual differences in behavior. NeuroImage, 80, 169–189. 10.1016/j.neuroimage.2013.05.033 - DOI - PMC - PubMed
    1. Bijsterbosch, J. D. , Woolrich, M. W. , Glasser, M. F. , Robinson, E. C. , Beckmann, C. F. , Van Essen, D. C. , … Smith, S. M. (2018). The relationship between spatial configuration and functional connectivity of brain regions. eLife, 7, e32992. 10.7554/eLife.32992 - DOI - PMC - PubMed
    1. Bluhm, R. , Williamson, P. , Lanius, R. , Théberge, J. , Densmore, M. , Bartha, R. , … Osuch, E. (2009). Resting state default‐mode network connectivity in early depression using a seed region‐of‐interest analysis: Decreased connectivity with caudate nucleus. Psychiatry and Clinical Neurosciences, 63, 754–761. 10.1111/j.1440-1819.2009.02030.x - DOI - PubMed

Publication types