. 2022 Jan;9(1):e2103005.
doi: 10.1002/advs.202103005. Epub 2021 Oct 28.

Implantable Electrical Stimulation at Dorsal Root Ganglions Accelerates Osteoporotic Fracture Healing via Calcitonin Gene-Related Peptide

Affiliations

Implantable Electrical Stimulation at Dorsal Root Ganglions Accelerates Osteoporotic Fracture Healing via Calcitonin Gene-Related Peptide

Jie Mi et al. Adv Sci (Weinh). 2022 Jan.

Abstract

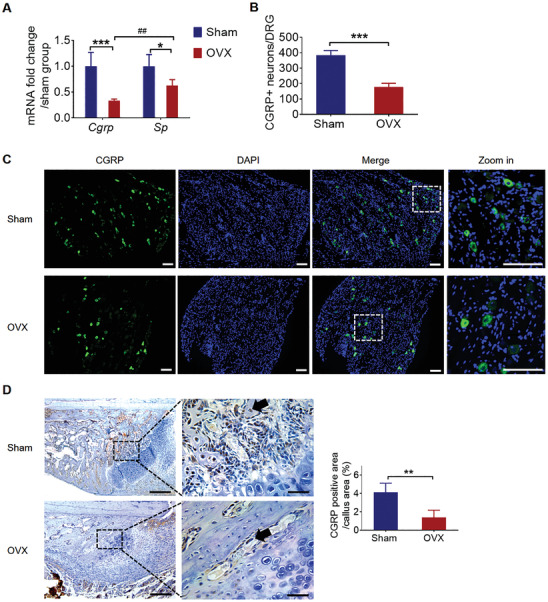
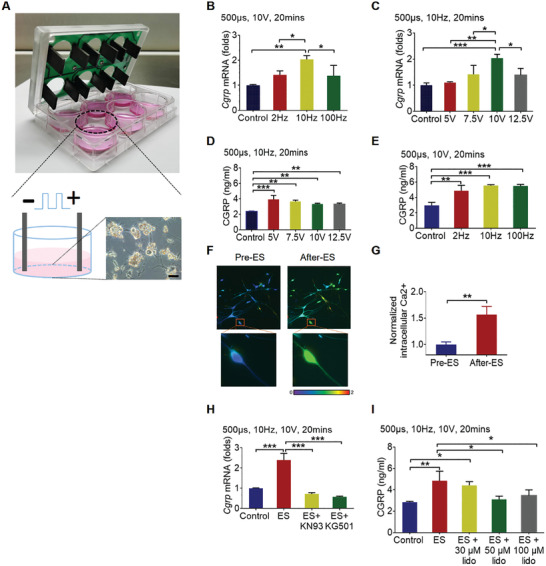
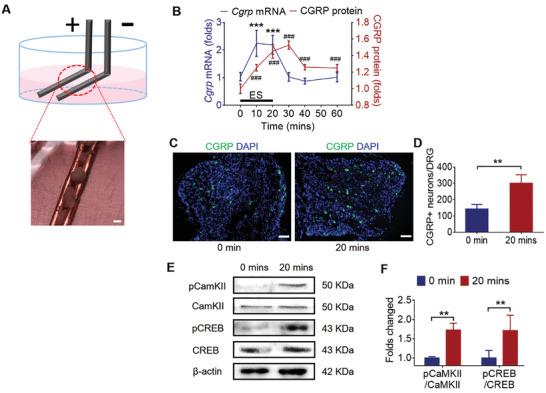
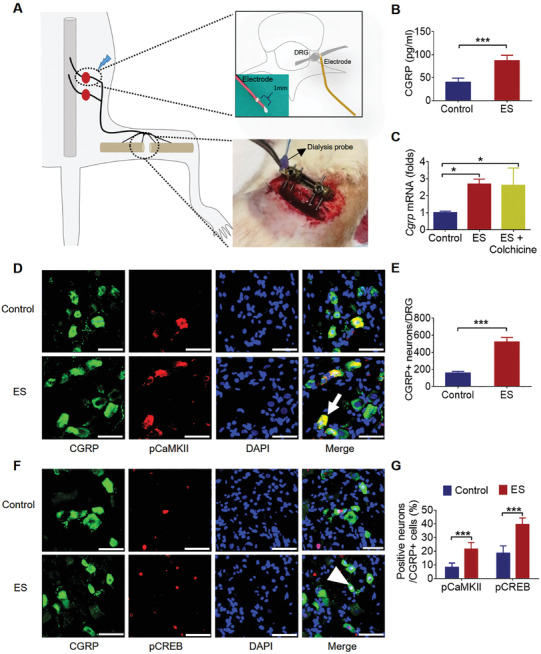
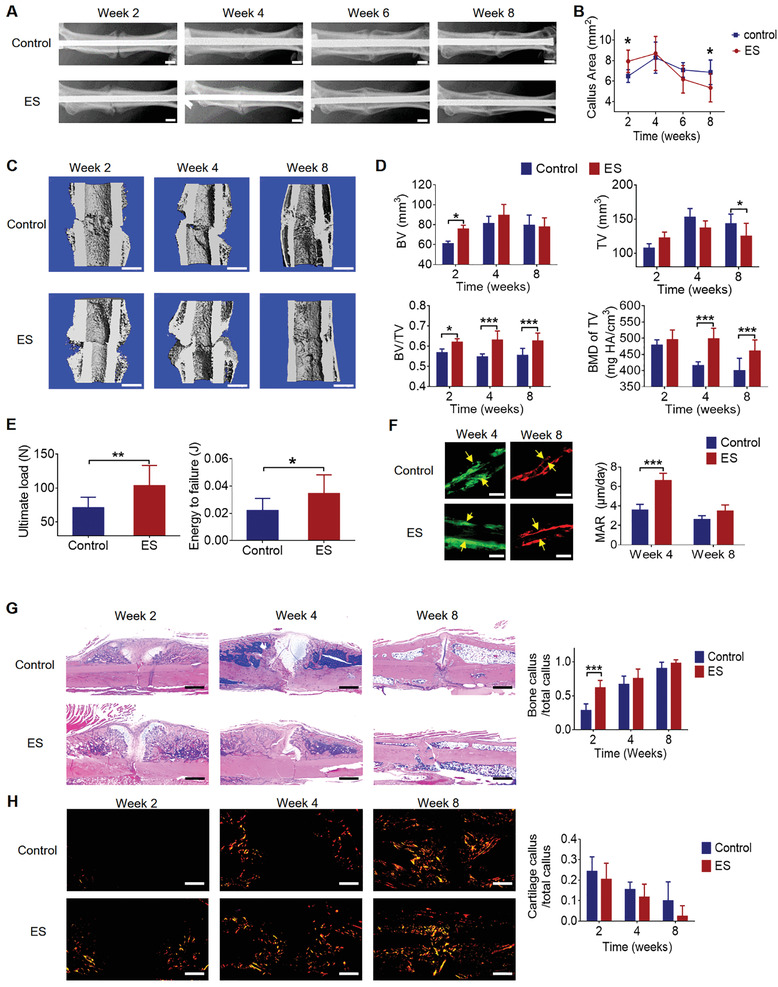
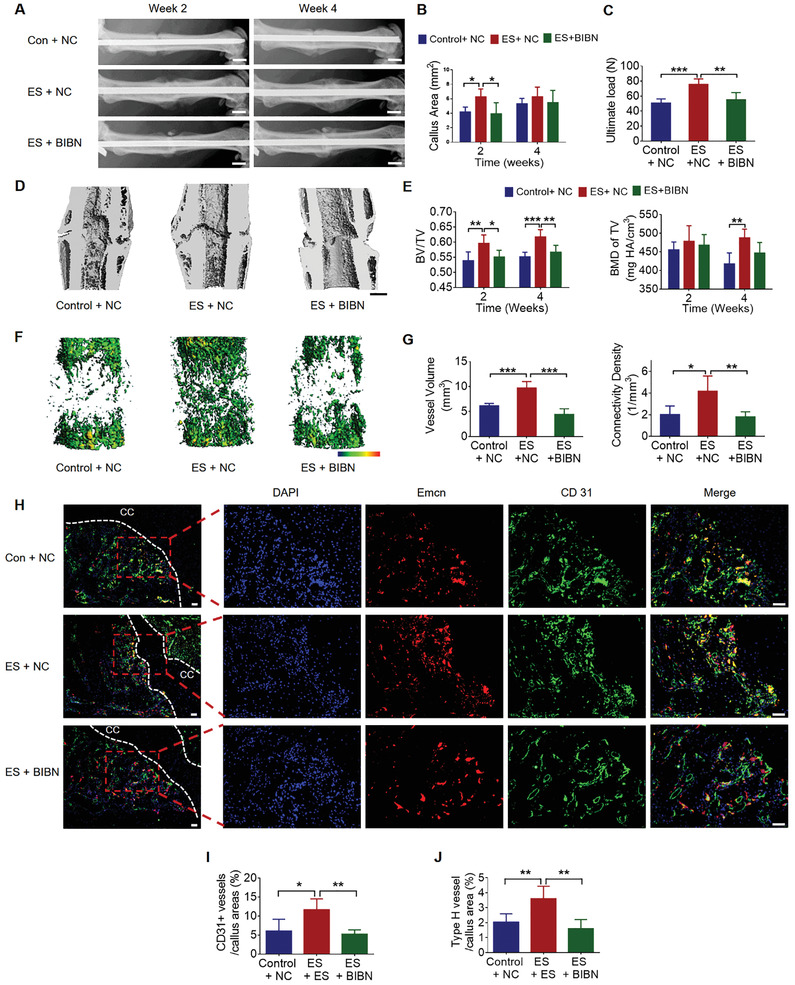
The neuronal engagement of the peripheral nerve system plays a crucial role in regulating fracture healing, but how to modulate the neuronal activity to enhance fracture healing remains unexploited. Here it is shown that electrical stimulation (ES) directly promotes the biosynthesis and release of calcitonin gene-related peptide (CGRP) by activating Ca2+ /CaMKII/CREB signaling pathway and action potential, respectively. To accelerate rat femoral osteoporotic fracture healing which presents with decline of CGRP, soft electrodes are engineered and they are implanted at L3 and L4 dorsal root ganglions (DRGs). ES delivered at DRGs for the first two weeks after fracture increases CGRP expression in both DRGs and fracture callus. It is also identified that CGRP is indispensable for type-H vessel formation, a biological event coupling angiogenesis and osteogenesis, contributing to ES-enhanced osteoporotic fracture healing. This proof-of-concept study shows for the first time that ES at lumbar DRGs can effectively promote femoral fracture healing, offering an innovative strategy using bioelectronic device to enhance bone regeneration.

Keywords: CGRP; bone regeneration; dorsal root ganglions; electrical stimulation.


Conflict of interest statement

The authors declare no conflict of interest.

Figures

Figure 1
Figure 1
Decreased CGRP expression in DRGs and callus during osteoporotic fracture healing. A) The mRNA level of Cgrp and Sp in DRGs at week 2 in sham and OVX group (mean ± SD, two‐way ANOVA with Bonferroni tests, *P < 0.05 and ***P < 0.001 comparison between sham and OVX group, unpaired Student's t‐test, ## P < 0.01 comparison between CGRP and SP in OVX group. n = 4 per group per time point). B) Quantification and C) representative images of CGRP positive neurons in DRGs at week 2 in sham and OVX group (mean ± SD, unpaired Student's t‐test, ***P < 0.001, n = 5 per group). Scale bar: 100 µm. D) Representative images and E) quantification of CGRP positive area (black arrows) in fracture callus at week 2 in sham and OVX group (mean ± SD, unpaired Student's t‐test, **P < 0.01, n = 5 per group). Scale bar: 50 µm (left row) and 200 µm (right row).
Figure 2
Figure 2
ES upregulated CGRP biosynthesis and triggered its release in vitro. A) The ES setup for DRG neurons. DRG neurons were seeded on laminin and poly‐d‐lysine hydrobromidecoated 6‐well plate, and electrical pulse was generated by C‐Pace stimulator. Cgrp mRNA in neurons and CGRP protein in culture medium were quantified immediately after stimulation. B–E) Cgrp mRNA and CGRP protein level after ES with different frequencies and voltages (mean ± SD, one‐way ANOVA with Tukey's tests, *P < 0.05, **P < 0.01, and ***P < 0.001, n = 3 per group). F) Intracellular Ca2+ was monitored by laser confocal microscopy with the fluorescent Ca2+ indicator Fluo‐4 AM. G) The intracellular Ca2+ after stimulation, normalized to that before stimulation (mean ± SD, unpaired Student's t‐test, **P < 0.01, n = 3 per group). H) Cgrp mRNA and I) CGRP protein level after ES with indicated drugs treatment (mean ± SD, one‐way ANOVA with Tukey's tests, *P < 0.05, **P < 0.01, and ***P < 0.001, n = 3 per group).
Figure 3
Figure 3
Design and verification of the implantable electrodes in vitro. A) Schematic of the stimulation setup for DRG tissue. The DRGs isolated from osteoporotic rats were placed between the two paralleled platinum electrodes, and electrical pulse stimulation was applied through the electrodes. Scale bar: 2 mm. B) The dynamic CGRP expression at mRNA and protein level was quantified after ES (normalized to 0 min, mean ± SD, one‐way ANOVA with Tukey's tests, ***P < 0.001 as compared to the mRNA level before ES, ### P < 0.001 as compared to the protein level before ES, n = 4 per group). C,D) Representative images and quantification of CGRP positive neurons in DRGs at 0 and 20 min after ES (mean ± SD, unpaired Student's t‐test, **P < 0.01, n = 4 per group). Scale bar: 50 µm. E,F) Western blot analysis of pCaMKII, CaMKII, pCREB, and CREB expression in DRGs after ES (normalized to 0 min, mean ± SD, two‐way ANOVA with Bonferroni tests, **P < 0.01, n = 4 per group).
Figure 4
Figure 4
ES at DRGs promoted the synthesis and release of CGRP in vivo. A) Schematic of the stimulation setup in vivo and the dialysis system for collecting protein from fracture site. Two soft electrodes were implanted at L3 and L4 DRGs and a bone defect was created at femur for inserting a dialysis probe. B) CGRP concentration in the bone defect regions of control and ES group (mean ± SD, unpaired Student's t‐test, ***P < 0.001, n = 4 per group). C) Cgrp mRNA levels in the DRGs of the control, ES, ES + colchicine group (mean ± SD, one‐way ANOVA with Tukey's tests, *P < 0.05, n = 4 per group). D,F) Representative immunofluorescent staining showing the colocalization of CGRP positive neurons with pCaMKII (white arrow) and pCREB (white arrowhead) in the DRGs with or without ES treatment. Scale bar: 50 µm. E,G) Quantification of CGRP positive neurons and the percentages of pCaMKII positive and pCREB positive in CGRP positive neurons of ES group as compared to that of the control group (mean ± SD, unpaired Student's t‐test for (E), two‐way ANOVA with Bonferroni tests for (G), ***P < 0.001, n = 5 per group).
Figure 5
Figure 5
ES at DRGs accelerated osteoporotic fracture healing. A) Representative radiographs of fractured rat femora from ES group and the control group. Scale bar: 2 mm. B) Quantification of the callus area (mean ± SD, two‐way ANOVA with Bonferroni tests, *P < 0.05, n = 10 per group). C) Micro‐CT 3D reconstruction and D) quantitative measurements of TV, BV, BV/TV, and BMD of TV at week 2, 4, and 8 in control and ES group (mean ± SD, two‐way ANOVA with Bonferroni tests, *P < 0.05 and ***P < 0.001, n = 5 per group at week 2 and 4, n = 10 per group at week 8). Scale bar: 2 mm. E) Ultimate load and energy to failure of the fractured rat femora at week 8 in the control and ES group (mean ± SD, unpaired Student's t‐test, *P < 0.05 and **P < 0.01, n = 10 per group). F) Calcein green/xylenol orange labeling and comparison of MAR between ES and the control group at week 4 and 8 (mean ± SD, two‐way ANOVA with Bonferroni tests, ***P < 0.001, n = 5 per group). Scale bar: 5 µm. G) H&E staining and quantification of bone and cartilage fraction in callus at week 2, 4, and 8 in ES and the control group (mean ± SD, two‐way ANOVA with Bonferroni tests, ***P < 0.001, n = 5 per group). Scale bar: 1 mm. H) Representative images of polarized light at week 2, 4, and 8 in ES and the control group. Scale bar: 1 mm.
Figure 6
Figure 6
CGRP mediated type‐H vessel formation in ES enhanced fracture healing. A) Representative radiographs of the individual groups at week 2 and week 4. Scale bar: 2 mm. B) Quantification of the callus size (mean ± SD, two‐way ANOVA with Bonferroni tests, *P < 0.05, n = 5 per group). C) Ultimate load of the fractured rat femora at week 4 (mean ± SD, one‐way ANOVA with Tukey's test, **P < 0.01 and ***P < 0.001, n = 5 per group). D) 3D reconstruction and E) micro‐CT measurements of BV/TV and BMD of TV of the fractured rat femora at week 2 and 4 of individual groups (mean ± SD, two‐way ANOVA with Bonferroni tests, *P < 0.05, **P < 0.01, and ***P < 0.001, n = 5 per group). Scale bar: 2 mm. F) Representative 3D reconstructed images of the newly formed vessel around fracture line at week 2. G) Vessel volume and connectivity density were quantified by micro‐CT (mean ± SD, one‐way ANOVA with Tukey's test, *P < 0.05, **P < 0.01, and ***P < 0.001, n = 5 per group). H) Representative immunofluorescent double staining of CD31 and endomucin at week 2 after fracture. CC: cartilage callus. Scale bar: 100 µm. I) Quantification of CD31 positive vessel and J) type‐H vessel among fracture callus area (mean ± SD, one‐way ANOVA with Tukey's test, *P < 0.05 and **P < 0.01, n = 5 per group).

Similar articles

Cited by

References

    1. Ortman B. J. M., Velkoff V. A., Hogan H. U.S. Census Bureau. 2014, 25.
    1. Hoi W., Miclau T., Chow S. K., Yang F. F., Alt V., Injury 2016, 47, S21. - PubMed
    1. Kyllönen L., D'Este M., Alini M., Eglin D., Acta Biomater. 2015, 11, 412. - PubMed
    1. Sun X., Li X., Qi H., Hou X., Zhao J., Yuan X., Ma X., J. Orthop. Translat. 2020, 24, 76. - PMC - PubMed
    1. Hou Y., Lin W., Li Y., Sun Y., Liu Y., Chen C., Jiang X., Li G., Xu L., J. Orthop. Translat. 2020, 27, 25. - PMC - PubMed

Publication types

MeSH terms

Substances