. 2021 Dec 6;218(12):e20192070.
doi: 10.1084/jem.20192070. Epub 2021 Oct 28.

Chronic viral infections persistently alter marrow stroma and impair hematopoietic stem cell fitness

Affiliations

Chronic viral infections persistently alter marrow stroma and impair hematopoietic stem cell fitness

Stephan Isringhausen et al. J Exp Med. .

Abstract

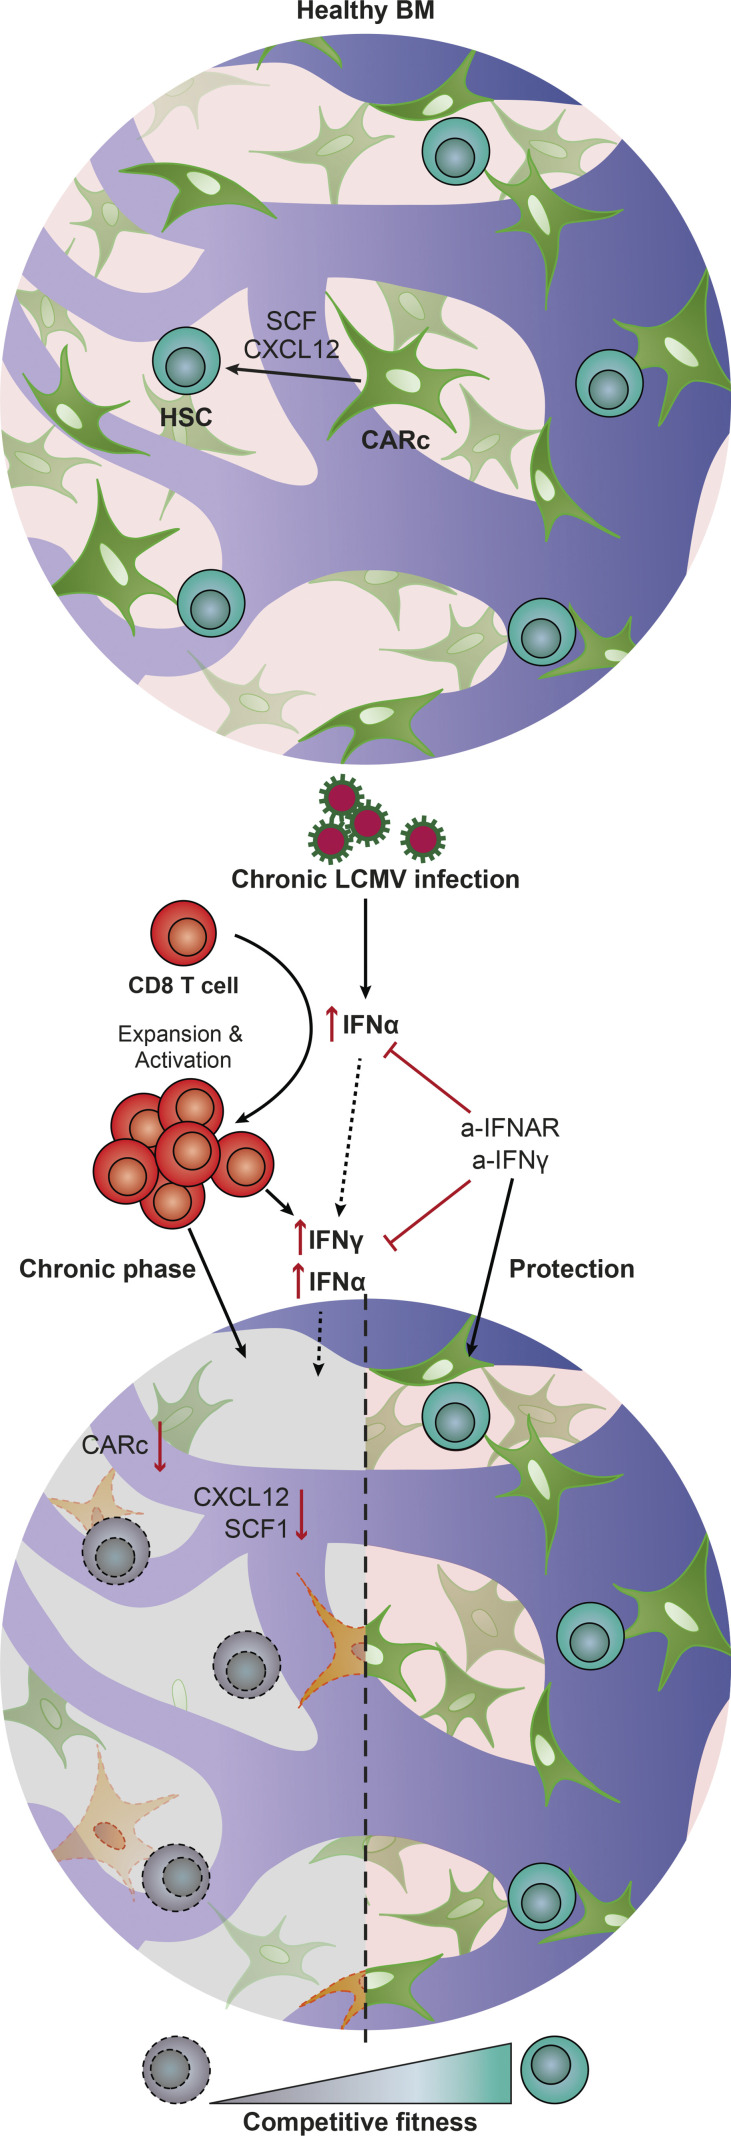
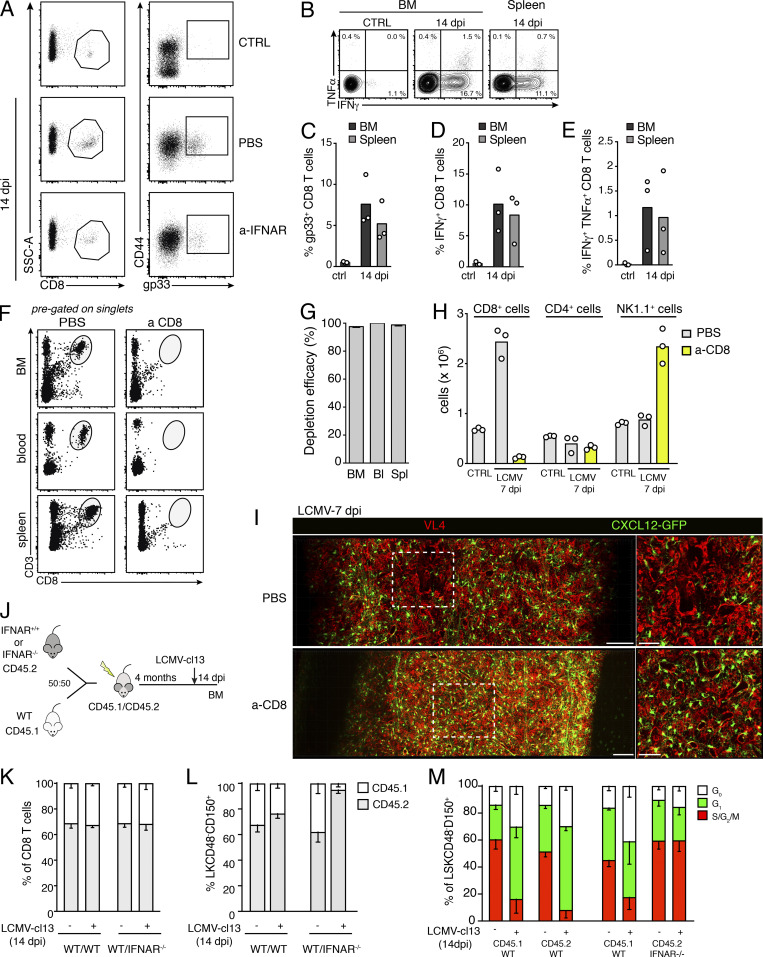
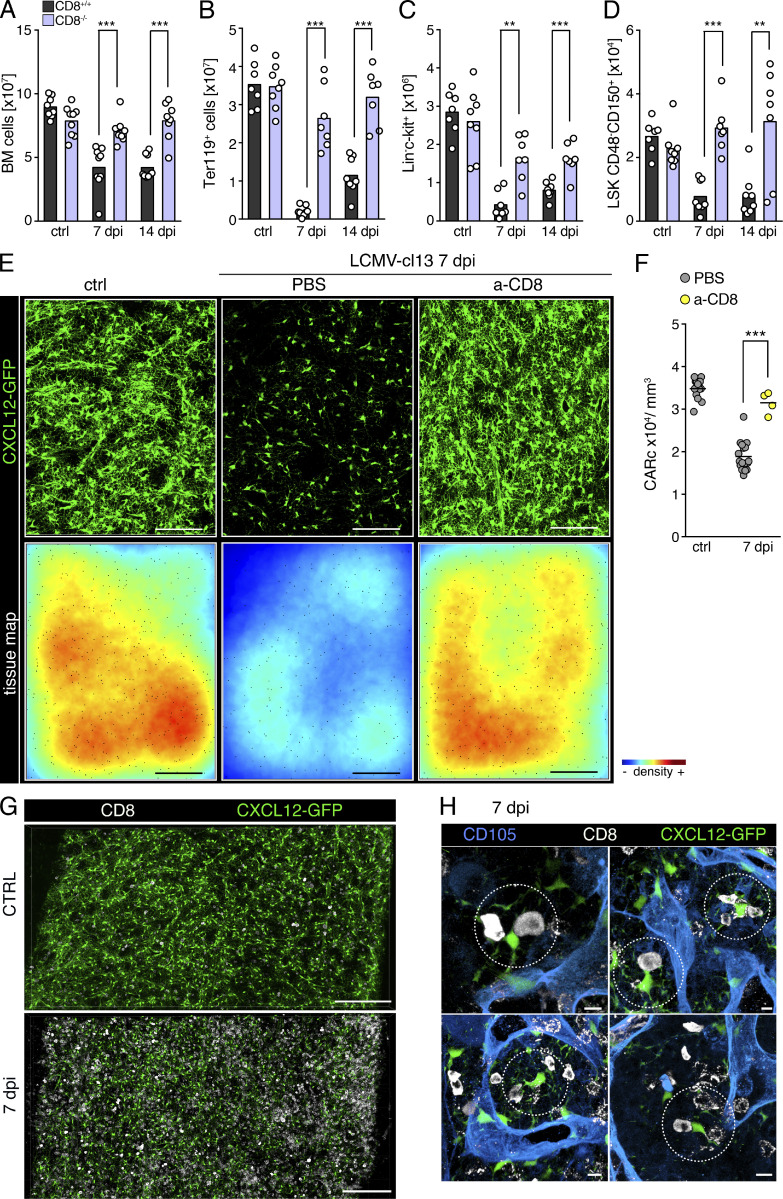
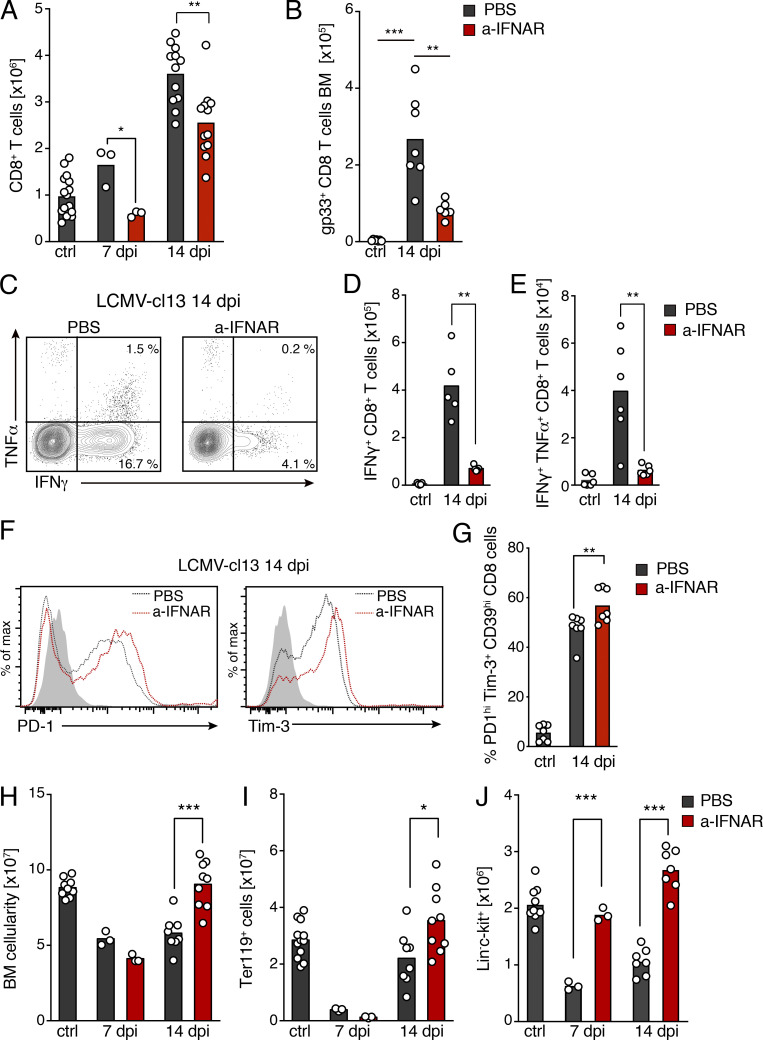
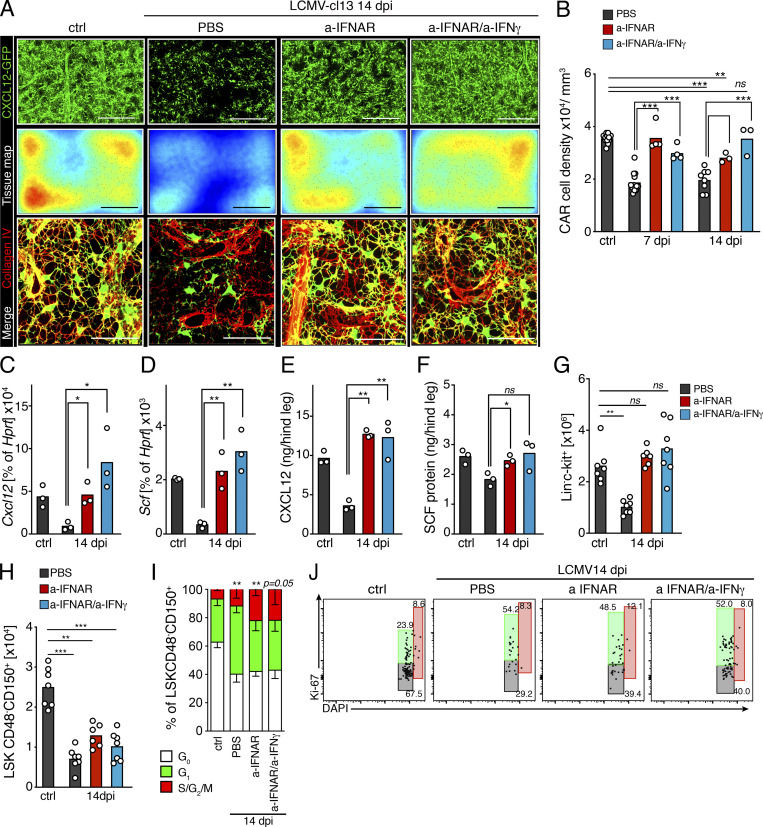
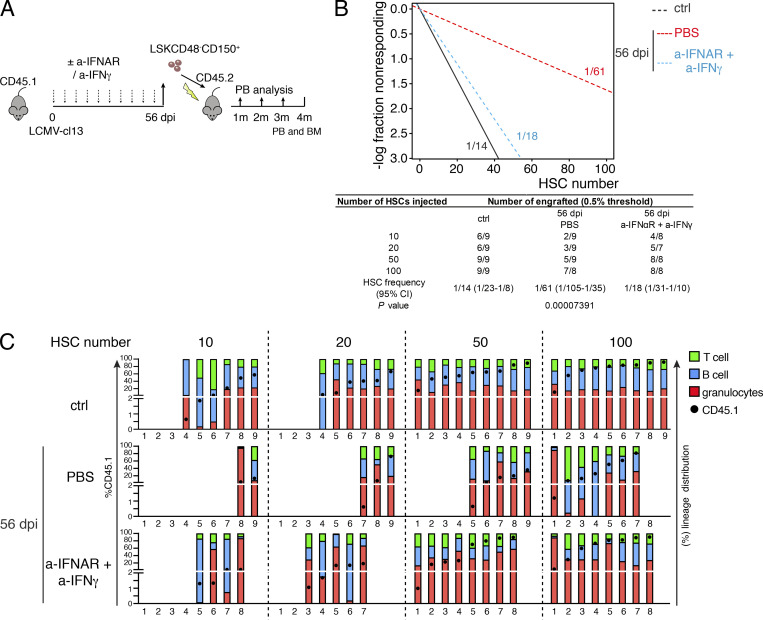
Chronic viral infections are associated with hematopoietic suppression, bone marrow (BM) failure, and hematopoietic stem cell (HSC) exhaustion. However, how persistent viral challenge and inflammatory responses target BM tissues and perturb hematopoietic competence remains poorly understood. Here, we combine functional analyses with advanced 3D microscopy to demonstrate that chronic infection with lymphocytic choriomeningitis virus leads to (1) long-lasting decimation of the BM stromal network of mesenchymal CXCL12-abundant reticular cells, (2) proinflammatory transcriptional remodeling of remaining components of this key niche subset, and (3) durable functional defects and decreased competitive fitness in HSCs. Mechanistically, BM immunopathology is elicited by virus-specific, activated CD8 T cells, which accumulate in the BM via interferon-dependent mechanisms. Combined antibody-mediated inhibition of type I and II IFN pathways completely preempts degeneration of CARc and protects HSCs from chronic dysfunction. Hence, viral infections and ensuing immune reactions durably impact BM homeostasis by persistently decreasing the competitive fitness of HSCs and disrupting essential stromal-derived, hematopoietic-supporting cues.


Conflict of interest statement

Disclosures: The authors declare no competing interests exist.

Figures

None
Graphical abstract
Figure 1.
Figure 1.
Chronic infection with LCMV-cl13 disrupts BM hematopoiesis and leads to long-term impairment of HSC function. (A and B) FC-based quantification of total BM cellularity (A) and Ter-119+ BM erythroid progenitors (B) after infections with 2 × 10⁶ ffu LCMV-cl13. (C) Representative pictures of thick femoral slices of uninfected control (ctrl) or chronic LCMV-cl13 infection (7 dpi). (D–I) FC-based quantification of BM CD8 T cells (D), CD4 T cells (E), and B220+ B cells (F). (G) LK (Linc-kit+) progenitors. (H) LSK (LinSca-1+c-kit+) progenitors. (I) HSCs (LSKCD150+CD48) at different time points after infection. (J) Quantification of Ki67/DAPI cell cycle analysis of HSCs (n = ≥4 mice per group) during the course of infections with LCMV-cl13. Statistical significance was analyzed by two-tailed Mann–Whitney U test for A–J: *, P < 0.05; **, P < 0.01; ***, P < 0.001. (K) Focus-forming assay for LCMV-cl13 in the BM during the course of infections (n = 3–5 mice per time point). (L) Top: Schematic experimental layout for ELDA transplantation performed in at least four replicates per condition. Bottom: Linear regression analyses for the transplantation, with indicated numbers representing ELDA estimates for HSC functionality (n = 4–5 mice per group) and HSC dose. Numbers of transplanted mice were lower for 7 and 14 dpi, given the scarcity of HSCs (see Fig. S1).
Figure S1.
Figure S1.
Effects of chronic infections in BM hematopoietic and HSC function. (A) Representative image showing maximum-intensity projection of femoral diaphyseal regions of BM from uninfected control (ctrl) or 7 dpi with LCMV-cl13. Blue, CD105 (BM sinusoids); white, Ter119 (erythroid progenitors). Scale bars, 500 µm (left); 50 µm (right). (B) Gating scheme used to phenotypically define HSC and HSPC populations in the BM of control (CTRL) and infected mice. FSC, forward scatter; SSC, side scatter. (C) Analysis showing CD45.1 donor engraftment (black circle, scale on left y axis) and donor lineage distribution in T cell (green), B cell (blue), and granulocyte (red) compartments as percentage of total CD45.1 engraftment (scale on right y axis). Mice were considered engrafted when the percentage of CD45.1+ cells in PB was >0.5% 4 mo after transplantation in all three lineages. Empty columns indicate total CD45.1 donor engraftment <0.5%. (D and E) Representative histograms and quantification of the fraction of cleaved caspase 3+ HSCs in uninfected mice and 3 and 7 dpi. Statistical significance was analyzed by Mann–Whitney U test. *, P < 0.05; ***, P < 0.001.
Figure 2.
Figure 2.
Chronic LCMV infection induces transient remodeling of BM vascular and ECM networks and persistent destruction of CARc infrastructure. (A) Maximum-intensity projection of confocal image stacks from representative femoral regions of uninfected controls (ctrl), 7-, or 56-dpi Cxcl12-GFP transgenic mice. Segmented signal of sinusoidal vessels stained for CD105 is shown in the middle panel; green, CXCL12-GFP+ CARc; lower panel, tissue maps of CARc densities. Scale bars for all panels, 200 µm. (B) Zoomed-in images from regions demarcated with white dotted rectangles in low-magnification images in A. The CXCL12-GFP signal is shown in green, and collagen IV–specific signal is shown in red (ECM fibers). (C) Quantification of the fraction of intrasinusoidal volumes (vol) from total BM tissue using segmentation of sinusoidal lumina (n = 4–7 femurs from at least three independent experiments). (D) CARc densities measured by 3D QM at indicated time points after infection (n = 4–9 femurs from at least three independent experiments). (E) Quantification of CARc densities by 3D QM at late time points after infections (n = 4 mice, one long-term infection experiment). (F and G) FC analysis of apoptosis (apop) of CARc, staining with DAPI and anti-annexin V. Representative dot plots (F) and quantification (G) of viable (DAPIannexin V), early apoptotic (DAPIannexin V+), and dead (DAPI+) fractions after infection with LCMV-cl13 (n = 4 mice from one representative of two independent experiments). (H and I) Cleaved caspase-3 staining of CARcs; histograms (H) and quantification (I) of positive CARc fractions (n = 4 mice, one representative of two experiments). Statistical significance was analyzed using two-tailed t test. *, P < 0.05; **, P < 0.01; ***, P < 0.001.
Figure S2.
Figure S2.
Chronic LCMV-cl13 directly infects endothelial cells, CARcs, and mature hematopoietic cells. (A and B) Quantification of the cellular density of LepR-Cre/tdTomato+ CARcs in the BM of uninfected mice (CTRL) and 7 dpi with LCMV-cl13 (n = 6 mice per group). Statistics were analyzed by two-tailed Mann–Whitney U test with **, P < 0.005. Representative images in which cells quantified are marked by yellow spheres are shown in B; scale bars, 100 µm. (C) Maximum-intensity projection of a representative femoral cavity 7 dpi with LCMV-cl13. White signal shows transmitted light (bone outline); blue, CD105 (BM sinusoids); red, VL4 (actively replicating LCMV-cl13 particles), and green, CXCL12-GFP (CARc). Scale bars, 2 mm (left, whole femur); 400 µm (middle, whole diaphysis); 50 µm (right, zoomed image). Arrows indicate infected GFP+ CARcs. (D) Representative dot plots for intracellular staining for viral nucleoprotein using VL4. Percentages of LCMV-cl13–infected cells in the BM 7 dpi are shown for LSKCD48CD150+ HSCs (orange), erythroid progenitors (red), BM endothelial cells (blue), and BM CARcs (green), respectively. Levels of specific isotype control stainings for each population are shown in overlaid dark plots. FSC, forward scatter; MEP, megakaryocyte-erythroid progenitor cell.
Figure 3.
Figure 3.
Durable functional impairment of CARc after chronic LCMV-cl13 infection. (A–D) Expression of key genes involved in HSC maintenance measured by RT-qPCR in sorted BM CARcs of uninfected control (ctrl) or 7 and 56 dpi with LCMV-cl13. Expression of Cxcl12 (A), Scf (B), Vcam (C), and Il-7 (D) are shown as percentage of HRPT expression (n = 3–5 samples from at least two independent experiments). (E–H) Concentrations of CXCL12 (E) and SCF (F) in BM extracts from one hind leg (femur and tibia) at different time points after LCMV-cl13 infection as measured by ELISA. (G) Principal component (PC) analysis plot for RNA-seq analyses of CARcs from uninfected control mice and 56 dpi. (H) GSEA graph for REACTOME gene sets overrepresented and underrepresented in CARcs isolated from the BM of mice 56 dpi compared with uninfected control BM. The net enrichment score (NES) and false discovery rate (FDR) for different gene sets are represented in the graph. Immunoreg. interac. bet., immunoregulation interaction between. (I) Integrated dot plot/heatmaps depicting expression levels from RNA-seq analysis of individual genes from selected REACTOME gene sets in H that are significantly up- or down-regulated in CARc 56 dpi compared with uninfected controls. (J and K) Concentrations of IFNα and IFNγ in BM extracts from one hind leg (femur and tibia) at different time points after LCMV-cl13 infection as measured by ELISA (n = 5 mice from at least two independent experiments). Statistical significance was analyzed by two-tailed Mann–Whitney U test. *, P < 0.05; **, P < 0.01; ***, P < 0.001; ns, P > 0.05..
Figure S3.
Figure S3.
Chronic LCMV-cl13 infection results in long-lasting transcriptomic alterations in BM stromal cells. (A) GSEA graph for REACTOME gene sets overrepresented and underrepresented in SECs isolated from the BM of mice 56 dpi, compared with uninfected control BM. The net enrichment score (NES) and false discovery rate (FDR) for different gene sets are represented in the graph. (B and C) Serum protein levels for IFNα (B) and IFNγ (C) at indicated time points after infection with LCMV-cl13 (n = 5 mice per time point), as determined by ELISA. Statistics were analyzed by two-tailed Mann–Whitney U test with *, P < 0.05; **, P < 0.01; ***, P < 0.001; ns, P > 0.05.
Figure S4.
Figure S4.
CD8 T cells mediate viral-induced effects in the BM. (A) Gating of gp33+ tetramer-specific CD8 T cells in the BM of control mice (CTRL) and mice treated with a-IFNAR 14 dpi with LCMV-cl13. SSC, side scatter. (B) Contour plot showing intracellular immunostaining for IFNγ and TNFα of CD44+CD8+ activated T lymphocytes in uninfected mice (CTRL) or 14 dpi with LCMV-cl13. (C–E) Percentages of CD8 gp33+ T cells (C), IFNγ+CD8+ T cells (D), and IFNγ+TNFα+ CD8+ T lymphocytes (E) in the BM and spleen 14 dpi with LCMV-cl13 (n = 3 mice per time point). (F–H) Anti-CD8 antibody administration efficiently depletes CD8+ T cells from BM and peripheral organs. (F) Dot plots showing representative gating for CD8 T lymphocytes (CD3+CD8+, pregated on singlets) in BM, blood, and spleen before and after antibody-mediated depletion. (G) Quantification of depletion efficacy, n = 4 mice. Depletion was calculated as 100% abundance in depleted mice, with abundance calculated as percentage of normal CD8+ T cell counts. Bl, blood; Spl, spleen. (H) Absolute numbers of CD8+, CD4+, and NK1.1+ cells in the BM of mice treated with PBS or anti-CD8 7 dpi with LCMV-cl13. (I) Maximum-intensity projection of a representative femoral cavity BM of mice treated with PBS or anti-CD8, 7 dpi with LCMV-cl13. Red, VL4 (actively replicating LCMV particles); green, CXCL12-GFP (BM CARcs). Scale bars, 100 µm (left, whole diaphysis); 50 µm (right, zoomed-in image). (J–M) Experimental layout depicting infection of chimeric mice and results of CD8 and HSC ratios and cell cycle status 14 dpi (J). Quantification of the ratio of CD8 T cells (K) and HSPCs (Linc-kit+CD48CD150+ cells; L), in the BM of WT/WT and WT/IFNAR chimeras before and after infection. (M) Cell cycle status of WT and IFNAR−/− HSCs in chimeric mice, before infection and 14 dpi with LCMV-cl13 (n = 2–5 mice per group from two independent experiments).
Figure 4.
Figure 4.
CD8 T lymphocytes mediate infection-induced hematopoietic effects and destruction of BM CARc upon chronic infection. (A–D) Total cell counts for BM cellularity (A), BM erythroid progenitors (B), LK hematopoietic progenitors (C), and BM HSCs (D) in CD8+/+ (black bars) and CD8−/− (light purple) mice at different time points after infection with LCMV-cl13 (n = 7–9 samples from at least three independent experiments). (E) Maximum-intensity projection of representative images from large femoral volumes of uninfected mice (ctrl) or mice subjected to LCMV-cl13 infections and treated with PBS or anti-CD8 (a-CD8)-depleting antibody and analyzed 7 dpi. Top: Green, CXCL12-GFP (CARc). Bottom: Tissue maps depicting CARc density levels according to a color-coded scale. Scale bar, 200 µm. (F) CARc densities assessed by 3D QM at indicated time points after infection (n = 4–9 samples from at least two independent experiments) in control and CD8 T cell–depleted mice. (G and H) Representative images of BM CD8+ T cells and CARc in mice before infection and 7 dpi with LCMV-cl13. Low-magnification images of global distribution and frequencies of both cell types are shown in G. (H) Examples of closely interacting CD8 T cell and CARc frequently found throughout BM tissues (dotted circles). Statistics were analyzed by two-tailed t test with **, P < 0.01; ***, P < 0.001; ns, P > 0.05.
Figure 5.
Figure 5.
Type I IFN signaling drives BM accumulation of activated, antigen-specific CD8 T cells. (A and B) Total cell counts of BM CD8 T lymphocytes (A) and gp33+ LCMV-specific BM CD8 T cells (B). Black bars, control mice treated with PBS before or after infection; red bars, data from mice treated with a-IFNAR blocking antibody during infection (see Materials and methods for dosage and regimens). (C) Contour plot of intracellular immunostaining for IFNγ and TNFα in BM CD8 T cells 14 dpi with or without a-IFNAR treatment. (D) Histograms showing PD-1 (left) and Tim-3 (right) expression of BM CD8 T cells 14 dpi in control and a-IFNAR–treated mice. (E) Total number of IFNγ+ CD8 T cells. (F) IFNγ+TNF-α+ CD8 T cells. (G) Percentage of PD-1hiTim-3+ T cells in total BM CD8 T cells at 14 dpi. (H) Total BM cellularity. (I and J) BM erythroid progenitors (I) and Linc-kit+ progenitor cells (J; n = 5–7 mice from two or three independent experiments). Statistics were analyzed using two-tailed Mann–Whitney U test with *, P < 0.05; **, P < 0.01; ***, P < 0.001; ns, P > 0.05.
Figure 6.
Figure 6.
Type I and II IFN signaling mediates structural and functional damage to BM CARc networks. (A) Maximum-intensity projection of representative images of femoral bones of mice 14 dpi with LCMV-cl13 treated with PBS, a-IFNAR alone, or a-IFNAR and anti-IFNγ. Top: Green, CXCL12-GFP (CARc); scale bar, 200 µm. Middle: Color-coded tissue maps of CARc densities. Scale bar, 200 µm. Bottom: High-resolution images of zoomed-in regions depicting CARc in green and collagen IV ECM fibers in red. Scale bar, 50 µm. (B) 3D QM–based quantification of CARc density in BM tissues from uninfected (ctrl) and LCMV-cl13–infected mice (black bars) treated with a-IFNAR (red bars) or a combination of a-IFNAR and a-IFNγ (blue bars) 7 and 14 dpi (n = 3–9 samples from at least two independent experiments). (C and D) RT-qPCR of sorted BM CARc for Cxcl12 (C) and Scf (D) gene expression as percentage of HRPT expression (n = 3) for the same experimental groups as in B. (E and F) Protein concentrations of CXCL12 (E) and SCF (F) in BM extracts from one hind leg (femur + tibia; n = 3). (G and H) Absolute numbers of Linc-kit+ cells (G) and HSCs (H) in mice in all experimental groups 14 dpi (six mice, two independent experiments). (I and J) Quantification and representative dot plots of cell cycle analyses of HSCs as measured by staining for DAPI and Ki67 after infection with LCMV-cl13 of mice treated with IFN-blocking antibodies. Statistics were analyzed using two-tailed Mann–Whitney U test with *, P < 0.05; **, P < 0.01; ***, P < 0.001; ns, P > 0.05.
Figure S5.
Figure S5.
Effects of IFN blockage on the BM and HSCs of infected and non-infected mice. (A–E) Quantification of total BM cells (A), Ter119+ erythroid progenitors (B), B220+ cells (C), Linc-kit+ progenitor cells (D), and LSKCD48CD150+ cells (E) in mice after infection and blockage with either a-IFNAR or a-IFNγ (n = 5–7 mice from two independent experiments). Statistics were analyzed using Mann–Whitney U test with *, P < 0.05; **, P < 0.01; ***, P < 0.001; ns, P > 0.05. (F) Image-based quantification of CARc densities in the BM of mice 7 and 14 dpi with LCMV-cl13 in untreated and a-IFNγ–treated mice (n = 3–4 mice, two experiments). (G) Blockade of IFNAR does not impact cell cycle entry of HSCs without LCMV-cl13 infection. Dot plots showing representative cell cycle analyses of HSCs (LSKCD48CD150+) using DNA labeling (DAPI) and immunostaining against Ki-67. HSCs were isolated 7 d after injection with either PBS or a-IFNAR antibody. (H) Quantification of cell cycle analyses, n = 3 mice. Statistics were analyzed by Mann–Whitney test. (I and J) Limiting-dilution transplantations of 10, 20, 50, and 100 HSCs (LSKCD48CD150+) from control untreated mice (CTRL) and mice treated with a-IFNAR and a-IFNγ for 56 d. (I and J) Calculation of functional repopulating HSCs (I) and engraftment levels and lineage distribution (J) of donor-derived CD45-1+ cells in transplanted mice (n = 4–5 mice per group). (K) Quantification of divisional (div) history of CFSE-labeled IFNγR−/− LSKCD48CD150+ HSCs after transplantation into control and LCMV-cl13–infected (56 dpi) mice (n = 5–6 recipient mice from two independent experiments). Statistics were analyzed by two-tailed Mann–Whitney U test with *, P < 0.05; ns, P > 0.05.
Figure 7.
Figure 7.
Combined blockage of type I and II IFN signaling prevents persistent decline in HSC functionality induced by infection. (A) Schematic experimental layout for ELDA repopulation assays. m, months. (B) Linear regression analysis for the transplantation, with indicated numbers representing ELDA estimates for HSC functionality. Table indicates values for 95% confidence intervals for each experimental group. (C) Individual engraftment analysis showing overall CD45.1 donor engraftment (black circle), as well as donor lineage distribution in T cell (green), B cell (blue), and granulocyte (red) engraftment as percentage of total CD45.1 engraftment. Mice were considered engrafted when PB CD45.1 engraftment was >0.5% in myeloid (Gr1+) and lymphoid lineages (T and B). Empty columns indicate total CD45.1 donor engraftment <0.5%. Transplantation was performed in seven to nine transplanted mice per condition (two independent experiments). Statistics were analyzed using Pearson’s χ2 test, and P values are shown.
Figure 8.
Figure 8.
LCMV infection results in persistent functional impairment of the BM microenvironment to maintain HSC quiescence. (A) Experimental layout for CFSE label dilution analysis. (B) Representative dot plots for CFSE label dilution 21 d after transplantation of LSK cells into control (ctrl) uninfected or LCMV-cl13–infected mice, 56 dpi. CFSE dilution is shown for HSPC LSKCD48 (left) and HSC LSKCD48CD150+ (right) subsets. Numbers above dot plots indicate divisions demarcated by gates on the CFSE axis. (C) Quantification of the percentage of transplanted LSKCD48CD150+ cells undergoing different numbers of divisions (div) based on dilution levels of CFSE (n = 7 recipient mice per time point from two independent experiments are shown in recipient control and LCMV-cl13–infected mice, 56 dpi). Statistics were analyzed by two-tailed Mann–Whitney U test with *, P < 0.05; **, P < 0.01; ***, P < 0.001; and ns, P > 0.05. (D) Experimental layout for long-term transplantation experiments. LSK cells from CD45.2 mice were transplanted into CD45.2/CD45.1 mice uninfected (CTRL) or infected with LCMV-cl13 (56 dpi) treated with PBS or a combination of a-IFNAR and anti-IFNγ. (E–I) Monthly values of CD45.2 chimerism in PB (E) myeloid Gr1+ (F), B220+ (G), CD4+ (H), and CD8+ (I) compartments. (J–L) CD45.2 chimerism in HSCs (LSKCD48CD150+), multipotential progenitors (MPPs; LSKCD48+CD150), common myeloid progenitors (CMPs; LinSca-1ckit+CD16/32CD34+), granulocyte-monocyte progenitors (GMPs; LinSca-1ckit+CD16/32+CD34+), and common lymphoid progenitors (CLPs; LinSca-1ckit+/loCD127+) in the BM at terminal analysis 4 mo after transplantation (n = 3 mice per group, one experiment). Statistical significance was analyzed by two-tailed ANOVA with Tukey’s multiple comparison test: *, P < 0.05; **, P < 0.01; ***, P < 0.001; ns, P > 0.05.

References

    1. Apperley, J.F., Dowding C., Hibbin J., Buiter J., Matutes E., Sissons P.J., Gordon M., and Goldman J.M.. 1989. The effect of cytomegalovirus on hemopoiesis: in vitro evidence for selective infection of marrow stromal cells. Exp. Hematol. 17:38–45. - PubMed
    1. Asada, N., Kunisaki Y., Pierce H., Wang Z., Fernandez N.F., Birbrair A., Ma’ayan A., and Frenette P.S.. 2017. Differential cytokine contributions of perivascular haematopoietic stem cell niches. Nat. Cell Biol. 19:214–223. 10.1038/ncb3475 - DOI - PMC - PubMed
    1. Baccin, C., Al-Sabah J., Velten L., Helbling P.M., Grünschläger F., Hernández-Malmierca P., Nombela-Arrieta C., Steinmetz L.M., Trumpp A., and Haas S.. 2019. Combined single-cell and spatial transcriptomics reveal the molecular, cellular and spatial bone marrow niche organization. Nat. Cell Biol. 22:38–48. 10.1038/s41556-019-0439-6 - DOI - PMC - PubMed
    1. Bahner, I., Kearns K., Coutinho S., Leonard E.H., and Kohn D.B.. 1997. Infection of human marrow stroma by human immunodeficiency virus-1 (HIV-1) is both required and sufficient for HIV-1-induced hematopoietic suppression in vitro: demonstration by gene modification of primary human stroma. Blood. 90:1787–1798. 10.1182/blood.V90.5.1787 - DOI - PubMed
    1. Baldridge, M.T., King K.Y., Boles N.C., Weksberg D.C., and Goodell M.A.. 2010. Quiescent haematopoietic stem cells are activated by IFN-gamma in response to chronic infection. Nature. 465:793–797. 10.1038/nature09135 - DOI - PMC - PubMed

Publication types

MeSH terms