. 2022 Mar 15;11(3):bio058840.
doi: 10.1242/bio.058840. Epub 2022 Mar 21.

Presynaptic HCN channels constrain GABAergic synaptic transmission in pyramidal cells of the medial prefrontal cortex

Affiliations

Presynaptic HCN channels constrain GABAergic synaptic transmission in pyramidal cells of the medial prefrontal cortex

Wei Cai et al. Biol Open. .

Abstract

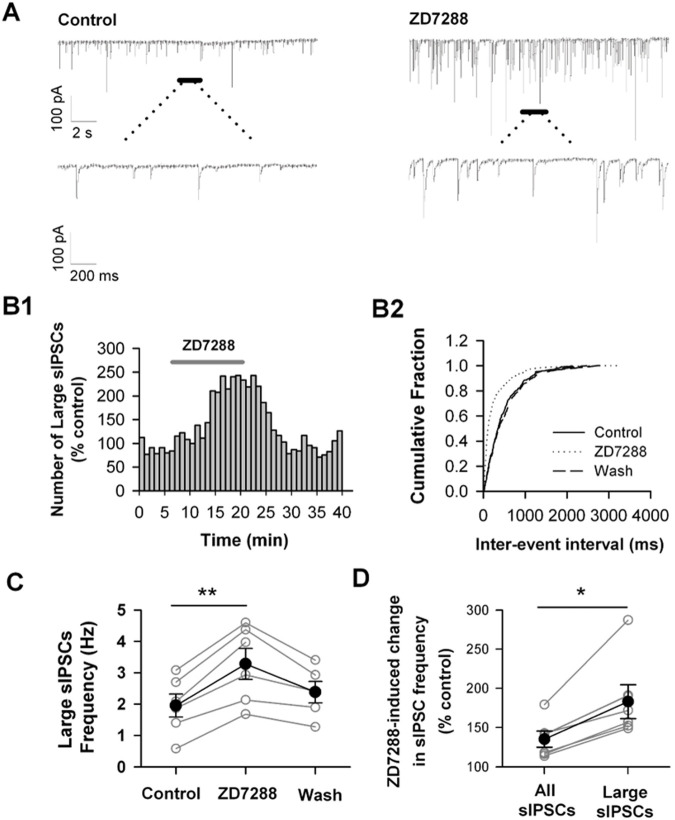
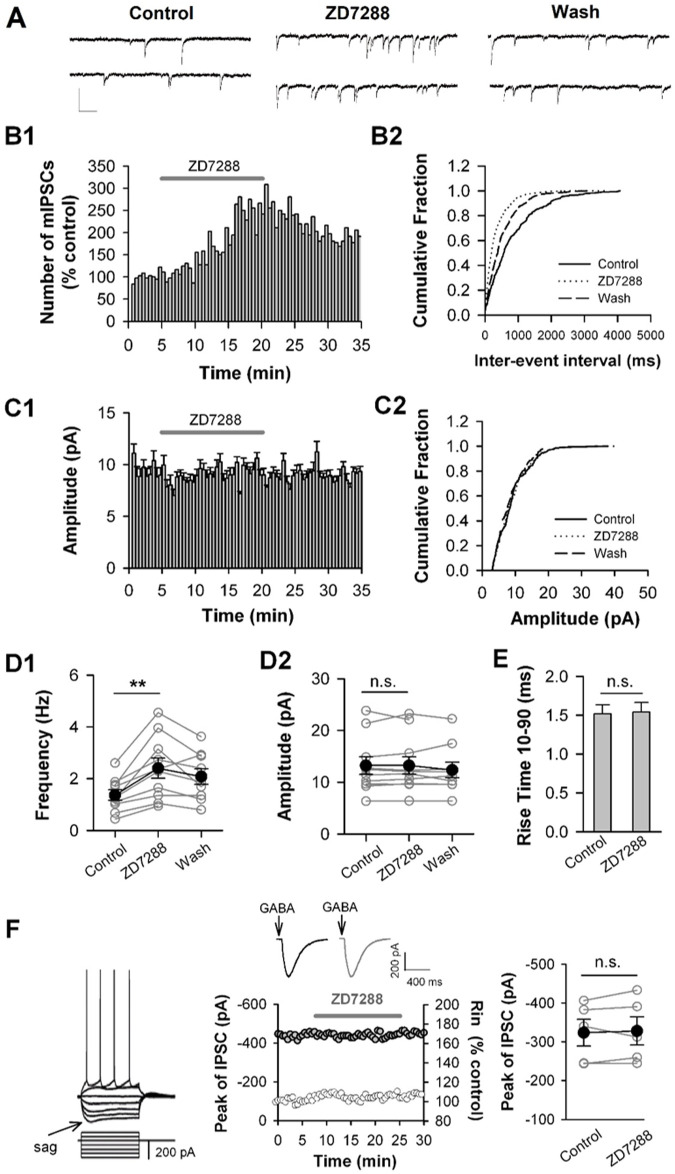
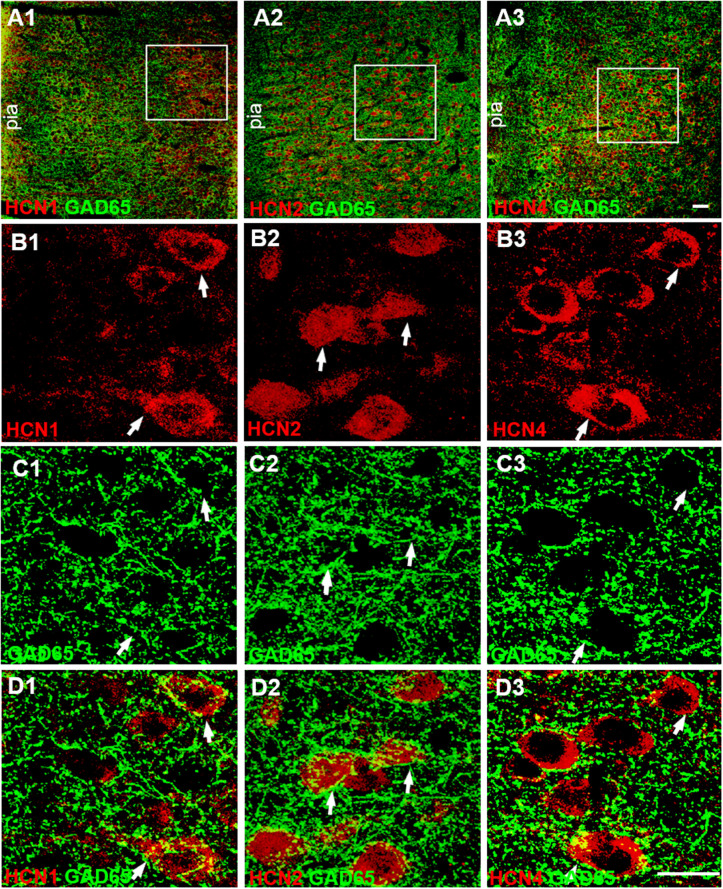
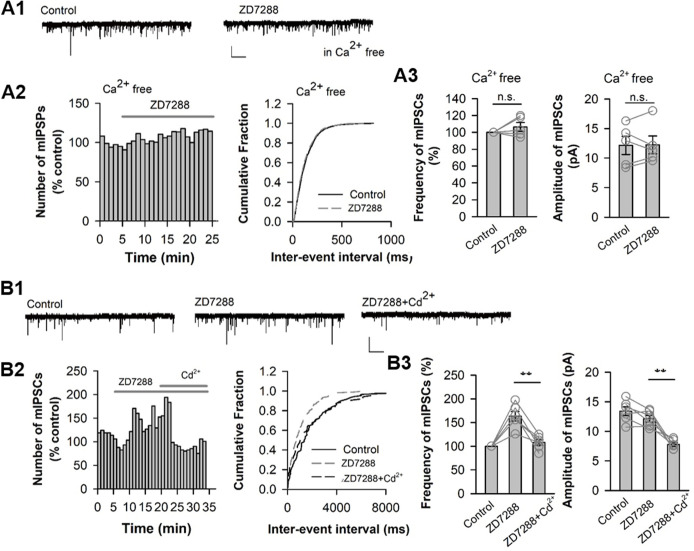
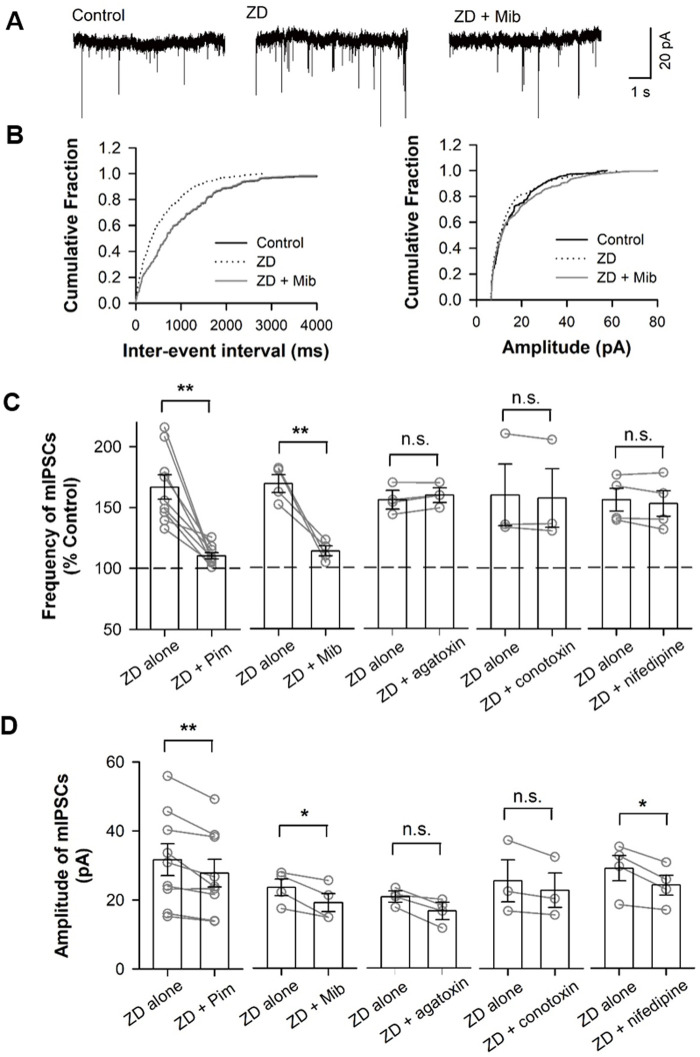
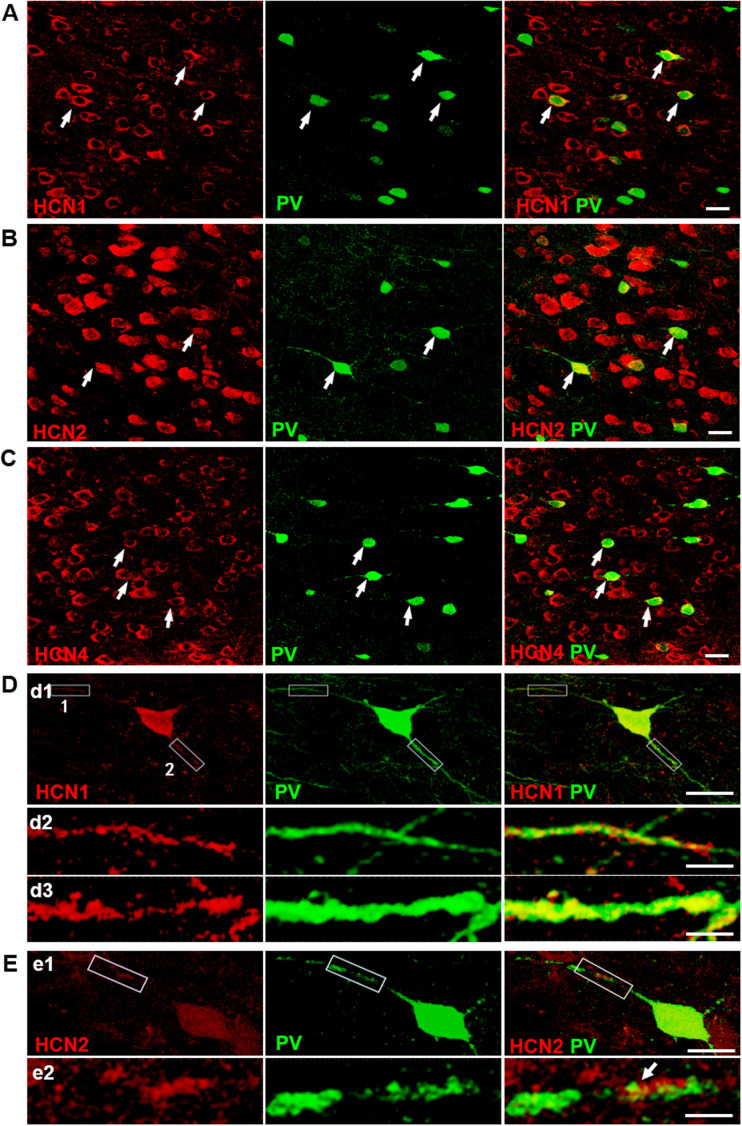
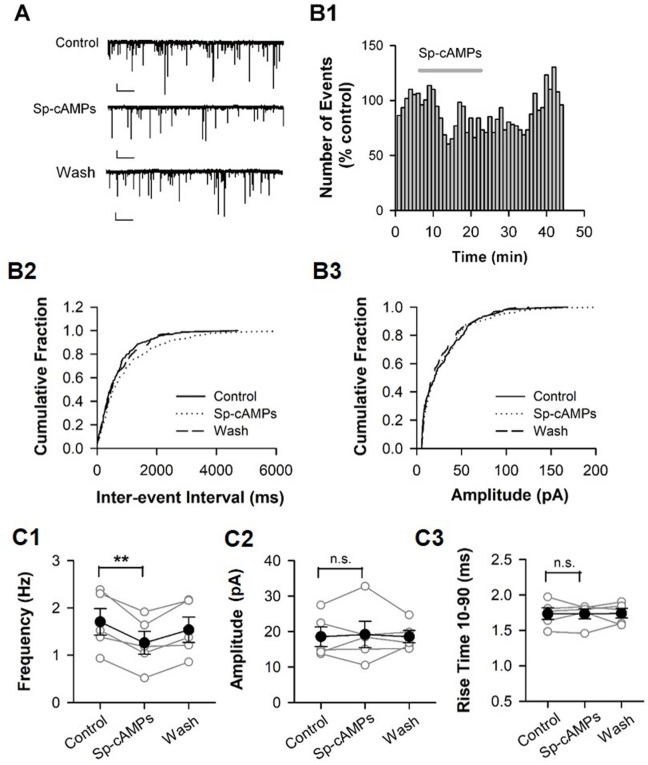
Hyperpolarization-activated cyclic nucleotide-gated (HCN) channels are widely expressed in neurons in the central nervous system. It has been documented that HCN channels regulate the intrinsic excitability of pyramidal cells in the medial prefrontal cortex (mPFC) of rodents. Here, we report that HCN channels limited GABAergic transmission onto pyramidal cells in rat mPFC. The pharmacological blockade of HCN channels resulted in a significant increase in the frequency of both spontaneous and miniature inhibitory postsynaptic currents (IPSCs) in mPFC pyramidal cells, whereas potentiation of HCN channels reversely decreases the frequency of mIPSCs. Furthermore, such facilitation effect on mIPSC frequency required presynaptic Ca2+ influx. Immunofluorescence staining showed that HCN channels expressed in presynaptic GABAergic terminals, as well as in both soma and neurite of parvalbumin-expressing (PV-expressing) basket cells in mPFC. The present results indicate that HCN channels in GABAergic interneurons, most likely PV-expressing basket cells, constrain inhibitory control over layer 5-6 pyramidal cells by restricting presynaptic Ca2+ entry.

Keywords: GABAergic transmission; HCN channel; Rats; mPFC.


Conflict of interest statement

Competing interests The authors declare no competing or financial interests.

Figures

Fig. 1
Fig. 1
. Blockade of HCN channels increases the frequency of sIPSCs in mPFC pyramidal cells. (A) An example trace of sIPSCs recorded in mPFC pyramidal cell in absence (Control) or presence of HCN channel blocker ZD7288 (30 µM). Holding potential=−70 mV. (B) ZD7288 increases the frequency of sIPSCs with large amplitude (> 20 pA). The number distribution of large sIPSCs (bin=60 s; B1), and the cumulative fraction distribution of inter-event intervals of sIPSCs before (Control), during (ZD7288), and after ZD7288 application (Wash) (B2). Data were from the same cell in A. (C) The summary individual (open circles) and grouped (closed circles) frequency of large sIPSCs. n=6 cells. **P<0.01. (D) The sIPSC frequency in all detective events and in large events after ZD7288 application. Open circles for the individual cell; Close circles for grouped cells. Data were from the same cell in C. *P<0.05.
Fig. 2.
Fig. 2.
Blockade of HCN channels enhances the frequency but not amplitude of mIPSCs. (A) Representative traces of miniature IPSCs (mIPSCs) recorded in mPFC pyramidal cell before (Control), during (ZD7288), and after ZD7288 application (Wash). Holding potential: −70 mV. Calibration: 20 pA, 200 ms. (B) ZD7288 facilitates the frequency of mIPSCs. The number distribution of mIPSCs (bin=60 s, B1), and the cumulative fraction distribution of inter-event intervals of mIPSCs (B2). Data were from the same cell in A. (C) ZD7288 has no effect on the amplitude of mIPSCs. The amplitude distribution of mIPSCs (bin=60 s, C1), and the cumulative fraction distribution of mIPSC amplitude (C2). Data were from the same cell in A. (D) The mIPSC frequency (D1) and amplitude (D2) from the individual cell (open circles) and grouped cells (closed circles). n=10 cells, **P<0.01. (E) ZD7288 has no effect on 10–90% rise time of mIPSCs. Data were from the same cells in D. (F) ZD7288 has no effect on the amplitude of IPSCs evoked by puff application of GABA (10 µM) to pyramidal cells. A typical example for pyramidal cells with a sag (left). An example of time course of the IPSC amplitude (black circles) and the input resistance (grey circles) obtained from a pyramidal cell. The insets show the IPSC traces in the absence (black) and presence of ZD7288 (grey), each of which is the average of seven consecutive IPSCs (middle). The summary individual (open circles) and grouped (closed circles) amplitude of IPSCs (right). n=5 pyramidal cells.
Fig. 3.
Fig. 3.
HCN channels are present on GABAergic terminals in the mPFC. (A) Low-magnification confocal images showing double stained with HCN channels (red) and GAD65 (green), a GABAergic terminal marker. The squares illustrate the cells in layers 5–6 of the mPFC. Scale bar: 40 µm. (B,C) Single-plane confocal images showing the HCN1-ir (B1), HCN2-ir (B2), HCN4-ir (B3), and GAD65-ir (C1-C3) at high magnification. GAD65-ir appears in punctuate structures distributed in the neuropil, as well as around unlabeled pyramidal cell soma (C1-C3). (D) Merging of the paired images (B1 and C1), (B2 and C2), and (B3 and C3) shows that the puncta of GAD65-ir surround the cell bodies of HCN1-ir (B1), HCN2-ir (B2), and HCN4-ir (B3) cells. Partially overlapping areas of red (HCN) and green (GAD65) profiles showing yellow. The arrowheads indicate double-labeled cells. Scale bar: 20 µm.
Fig. 4.
Fig. 4.
Enhancing HCN channel function decreases the frequency of mIPSC. (A) Representative traces of mIPSCs recorded in mPFC pyramidal cell before (Control), during (Sp-cAMPs), and after Sp-cAMPs application (Wash). Holding potential: −70 mV. Calibration: 1 s, 10 pA. (B) Effects of Sp-cAMPs on the frequency and amplitude of mIPSCs. The number distribution of mIPSCs (bin=60 s; B1), and the cumulative fraction distribution of inter-event intervals (B2) and amplitude (B3) of mIPSCs. Data were from the same cell in A. (C) Summary for individual cell (open circles) and grouped cells (closed circles). n=5 cells, **P<0.01.
Fig. 5.
Fig. 5.
HCN-blockade enhancement of mIPSC frequency requires Ca2+ influx. (A) ZD7288 has no effect on mIPSC frequency under the condition of omitting extracellular Ca2+. An example trace of mIPSCs recorded in pyramidal cell under Ca2+-free perfusion solution (A1). The number distribution of mIPSCs (bin=60 s; A2, left), and the cumulative fraction distribution of inter-event intervals of mIPSCs (A2, right) recorded from cell in A1. The individual and grouped data showing the effect of ZD7288 on the frequency (A3, left) and amplitude (A3, right) under extracellular Ca2+-free condition. n=5 pyramidal cells. (B) Blocking Ca2+ channel abolishes the effect of ZD7288 on mIPSC frequency. An example trace of mIPSCs recorded in pyramidal cell (B1). The number distribution of mIPSCs (bin=60 s; B2, left), and the cumulative fraction distribution of inter-event intervals of mIPSCs before (Control), during application of ZD7288 alone (ZD7288), and during co-application of ZD7288 and Ca2+ channel blocker Cd2+ (200 µM, ZD7288+Cd 2+) (B2, right) recorded from cell in B1. The individual and grouped data showing the changes in mIPSC frequency (B3, left) and amplitude induced by ZD7288 alone, and co-application of ZD7288 and Cd 2+ (B3, right). **P<0.01, n=6 pyramidal cells. Calibrations: 5 s, 20 pA in A1 and B1.
Fig. 6.
Fig. 6.
T-type Ca2+ channel blockers occlude the increment in mIPSC frequency induced by blocking HCN channels. (A) Representative traces of mIPSCs recorded in pyramidal cell. Holding potential: −70 mV. (B) The cumulative fraction distribution of inter-event intervals (left) and amplitude (right) of mIPSCs before (Control), during (ZD7288, 30 µM), and after co-application of ZD7288 with T-type Ca2+ channel selective blocker mibefradil (Mib; 10 µM) (ZD+Mib). (C,D) Bar graph demonstrating the effects of co-application of ZD7288 and Ca2+ channel blockers for T-type (pimozide, 1 µM; mibefradil, 10 µM), P/Q-type (ω-agatoxin IVA, 500 nM), N-type (ω-Conotoxin GVIA, 500 nM), and L-type (nifedipine, 2 mM) Ca2+ channels on the frequency (C) and amplitude (D) of mIPSCs. Open circles for individual cells and bar for grouped data. **P<0.01, paired t-test.
Fig. 7.
Fig. 7.
HCN channels are present in soma and neurite of parvalbumin-expressing basket cells in layers 5–6 of mPFC. (A–C) Microscopic confocal images showing HCN1-ir (A), HCN2-ir (B), and HCN4-ir (C) locate in PV-ir interneuron in layers 5–6 of mPFC. Double stained with HCN channels (red) and PV (green). Arrowheads indicate double-labeled cells. Scale bars: 20 µm. (D) High-magnification confocal microscopy images showing that HCN1-ir localize in the soma (d1) and along neurite (d2-d3) of PV-ir interneuron. Silhouette frame 1 and 2 in neurite (d1) is digitally magnified for a better view of neurite in (d2) and (d3), respectively. Scale bars: 20 µm in (d1) and 1 µm in (d2) and (d3). (E) High-magnification confocal microscopy images showing that HCN2-ir localize in the soma and along neurite of PV-ir interneuron. Silhouette frame in neurite (e1) is digitally magnified for a better view of neurite in (e2). Scale bars: 20 µm in (e1) and 1 µm in (e2).

References

    1. Aponte, Y., Lien, C. C., Reisinger, E. and Jonas, P. (2006). Hyperpolarization-activated cation channels in fast-spiking interneurons of rat hippocampus. J. Physiol. 574, 229-243. 10.1113/jphysiol.2005.104042 - DOI - PMC - PubMed
    1. Bartos, M., Vida, I. and Jonas, P. (2007). Synaptic mechanisms of synchronized gamma oscillations in inhibitory interneuron networks. Nat. Rev. 8, 45-56. 10.1038/nrn2044 - DOI - PubMed
    1. Baruscotti, M. and Difrancesco, D. (2004). Pacemaker channels. Ann. N. Y. Acad. Sci. 1015, 111-121. 10.1196/annals.1302.009 - DOI - PubMed
    1. Beaumont, V. and Zucker, R. S. (2000). Enhancement of synaptic transmission by cyclic AMP modulation of presynaptic Ih channels. Nat. Neurosci. 3, 133-141. 10.1038/72072 - DOI - PubMed
    1. Beaumont, V., Zhong, N., Froemke, R. C., Ball, R. W. and Zucker, R. S. (2002). Temporal synaptic tagging by I(h) activation and actin: involvement in long-term facilitation and cAMP-induced synaptic enhancement. Neuron 33, 601-613. 10.1016/S0896-6273(02)00581-0 - DOI - PubMed

Publication types

Substances