. 2021 Nov 15;60(22):17288-17302.
doi: 10.1021/acs.inorgchem.1c02666. Epub 2021 Oct 28.

Halogen Transfer to Carbon Radicals by High-Valent Iron Chloride and Iron Fluoride Corroles

Affiliations

Halogen Transfer to Carbon Radicals by High-Valent Iron Chloride and Iron Fluoride Corroles

Geoffrey W Farley et al. Inorg Chem. .

Abstract

High-valent iron halide corroles were examined to determine their reactivity with carbon radicals and their ability to undergo radical rebound-like processes. Beginning with Fe(Cl)(ttppc) (1) (ttppc = 5,10,15-tris(2,4,6-triphenylphenyl)corrolato3-), the new iron corroles Fe(OTf)(ttppc) (2), Fe(OTf)(ttppc)(AgOTf) (3), and Fe(F)(ttppc) (4) were synthesized. Complexes 3 and 4 are the first iron triflate and iron fluoride corroles to be structurally characterized by single crystal X-ray diffraction. The structure of 3 reveals an AgI-pyrrole (η2-π) interaction. The Fe(Cl)(ttppc) and Fe(F)(ttppc) complexes undergo halogen transfer to triarylmethyl radicals, and kinetic analysis of the reaction between (p-OMe-C6H4)3C• and 1 gave k = 1.34(3) × 103 M-1 s-1 at 23 °C and 2.2(2) M-1 s-1 at -60 °C, ΔH = +9.8(3) kcal mol-1, and ΔS = -14(1) cal mol-1 K-1 through an Eyring analysis. Complex 4 is significantly more reactive, giving k = 1.16(6) × 105 M-1 s-1 at 23 °C. The data point to a concerted mechanism and show the trend X = F- > Cl- > OH- for Fe(X)(ttppc). This study provides mechanistic insights into halogen rebound for an iron porphyrinoid complex.


Figures

Figure 1.
Figure 1.
UV-vis spectra of 1 (blue, dashed line) and 2 (red, solid line) in toluene at 23 °C.
Figure 2.
Figure 2.
1H NMR spectra of 2 (top) and 3 (bottom) in C6D5CD3 at 23 °C. Inset: expanded region from 6 – 9 ppm. Chemical shifts labeled in red highlight the peak at −7.4 ppm in 2 which splits into two peaks in the presence of AgOTf in 3.
Figure 3.
Figure 3.
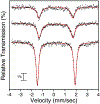
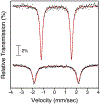
Zero-field 57Fe Mössbauer spectra of 2 at 125 K (top), 2 at 80 K (middle), 3 at 80 K (bottom) in toluene. Experimental data = black circles, best fit = red line.
Figure 4.
Figure 4.
Displacement ellipsoid plot (40% probability) of 3 at 110 K. Hydrogen atoms omitted for clarity. Inset: chemical structure of 3.
Figure 5.
Figure 5.
UV-vis spectra of Fe(X)(ttppc) where X = Cl (blue, dashed line) or F (red, solid line) in toluene at 23 °C.
Figure 6.
Figure 6.
Displacement ellipsoid plot (50% probability) of 4 at 110 K. Hydrogen atoms are omitted for clarity.
Figure 7.
Figure 7.
1H NMR (400 MHz) spectrum of Fe(X)(ttppc) with X = F (top) and Cl (bottom) in C6D5CD3 at 23 °C.
Figure 8.
Figure 8.
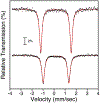
Zero-field 57Fe Mössbauer spectra of Fe(X)(ttppc) with X = Cl (top), and F (bottom) in toluene at 80 K. Experimental data = black circles, best fit = red line.
Figure 9.
Figure 9.
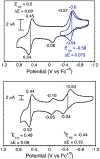
Cyclic voltammograms of 1 (2 mM) with a scan rate of 50 mV/s (black) and 200 mV/s (blue) (top), and 4 (3 mM) with a scan rate of 100 mV/s (black) in benzonitrile (bottom). The solution contains Bu4N+PF6 (0.25 M) supporting electrolyte.
Figure 10.
Figure 10.
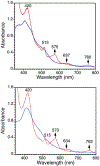
UV-vis spectra for the reaction of Fe(X)(ttppc) where X = Cl (top) or F (bottom) with Ph3C=C6H5CPh2 in toluene at 23 °C. Spectra before (blue) and after (red) the addition of excess Ph3C=C6H5CPh2.
Figure 11.
Figure 11.
Zero-field 57Fe Mössbauer spectrum (C6H5CH3, 80 K) of 1 (top), and 1 + (p-MeO-C6H4)3C• (bottom). Experimental data = black circles, best fit = red line.
Figure 12.
Figure 12.
(a) Overlay of UV–vis spectra for 1 (blue, solid line), 1 + (p-MeO-C6H4)3C• (red, dashed line), and (p-MeO-C6H4)3C• (green, dotted line) in toluene. (b) UV-vis spectra for reaction of 1 (32 μM) with (p-MeO-C6H4)3C• (62 equiv) in toluene from 0 (blue) to 2 sec (red) at 0.04 s intervals (grey) at 23 °C. Inset: Changes in absorbance versus time for the formation of FeIII(ttppc) (black dots) fit to a single exponential expression (red line). (c) Plot of kobs (23 °C) versus [(p-MeO-C6H4)3C•] with best-fit line. (d) Eyring plot of (ln(kh/kBT) versus 1/T (−70 °C to 23 °C) with best-fit line.
Figure 13.
Figure 13.
(a) UV-vis spectra for reaction of 4 (12.5 μM) with (p-MeO-C6H4)3C• (31 equiv) in toluene from 0 (blue) to 0.1 s (red) at 0.0015 s intervals (grey) at 23 °C. Inset: Changes in absorbance versus time for the formation of FeIII(ttppc) (black dots) fit to a single exponential expression (red line). (b) Plot of kobs versus [(p-MeO-C6H4)3C•] with best-fit line.
Scheme 1.
Scheme 1.
C-H Bond Activation by Cytochrome P450
Scheme 2.
Scheme 2.
C-H Bond Chlorination by αKG-Dependent Enzymes
Scheme 3.
Scheme 3.
Synthesis of Complex 2
Scheme 4.
Scheme 4.
Synthesis of Complex 4
Scheme 5.
Scheme 5.
Reaction of Fe(X)(ttppc) (X = Cl or F) with Triphenylmethyl Radical
Scheme 6.
Scheme 6.
Reaction of 4 with Tris-(para-Methoxyphenyl)methyl Radical

Similar articles

Cited by

References

    1. Sahu S; Goldberg DP, Activation of Dioxygen by Iron and Manganese Complexes: A Heme and Nonheme Perspective. J. Am. Chem. Soc, 2016, 138, 11410. - PMC - PubMed
    1. Poulos TL, Heme Enzyme Structure and Function. Chem. Rev, 2014, 114, 3919. - PMC - PubMed
    1. Rittle J; Green MT, Cytochrome P450 Compound I: Capture, Characterization, and C-H Bond Activation Kinetics. Science, 2010, 330, 933. - PubMed
    1. Denisov IG; Makris TM; Sligar SG; Schlichting I, Structure and Chemistry of Cytochrome P450. Chem. Rev, 2005, 105, 2253. - PubMed
    1. Makris TM; Koenig K. v.; Schlichting I; Sligar SG, The status of high-valent metal oxo complexes in the P450 cytochromes. J. Inorg. Biochem, 2006, 100, 507. - PubMed