. 2021 Oct 29;374(6567):eabb3420.
doi: 10.1126/science.abb3420. Epub 2021 Oct 29.

p21 produces a bioactive secretome that places stressed cells under immunosurveillance

Affiliations

p21 produces a bioactive secretome that places stressed cells under immunosurveillance

Ines Sturmlechner et al. Science. .

Abstract

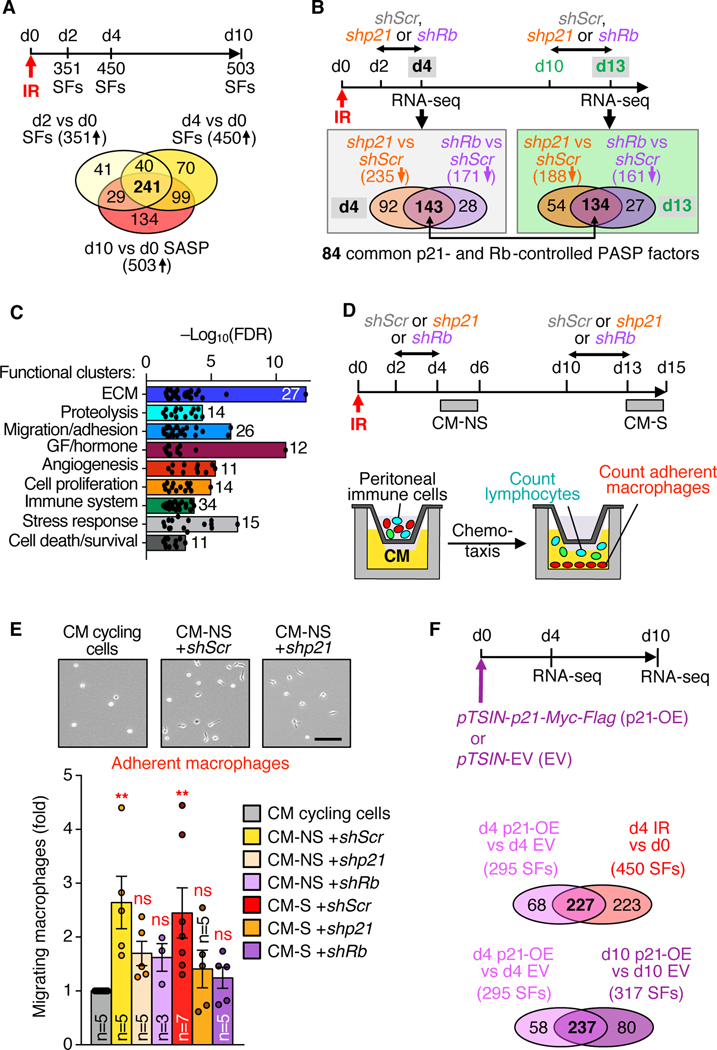
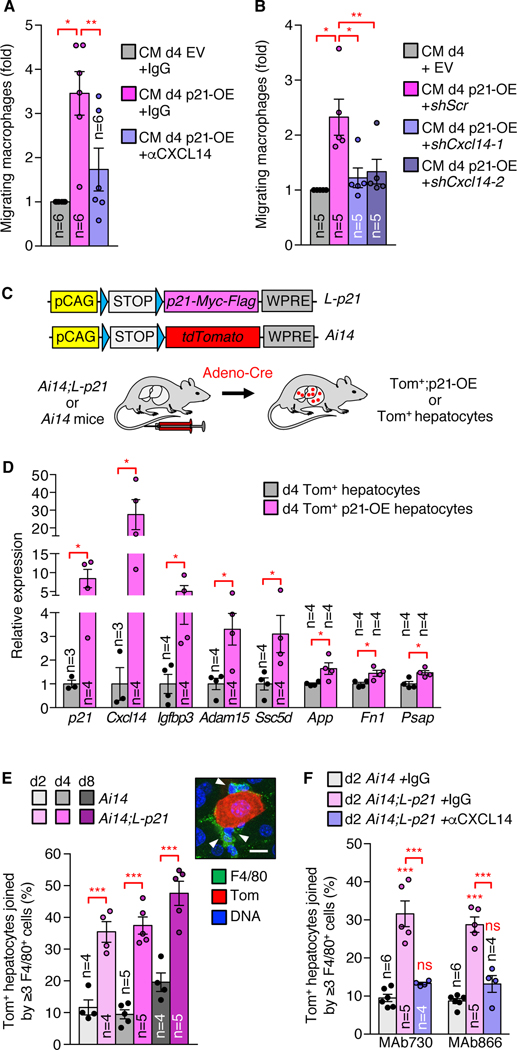
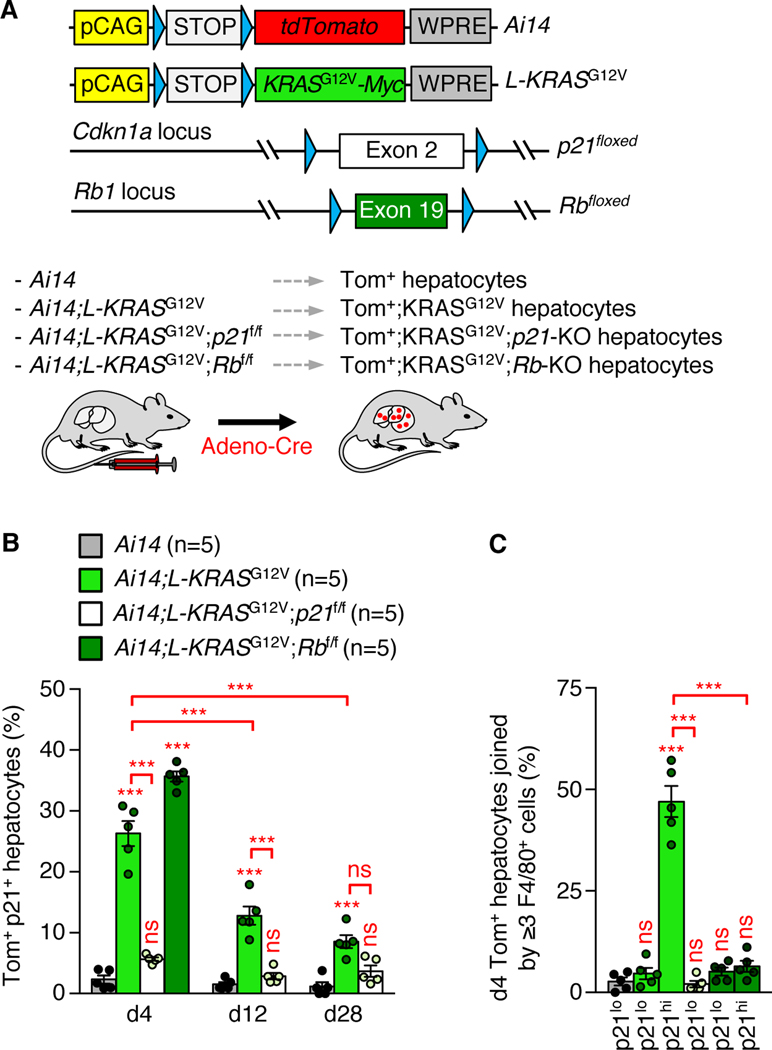
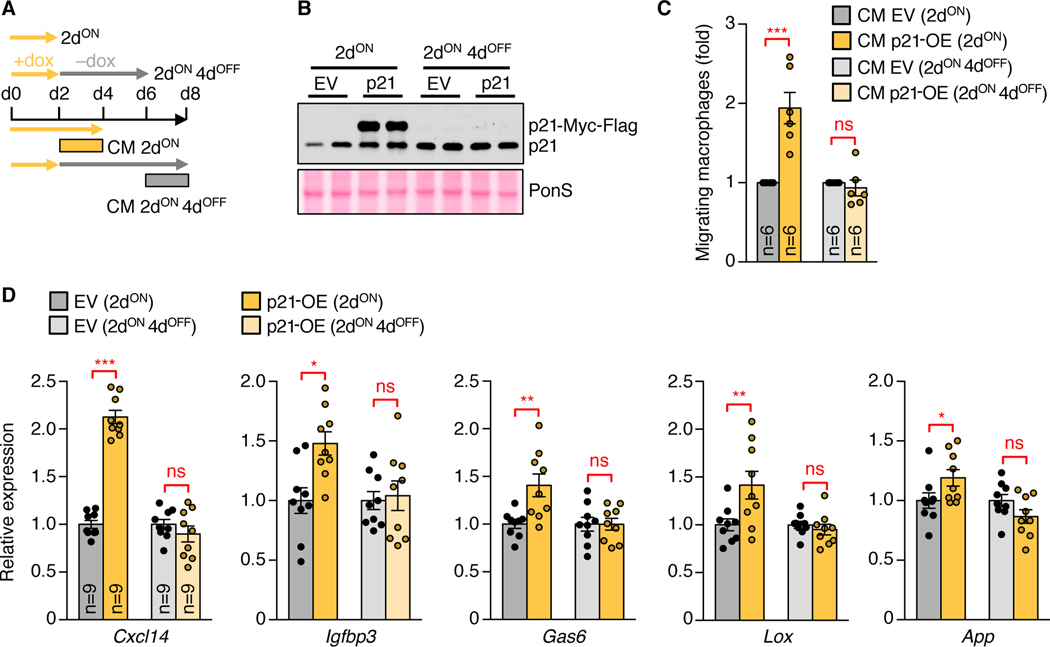
Immune cells identify and destroy damaged cells to prevent them from causing cancer or other pathologies by mechanisms that remain poorly understood. Here, we report that the cell-cycle inhibitor p21 places cells under immunosurveillance to establish a biological timer mechanism that controls cell fate. p21 activates retinoblastoma protein (Rb)–dependent transcription at select gene promoters to generate a complex bioactive secretome, termed p21-activated secretory phenotype (PASP). The PASP includes the chemokine CXCL14, which promptly attracts macrophages. These macrophages disengage if cells normalize p21 within 4 days, but if p21 induction persists, they polarize toward an M1 phenotype and lymphocytes mount a cytotoxic T cell response to eliminate target cells, including preneoplastic cells. Thus, p21 concurrently induces proliferative arrest and immunosurveillance of cells under duress.


Figures

Fig. 1.
Fig. 1.. p21-activated Rb interacts with STAT and SMAD TFs at select gene promoters to establish a bioactive secretome.
(A) Venn diagrams of RNA-seq data depicting downregulated SASP factors with depletion of p21 or Rb in the indicated SNCs. (B) Heatmaps of commonly downregulated SASP factors indicated in (A). FC, fold change. (C) Identification of TFs that transcriptionally activate genes encoding PASP factors using overrepresentation analyses on RNA-seq data from IR-, REP, OI-senescent MEFs, IR-senescent IMR-90 cells, and their non-senescent counterparts. Bolded TFs are significantly activated in SNCs and inhibited upon shp21 and shRb. FDR, false discovery rate. (D) Identification of SASP genes that bind Rb, and TF motif analysis of Rb peaks underlying SFs in OI-senescent IMR-90 cells. (E) Representative Rb occupancy plots at PASP genes. Experiments in the above panels were performed once.
Fig. 2.
Fig. 2.. The p21-activated secretory phenotype places cells under immunosurveillance as they arrest.
(A) Timeline and Venn diagrams based on RNA-seq depicting significantly upregulated SFs. (B) Timeline and Venn diagrams comparing significantly downregulated SFs upon p21 or Rb depletion. (C) Functional annotation analyses of 84 PASP factors indicated in (B) displaying overrepresented functional clusters. GF, growth factor. (D) Schematic of CM production and transwell migration assay of peritoneal immune cells in the presence of CM. (E) Representative images and quantitation of adherent macrophages in the bottom transwell chamber. Scale bar: 100 μm. (F) Venn diagrams depicting significantly upregulated PASP factors. Data represent means ± SEM. Experiments in the above panels were performed once except for (E) where data from three experiments were pooled. ns, not significant. **P<0.01. One-way ANOVA with Sidak’s correction (E).
Fig. 3.
Fig. 3.. p21-induced immunosurveillance requires PASP factor CXCL14.
(A) Transwell migration assay with CM in the presence of CXCL14-neutralizing or IgG antibodies. (B) as in (A) but with CM from shRNA-transduced MEFs. (C) Schematic of the transgenes used for Cre-inducible expression of Myc-Flag-tagged p21 (L-p21 for LoxP/Stop/LoxP-p21) and tdTomato (Ai14) (Top) and the experimental setup for p21-OE induction in hepatocytes via Cre-encoding adenovirus injection (Bottom). (D) RT-qPCR on flow-sorted Tom+ hepatocytes. (E) Representative picture and quantification of Tom+ hepatocytes joined by ≥3 F4/80+ cells. (F) As in (E) but assessing livers from mice treated with CXCL14-neutralizing or IgG control antibodies. Scale bars: 10 μm (E). Data represent means ± SEM. Experiments in the above panels were performed once. ns, not significant. *P<0.05; **P<0.01; ***P<0.001. One-way ANOVA with Sidak’s correction (A, B, E, and F) and unpaired two-tailed t tests (D).
Fig. 4.
Fig. 4.. Hepatocytes under surveillance die upon macrophage differentiation and lymphocyte recruitment.
(A) Representative image and quantification of Tom+ hepatocytes associated with ≥1 B220+ cells. (B) Representative picture and quantification of Tom+ hepatocytes associated with ≥1 CD3ε+ cells. (C) Proportion of Tom+ and healthy (not dying) hepatocytes. (D) Representative picture and quantification of dying Tom+ hepatocytes. (E) Representative picture and quantification of Tom+ hepatocytes associated with ≥1 iNOS+ cells. (F) Quantitation of dying p21-OE Tom+ hepatocytes associated with ≥1 iNOS+ cells. Scale bars: 10 μm (A, B, D, and E). Mice used were on a C57BL/6×129Sv mixed genetic background. Data represent means ± SEM. Experiments in the above panels were performed once. ns, not significant. **P<0.01; ***P<0.001. One-way ANOVA with Sidak’s correction (A to E).
Fig. 5.
Fig. 5.. p21 induced by oncogenic RAS places cells under immunosurveillance.
(A) (Top) Schematic representation of L-KRASG12V and Ai14 transgenes, and p21- and Rb-conditional knockout alleles. Blue triangles denote LoxP sites. (Bottom) Schematic of the experimental design. (B) Proportion of Tom+ p21+ hepatocytes among Tom+ hepatocytes at indicated days after adeno-Cre injection. (C) Quantification of Tom+ hepatocytes joined by ≥3 F4/80+ macrophages. p21hi, cells with elevated p21 staining; p21lo, cells with baseline or background level p21 staining. Mice used were on a C57BL/6×129Sv mixed genetic background. Data represent means ± SEM. Experiments in the above panels were performed once. ns, not significant. ***P<0.001. Two-way ANOVA with Sidak’s correction (d12 and d28 in B), one-way ANOVA with Sidak’s correction (d4 in B and C).
Fig. 6.
Fig. 6.. p21-dependent immunoclearance protects against oncogenic growth.
(A) RT-qPCR on flow-sorted Tom+ hepatocytes. (B) Proportion of hepatocytes that is Tom+ and appears healthy (not dying). (C) Quantification of dying Tom+ hepatocytes. (D) Quantification of Tom+ hepatocytes joined by ≥1 iNOS+ cells. p21hi, cells with elevated p21 staining; p21lo, cells with baseline or background level p21 staining. (E) As in (D) but for hepatocytes with ≥1 CD3ε+ cells. (F) Representative image and quantitation of Tom+ hepatocyte clusters. (G) Proportion of Tom+ EdU+ hepatocytes in- or outside Tom+ clusters. Scale bar: 20 μm. Mice used were on a C57BL/6×129Sv mixed genetic background. Data represent means ± SEM. Experiments in the above panels were performed once. ns, not significant. *P<0.05; **P<0.01; ***P<0.001. Two-way ANOVA with Sidak’s correction (d12 and d28 in B and C), one-way ANOVA with Sidak’s correction (A and D to F and d4 in B and C) or unpaired two-tailed t test (G).
Fig. 7.
Fig. 7.. Cells normalizing p21 cease to produce a PASP and are released from immunosurveillance.
(A) Schematic overview of CM preparations from dox-inducible p21-OE MEFs. (B) Representative immunoblot for p21. PonS served as loading control. (C) Transwell macrophage migration with CM from indicated MEFs. (D) RT-qPCR of the indicated MEFs. Data represent means ± SEM. The blot shown in (B) is representative of 2 independent experiments, and data shown in (C) and (D) were pooled from 2 and 3 experiments, respectively. ns, not significant. *P<0.05; **P<0.01; ***P<0.001. Two-way ANOVA with Sidak’s correction (C and D).
Fig. 8.
Fig. 8.. p21 places cells under immunosurveillance to establish a timer mechanism that controls cell fate.
(A) (Top) Schematic representation of the transgenes for dox-inducible repression of Myc-Flag-tagged p21 (iL-p21 for inducible LoxP/Stop/LoxP-p21) and monitoring of ectopic p21 expression status via fluorescent marker proteins (Ai139). Blue triangles denote LoxP sites. (Bottom) Schematic of the experimental design with fluorescent markers for transgenic p21 expression and repression indicated. Rates of p21 overexpression (p21+) among hepatocytes that were positive for Tom and eGFP in the absence of dox (p21-OE “ON”) or only Tom after dox administration (p21-OE “OFF”). (C) Representative image of a p21-OE hepatocyte surrounded by three macrophages, and quantification of fluorescent hepatocytes joined by ≥3 F4/80+ macrophages. (D) Assessment of fluorescent hepatocytes associated with ≥1 iNOS+ cells. (E) As (D) but assessing cells with ≥1 CD3ε+ cells. (F) Representative image of a 6dON+2dOFF dying hepatocyte and quantification of death rates among fluorescent hepatocytes. Scale bars: 10 μm (C and F). Mice used were on a C57BL/6 pure genetic background. Data represent means ± SEM. Experiments in the above panels were performed once. ns, not significant. *P<0.05; **P<0.01; ***P<0.001. Two-way ANOVA with Sidak’s correction (B to F).

Comment in

  • Clearing stressed cells.
    Reen V, Gil J. Reen V, et al. Science. 2021 Oct 29;374(6567):534-535. doi: 10.1126/science.abm3229. Epub 2021 Oct 28. Science. 2021. PMID: 34709889

References

    1. Galluzzi L, Yamazaki T, Kroemer G, Linking cellular stress responses to systemic homeostasis. Nat Rev Mol Cell Biol 19, 731–745 (2018). - PubMed
    1. Koren E, Fuchs Y, Modes of Regulated Cell Death in Cancer. Cancer discovery 11, 245–265 (2021). - PubMed
    1. van Deursen JM, The role of senescent cells in ageing. Nature 509, 439–446 (2014). - PMC - PubMed
    1. Kang TW et al., Senescence surveillance of pre-malignant hepatocytes limits liver cancer development. Nature 479, 547–551 (2011). - PubMed
    1. Eggert T et al., Distinct Functions of Senescence-Associated Immune Responses in Liver Tumor Surveillance and Tumor Progression. Cancer Cell 30, 533–547 (2016). - PMC - PubMed

Publication types

MeSH terms