. 2021 Oct 28;6(23):e147371.
doi: 10.1172/jci.insight.147371.

Attenuating persistent sodium current-induced atrial myopathy and fibrillation by preventing mitochondrial oxidative stress

Affiliations

Attenuating persistent sodium current-induced atrial myopathy and fibrillation by preventing mitochondrial oxidative stress

Uma Mahesh R Avula et al. JCI Insight. .

Abstract

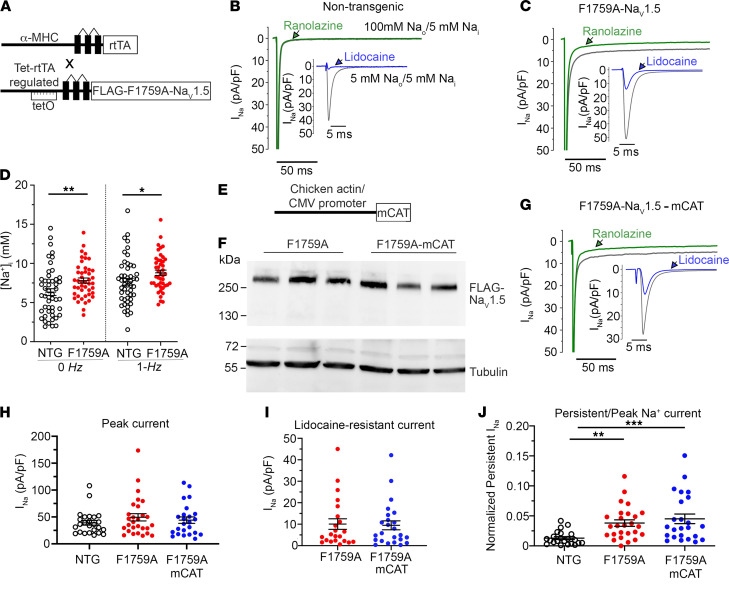
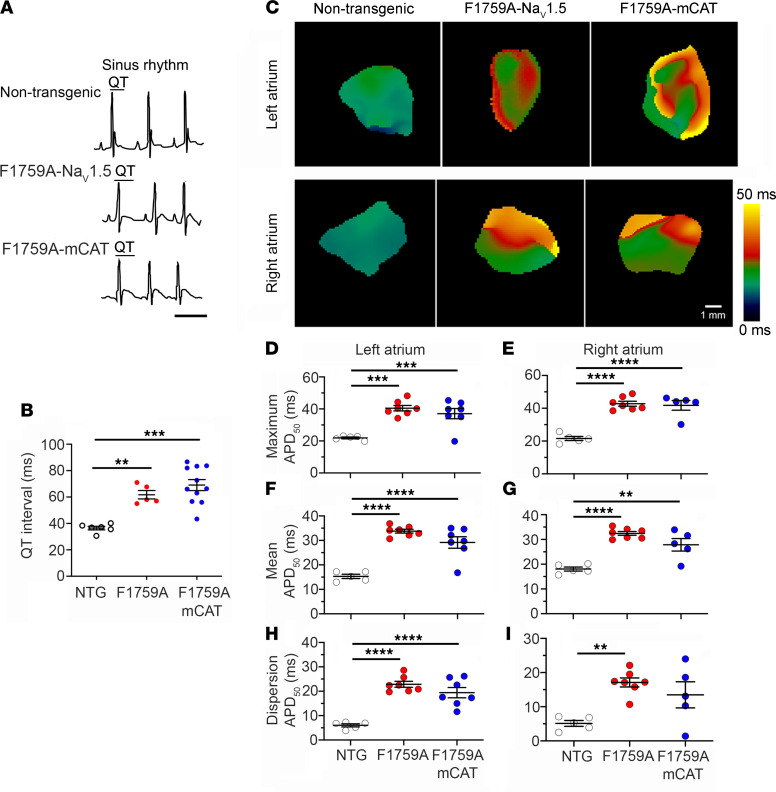
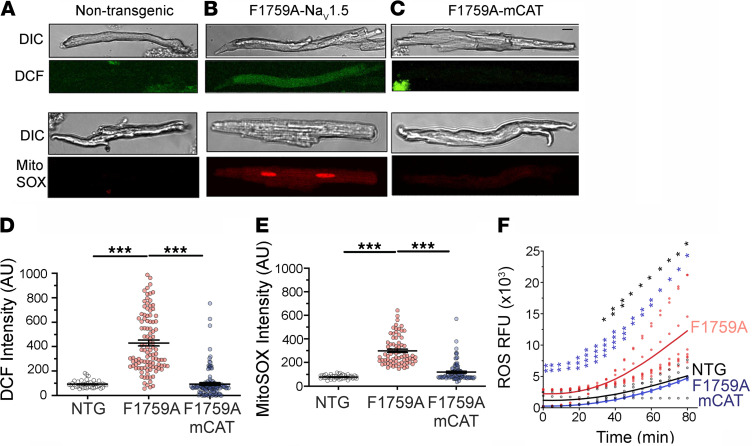
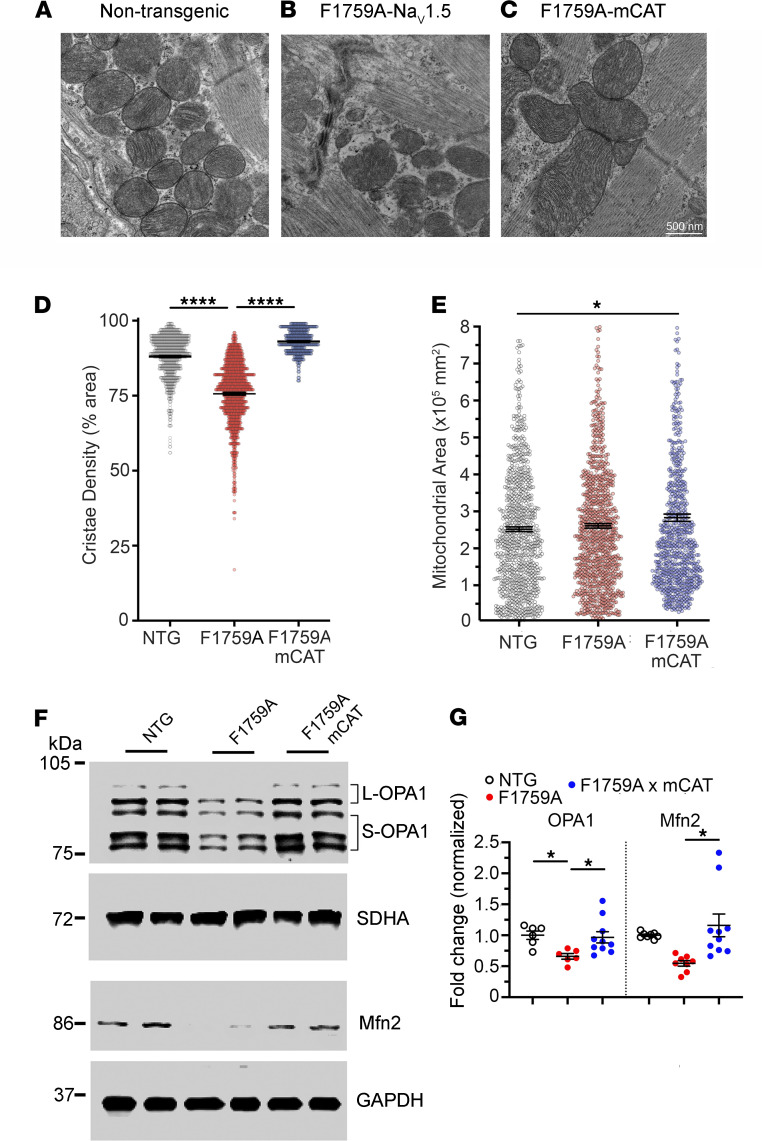
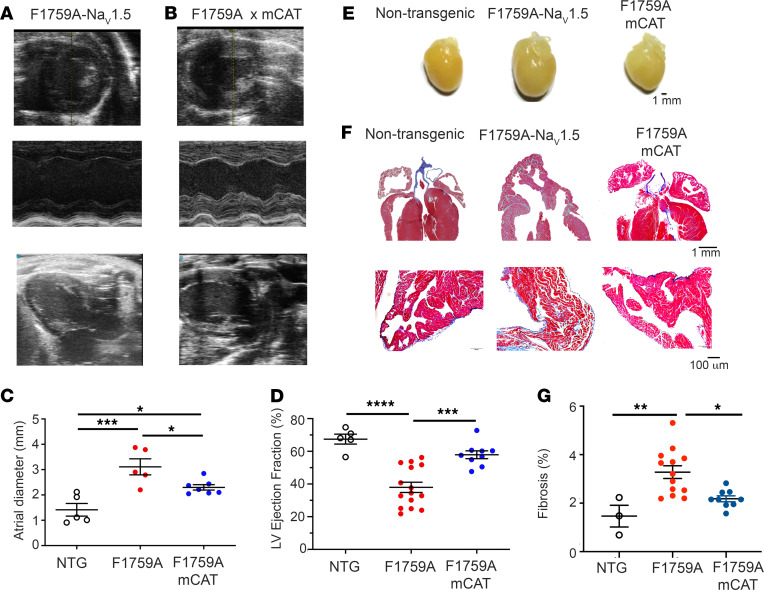
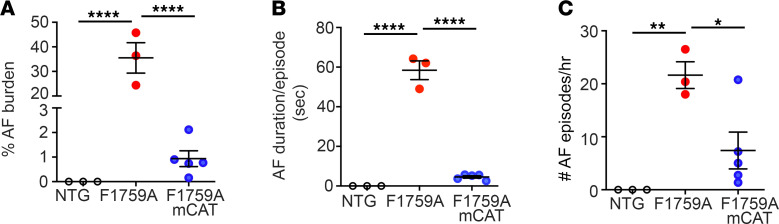
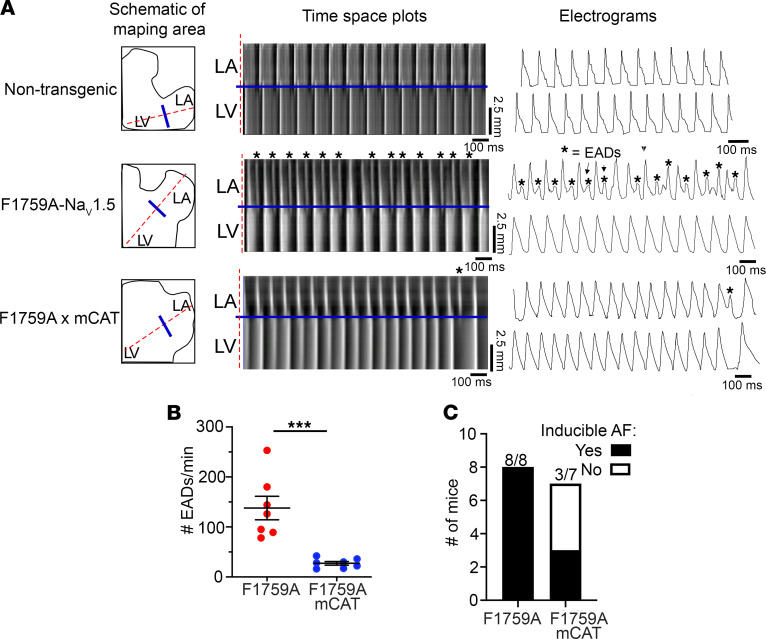
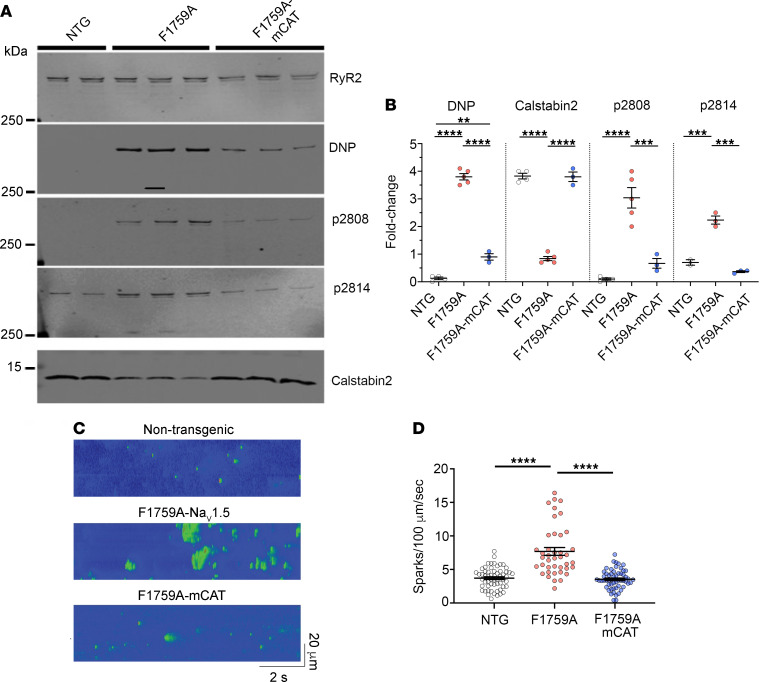
Mechanistically driven therapies for atrial fibrillation (AF), the most common cardiac arrhythmia, are urgently needed, the development of which requires improved understanding of the cellular signaling pathways that facilitate the structural and electrophysiological remodeling that occurs in the atria. Similar to humans, increased persistent Na+ current leads to the development of an atrial myopathy and spontaneous and long-lasting episodes of AF in mice. How increased persistent Na+ current causes both structural and electrophysiological remodeling in the atria is unknown. We crossbred mice expressing human F1759A-NaV1.5 channels with mice expressing human mitochondrial catalase (mCAT). Increased expression of mCAT attenuated mitochondrial and cellular reactive oxygen species (ROS) and the structural remodeling that was induced by persistent F1759A-Na+ current. Despite the heterogeneously prolonged atrial action potential, which was unaffected by the reduction in ROS, the incidences of spontaneous AF, pacing-induced after-depolarizations, and AF were substantially reduced. Expression of mCAT markedly reduced persistent Na+ current-induced ryanodine receptor oxidation and dysfunction. In summary, increased persistent Na+ current in atrial cardiomyocytes, which is observed in patients with AF, induced atrial enlargement, fibrosis, mitochondrial dysmorphology, early after-depolarizations, and AF, all of which can be attenuated by resolving mitochondrial oxidative stress.

Keywords: Arrhythmias; Cardiology; Cardiovascular disease; Sodium channels.


Conflict of interest statement

Conflict of interest: ARM is the founding scientist and chair of the scientific advisory board of ARMGO Pharma, Inc., which is targeting leaky ryanodine receptor channels for treatment of cardiovascular and skeletal muscle disorders, including atrial fibrillation. Both ARM and Columbia University own equity in ARMGO.

Figures

Figure 1
Figure 1. Expression of mitochondrial catalase does not attenuate F1759A-induced Na+ current.
(A) The transgene system permitting expression of FLAG-F1759A-NaV1.5 when reverse tetracycline-controlled transactivator (rtTA) and doxycycline are present (Tet-ON). Top: rtTA-driven expression by the cardiac-specific α–myosin heavy chain (α-MHC) promoter. The 3 noncoding exons that make up the 5′-UTR of the α-MHC gene are depicted as boxes and the introns as lines. Bottom: cDNA for FLAG-F1759A-NaV1.5 ligated behind 7 tandem tetO sequences. (B, C, and G) Exemplary whole-cell Na+ current (INa) traces of atrial cardiomyocytes isolated from control nontransgenic, F1759A-NaV1.5, and F1759A-mCAT mice. Persistent INa was evaluated with a 190 ms depolarization from a holding potential of –110 mV to –30 mV in the absence (black) and presence (green) of ranolazine; 5 mM Na+ in the intracellular solution, and 100 mM Na+ in the extracellular solution. Inset: Peak INa and fraction of lidocaine-resistant current, whole-cell current traces were recorded with 5 mM Na+ in extracellular and intracellular solutions, in the absence (black) and presence (blue) of 3 mM lidocaine. (D) Intracellular Na+ concentration ([Na+]i) in nontransgenic (NTG) and F1759A-NaV1.5 in quiescent (0 Hz) and field-stimulated (1 Hz) atrial cardiomyocytes. Two-way repeated measures ANOVA, P = 0.016, Tukey’s multiple-comparison test: * P < 0.05, ** P = 0.01. n = 5 mice/group. (E) Mitochondria-directed catalase–driven expression by chicken actin/CMV promoter (28). (F) Anti-FLAG (upper) and anti-tubulin immunoblots (lower) of cardiac homogenates of F1759A-NaV1.5 and F1759A-mCAT mice. Representative of 3 experiments. See complete unedited blots in the supplemental material. (H) Peak INa density recorded with 5 mM external Na+. P = 0.46; 1-way ANOVA. (I) Capacitance-normalized peak INa resistance to 3 mM lidocaine. P = 0.86; t test. (J) Persistent INa normalized to peak current. One-way ANOVA, P < 0.001; ** P < 0.01; *** P < 0.001. Mean ± SEM.
Figure 2
Figure 2. Expression of mitochondrial catalase does not attenuate F1759A-NaV1.5–induced prolongation of the action potential duration.
(A) Representative limb-lead surface electrocardiograms of isoflurane-anesthetized nontransgenic control mice, F1759A, and F1759A-mCAT mice in normal sinus rhythm. Scale bar: 100 ms. (B) Graph of QT intervals. Mean ± SEM. One-way ANOVA, P < 0.0001; ** P < 0.01; *** P < 0.001 by Tukey’s multiple-comparison test. (C) Representative optical APD50 maps of right and left atria of nontransgenic, F1759A, and F1759-mCAT mice. APD maps (pacing at 10 Hz) for F1759A-NaV1.5 mice were obtained after hyperkalemia-induced conversion to sinus rhythm. Scale bar: 1 mm. (D and E) Graph showing maximal APD50 in left and right atria of NTG, F1759A-NaV1.5, and F1759A-mCAT mice. Mean ± SEM. One-way ANOVA, P < 0.001 for left atrium, P < 0.0001 for right atrium. *** P < 0.001; **** P < 0.0001 by Tukey’s multiple-comparison test. (F and G) Graphs of mean APD50. Mean ± SEM. P < 0.0001 by 1-way ANOVA; ** P< 0.01; **** P < 0.0001 by Tukey’s multiple-comparison test. (H and I) Graphs of APD50 dispersion. Mean ± SEM, 1-way ANOVA, P < 0.0001 for left atrium, P < 0.01 for right atrium. ** P <0.01; **** P < 0.0001 by Tukey’s multiple-comparison test.
Figure 3
Figure 3. Persistent Na+ current causes mitochondrial dysfunction, which is attenuated by expression of mitochondrial catalase.
(AC) Representative differential interference contrast (DIC) microscopy and fluorescent images of atrial cardiomyocytes stained with either 2′, 7′–dichlorofluorescein (DCF) or MitoSOX red. Scale bar: 15 μm. (D) Graphs of DCF fluorescence in arbitrary units (AU). From left to right n = 42, 106, and 122 atrial cardiomyocytes from n = 5 NTG, 5 F1759A, and 8 F1759A mCAT, respectively. P < 0.0001 by 1-way ANOVA; *** P < 0.0001 by Tukey’s multiple-comparison test. (E) Graph of MitoSOX red fluorescence in AU. From left to right, n = 47, 73, and 93 of atrial cardiomyocytes from n = 5 NTG, 5 F1759A, and 8 F1759A mCAT, respectively. P < 0.0001 by 1-way ANOVA, *** P < 0.0001 by Tukey’s multiple-comparison test. (F) ROS production in relative fluorescence units (RFU) from isolated cardiac mitochondria in nontransgenic, F1759A, and F1759A-mCAT mice. n = 4, 8, and 4 mice, respectively. P = 0.0002 by 2-way ANOVA; * P < 0.05, ** P < 0.01, *** P < 0.001, **** P < 0.0001 by Tukey’s multiple-comparison test. Black asterisks signify tests for NTG vs. F1759A; blue asterisks, F1759A vs. F1759A-mCAT.
Figure 4
Figure 4. Persistent Na+ current induces changes in mitochondria cristae density and area.
(AC) Representative transmission electron microscopy images from atrial slices from control, F1759A, and F1759A-mCAT mice (n = 2 mice in each group). (D) Graph of cristae density. Mean ± SEM. n = 873, 963, and 756 mitochondria, respectively. P < 0.0001 by 1-way ANOVA; **** P < 0.0001 by Tukey’s multiple-comparison test. (E) Graph of mitochondria area. Mean ± SEM. n = 873, 963, and 756 mitochondria, respectively. P < 0.05 by 1-way ANOVA; * P < 0.05 (NTG vs. F1759-mCAT). (F) Representative immunoblots of OPA1 isoforms and Mfn2 from nontransgenic, F1759A, and F1759A-mCAT mouse hearts. Anti-SDHA and anti-GAPDH blots are used as loading controls. See complete unedited blots in the supplemental material. (G) Graphs of normalized fold change for OPA1 and Mfn2. P < 0.01 by 1-way ANOVA. * P < 0.05 by Tukey’s multiple-comparison test.
Figure 5
Figure 5. Expression of mCAT attenuates persistent Na+ current-induced cardiac structural remodeling.
(A and B) Representative transthoracic echocardiography images (upper, short axis; middle, M-mode; lower, long axis) from F1759A and F1759A-mCAT mice. (C) Graph of left atrial diameter derived from echocardiographic studies. Mean + SEM. P < 0.001 by 1-way ANOVA. * P < 0.05; *** P < 0.001 by Tukey’s multiple-comparison test. (D) Graph of LV ejection fraction. Mean ± SEM. P < 0.0001 by 1-way ANOVA. *** P < 0.001, **** P < 0.0001 by Tukey’s multiple-comparison test. (E) Representative photographs of nontransgenic, F1759A, and F1759A-mCAT hearts at 4 months after birth. (F) Representative images of Masson’s trichome stain of hearts (upper) and of left atrium (lower) showing increased fibrosis in F1759A compared with nontransgenic and F1759-mCAT mice. (G) Graph quantifying atrial fibrosis. Data are presented as mean ± SEM. P < 0.01 by 1-way ANOVA. * P < 0.05, ** P < 0.01 by Tukey’s multiple-comparison test.
Figure 6
Figure 6. Reducing mitochondrial ROS attenuates persistent Na+ current-induced spontaneous AF.
(A) Graph showing percentage of AF during 20-hour telemetry recordings in nontransgenic control mice, F1759A mice, and F1759A-mCAT mice. P < 0.0001 by 1-way ANOVA. **** P < 0.0001 by Tukey’s multiple-comparison test. (B) Graph of mean (± SEM) duration of AF in seconds. P < 0.0001 by 1-way ANOVA. **** P < 0.0001 by Tukey’s multiple-comparison test. (C) Graph of mean number of AF episodes/hour in each mouse. P < 0.01 by 1-way ANOVA. * P < 0.05; ** P < 0.01 by Tukey’s multiple-comparison test.
Figure 7
Figure 7. Reducing mitochondrial ROS attenuates EADs and inducible AF.
(A) Time-space plots of left atrium (LA) and left ventricle (LV) during 10 Hz atrial pacing. EADs are marked with asterisks. Single-pixel electrograms showing EADs. (B) Graph of EADs per minute. *** P < 0.001 by unpaired 2-tailed t test. (C) Bar graph depicting number of mice subjected to electrophysiological testing for AF inducibility and the number of mice with AF. P = 0.03 by Fisher’s exact test.
Figure 8
Figure 8. Persistent Na+ current induces RyR2 dysfunction, which is attenuated by expression of mitochondrial catalase.
(A) Representative anti-RyR, anti-DNP, anti-Calstabin2, and anti–phospho-Ser2808 (p2808) and Ser2814 (p2814) antibody immunoblots of RyR2 immunoprecipitates from atrial tissue of nontransgenic, F1759A, and F1759A-mCAT mice. See complete unedited blots in the supplemental material. DNP, 2,4-dinitrophenol. (B) Graphs of quantification normalized to immunoprecipitated RyR2. P < 0.0001 by 1-way ANOVA for DNP, Calstabin2, and p2808, P < 0.001 for p2814. **** P < 0.0001, *** P < 0.001, ** P < 0.01 by Tukey’s multiple-comparison test. (C and D) Representative Ca2+ spark images and graph of Ca2+ spark frequencies from isolated cardiomyocytes from atria of nontransgenic controls, F1759A, and F1759A-mCAT mice. From left to right, n = 58, 41, and 56 atrial cardiomyocytes from 3 mice in each group. P < 0.0001 by 1-way ANOVA; **** P < 0.0001 by Tukey’s multiple-comparison test.

References

    1. Andrade J, et al. The clinical profile and pathophysiology of atrial fibrillation: relationships among clinical features, epidemiology, and mechanisms. Circ Res. 2014;114(9):1453–1468. doi: 10.1161/CIRCRESAHA.114.303211. - DOI - PubMed
    1. Lloyd-Jones DM, et al. Lifetime risk for development of atrial fibrillation: the Framingham Heart Study. Circulation. 2004;110(9):1042–1046. doi: 10.1161/01.CIR.0000140263.20897.42. - DOI - PubMed
    1. Vaziri SM, et al. Echocardiographic predictors of nonrheumatic atrial fibrillation. The Framingham Heart Study. Circulation. 1994;89(2):724–730. doi: 10.1161/01.CIR.89.2.724. - DOI - PubMed
    1. Wakili R, et al. Recent advances in the molecular pathophysiology of atrial fibrillation. J Clin Invest. 2011;121(8):2955–2968. doi: 10.1172/JCI46315. - DOI - PMC - PubMed
    1. Gudbjartsson DF, et al. A sequence variant in ZFHX3 on 16q22 associates with atrial fibrillation and ischemic stroke. Nat Genet. 2009;41(8):876–878. doi: 10.1038/ng.417. - DOI - PMC - PubMed

Publication types

MeSH terms