. 2021 Oct 28;16(10):e0256848.
doi: 10.1371/journal.pone.0256848. eCollection 2021.

Alterations of lung microbial communities in obese allergic asthma and metabolic potential

Affiliations

Alterations of lung microbial communities in obese allergic asthma and metabolic potential

Jongan Lee et al. PLoS One. .

Abstract

In recent years, there has been a rapid increase in microbiome studies to explore microbial alterations causing disease status and unveil disease pathogenesis derived from microbiome environmental modifications. Convincing evidence of lung microbial changes involving asthma has been collected; however, whether lung microbial changes under obesity leads to severe asthma in a state of allergen exposure has not been studied sufficiently. Here, we measured bacterial alterations in the lung of an allergen mouse model induced by a high fat diet (HFD) by using 16S rRNA gene sequencing. A total of 33 pathogen‑free 3‑week‑old male C57BL/6 mice were used, and they divided randomly into two groups. The Chow diet (n = 16) and high fat diet (n = 17) was administrated for 70 days. Mice were sensitized with PBS or Dermatophagoides pteronyssinus extract (Der.p), and concentration levels of total IgE and Der.p-IgE in the blood were measured to quantify immune responses. Although there were no meaningful differences in bacterial species richness in the HFD mouse group, momentous changes of bacterial diversity in the HFD mouse group were identified after the mouse group was exposed to allergens. At a genus level, the fluctuations of taxonomic relative abundances in several bacteria such as Ralstonia, Lactobacillus, Bradyrhizobium, Gaiella, PAC001932_g, Pseudolabrys, and Staphylococcus were conspicuously observed in the HFD mouse group exposed to allergens. Also, we predicted metabolic signatures occurring under microbial alterations in the Chow group versus the Chow group exposed to allergens, as well as in the HFD mouse group versus the HFD group exposed to allergens. We then compared their similarities and differences. Metabolic functions associated with macrophages such as propanoate metabolism, butanoate metabolism, and glycine-serine-threonine metabolism were identified in the HFD group versus the Chow group. These results provide new insights into the understanding of a microbiome community of obese allergic asthma, and shed light on the functional roles of lung microbiota inducing the pathogenesis of severe asthma.


Conflict of interest statement

No competing interests exist.

Figures

Fig 1
Fig 1. Overview of the experiment.
From 4 weeks of age, C57BL/6 male mice (n = 33) were pretreated with a cocktail of antibiotics for 4 days, and separated into 2 treatment groups and fed either a normal diet (Chow, n = 16) or high fat diet (HFD, n = 17). A glucose tolerance test (GTT) was performed after mice had been fed either diet for 42 days. From 49 days, the two diet groups were separated into 2 groups respectively, a normal diet-fed group with phosphate-buffered saline (PBS) sensitization and challenge (Chow, n = 9), a normal diet-fed group with Der.p sensitization and challenge (Chow_Der.p, n = 7), a high fat diet-fed group with PBS sensitization and challenge (HFD, n = 7), and a high fat diet-fed group with Der.p sensitization and challenge (HFD_Der.p group, n = 10). After 70 days of diet, blood and lung tissues were collected.
Fig 2
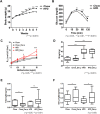
Fig 2. Body weight, IPGTT, AHR, the levels of Der.p-specific IgE, and total IgE in groups.
(A) The body weight of High-fat diet (HFD) group (n = 17) gradually increased compared with a normal diet (Chow) group (n = 16). (B) Comparison of blood glucose levels in Chow and HFD group by an IPGTT. (mean ± SEM for 16–17 mice/treatment) (C) The AHR was measured by total resistance of the repiratory system(Rrs) in response to methacholine. (D) Comparison of body weight at 70 days gained in Chow and HFD mice. (E, F) The levels of total-IgE and Der.p specific-IgE in serum. (mean ± SEM for 7–10 mice/treatment) (*p<0.05, **p<0.01, ***p<0.001).
Fig 3
Fig 3. The relative abundances of bacteria at a genus level in Chow (n = 9), Chow_Der.p (n = 7), HFD (n = 7), and HFD_Der.p (n = 10) groups.
(A) Bar chart of taxonomic proportions at a genus level. ETC taxa (under 1% in average) were not considered for comparison between groups. The asterisk (*) indicates statistically significant bacteria (Wilcoxon rank-sum test, p<0.05) for at least one group compared with other groups. Boxplot for the relative abundances of (B) Ralstonia and (C) Lactobacillus at a genus level with p-values (Wilcoxon rank-sum test). The median (line within the box), lower quartiles (Q1), upper quartiles (Q3), non-outlier range (whiskers), and outliers (dot) was described in the boxplot.
Fig 4
Fig 4. The relative abundances of bacteria at a species level in Chow (n = 9), Chow_Der.p (n = 7), HFD (n = 7), and HFD_Der.p (n = 10) groups.
(A) Bar chart of taxonomic proportions at a species level. ETC taxa (under 1% in average) were not considered for comparison between groups. The asterisk (*) indicates statistically significant bacteria (Wilcoxon rank-sum test, p<0.05) for at least one group compared with other groups. Boxplot for the relative abundances of (B) Ralstonia_uc and (C) Bradyrhizobium japonicum group at the species level with p-values (Wilcoxon rank-sum test). The median (line within the box), lower quartiles (Q1), upper quartiles (Q3), non-outlier range (whiskers), and outliers (dot) was described in the boxplot.
Fig 5
Fig 5. Alpha and beta diversity in lung microbiome in Chow (n = 9), Chow_Der.p (n = 7), HFD (n = 7), and HFD_Der.p groups (n = 10).
The boxplot of (A) Chao1, (B) Shannon index was shown with p-values (Wilcoxon rank-sum test). The median (line within the box), lower quartiles (Q1), upper quartiles (Q3), non-outlier range (whiskers), and outliers (dot) was described in the boxplot. (C) The PCoA analysis was fulfilled at a species level with UniFrac distances, including unclassified OTUs.
Fig 6
Fig 6. Predicted metabolic signatures based on 16S rRNA data.
PICRUSt and LEfSe analyses were performed to predict functional potential within KEGG categories. The cut-off of LDA scores is 2 and p<0.05. The asterisk (*) indicates pathways identified only in the HFD group against the Chow group. (A) Chow (n = 9) group versus Chow_Der.p (n = 7) group, (B) HFD (n = 7) group versus HFD_Der.p (n = 10) group.

References

    1. Murdoch JR, Lloyd CM. Chronic inflammation and asthma. Mutat Res—Fundam Mol Mech Mutagen. 2010;690: 24–39. doi: 10.1016/j.mrfmmm.2009.09.005 - DOI - PMC - PubMed
    1. Kankaanranta H, Kauppi P, Tuomisto LE, Ilmarinen P. Emerging comorbidities in adult asthma: Risks, clinical associations, and mechanisms. Mediators Inflamm. 2016;2016: 3690628. doi: 10.1155/2016/3690628 - DOI - PMC - PubMed
    1. Fukutomi Y, Taniguchi M, Nakamura H, Konno S, Nishimura M, Kawagishi Y, et al.. Association between body mass index and asthma among japanese adults: Risk within the normal weight range. Int Arch Allergy Immunol. 2012;157: 281–287. doi: 10.1159/000327555 - DOI - PubMed
    1. Beuther DA, Sutherland ER. Overweight, obesity, and incident asthma: A meta-analysis of prospective epidemiologic studies. Am J Respir Crit Care Med. 2007;175: 661–666. doi: 10.1164/rccm.200611-1717OC - DOI - PMC - PubMed
    1. McClean KM, Kee F, Young IS, Elborn JS. Obesity and the lung: 1. Epidemiology. Thorax. 2008;63: 649–654. doi: 10.1136/thx.2007.086801 - DOI - PubMed

Publication types