. 2021 Oct 28;22(1):771.
doi: 10.1186/s12864-021-08057-4.

A cis-regulatory element promoting increased transcription at low temperature in cultured ectothermic Drosophila cells

Affiliations

A cis-regulatory element promoting increased transcription at low temperature in cultured ectothermic Drosophila cells

Yu Bai et al. BMC Genomics. .

Erratum in

Abstract

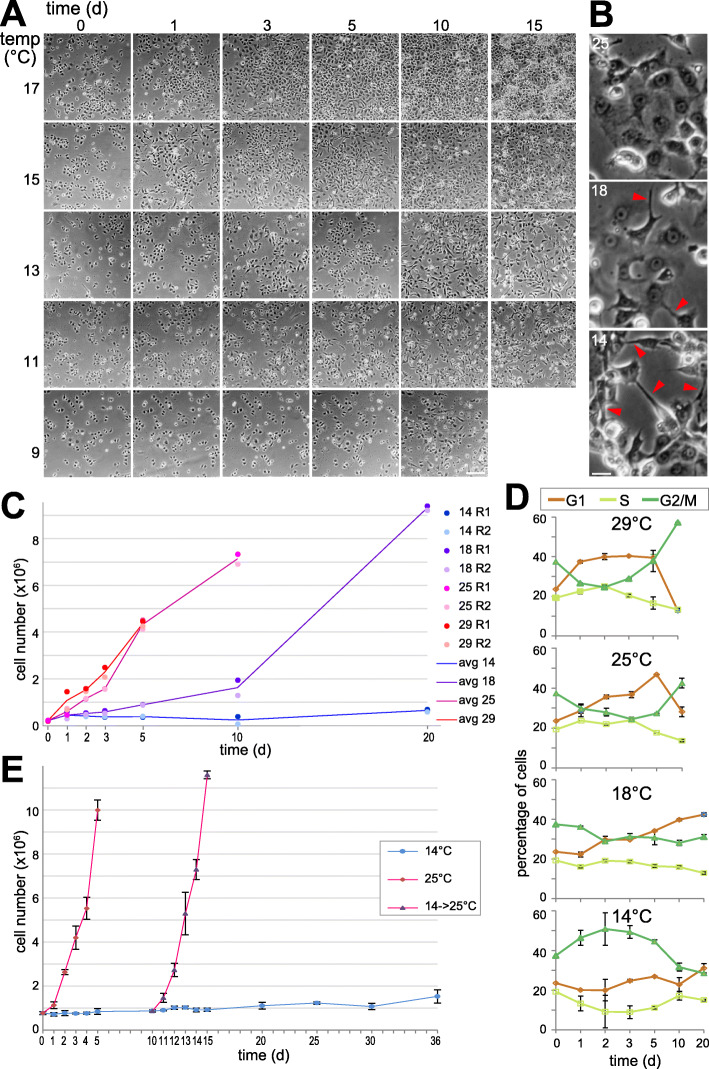
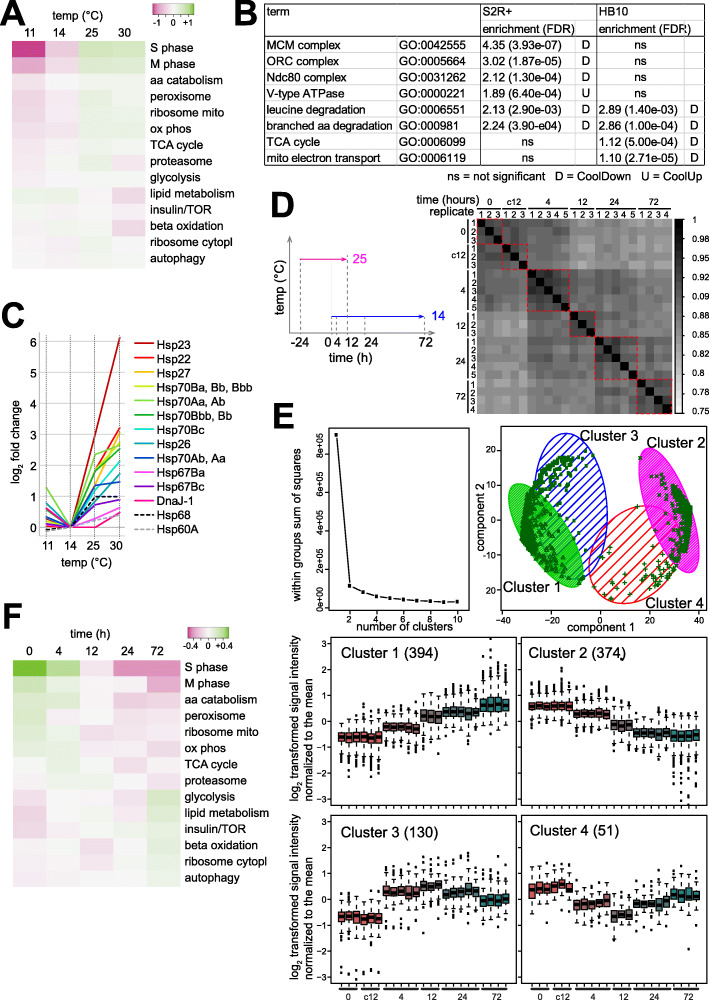
Background: Temperature change affects the myriad of concurrent cellular processes in a non-uniform, disruptive manner. While endothermic organisms minimize the challenge of ambient temperature variation by keeping the core body temperature constant, cells of many ectothermic species maintain homeostatic function within a considerable temperature range. The cellular mechanisms enabling temperature acclimation in ectotherms are still poorly understood. At the transcriptional level, the heat shock response has been analyzed extensively. The opposite, the response to sub-optimal temperature, has received lesser attention in particular in animal species. The tissue specificity of transcriptional responses to cool temperature has not been addressed and it is not clear whether a prominent general response occurs. Cis-regulatory elements (CREs), which mediate increased transcription at cool temperature, and responsible transcription factors are largely unknown.

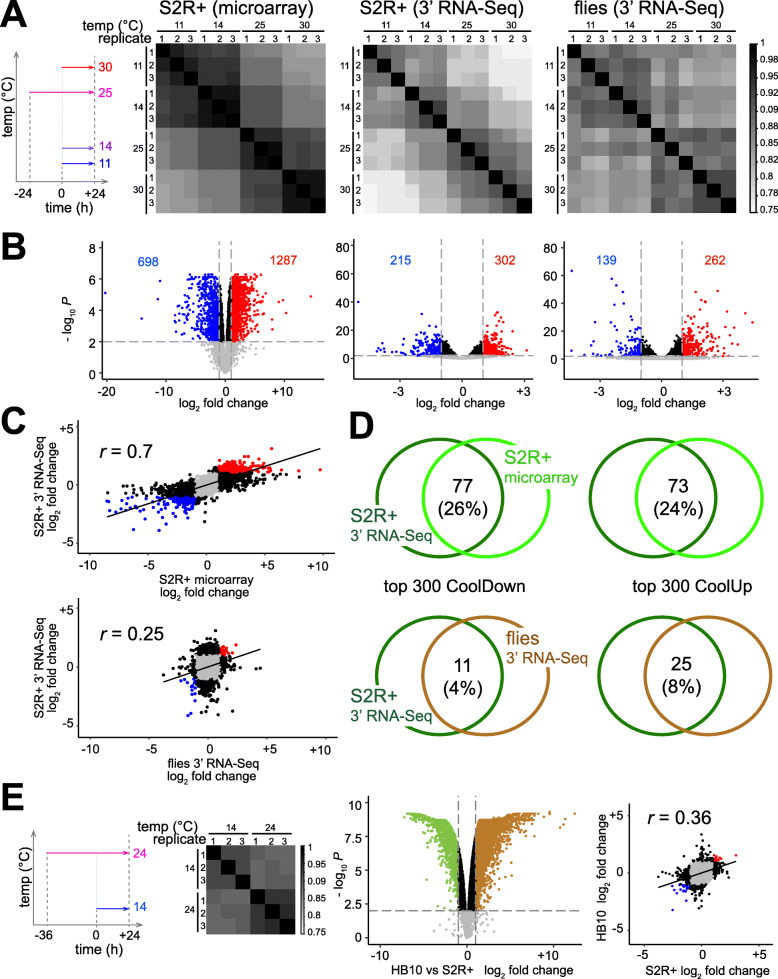
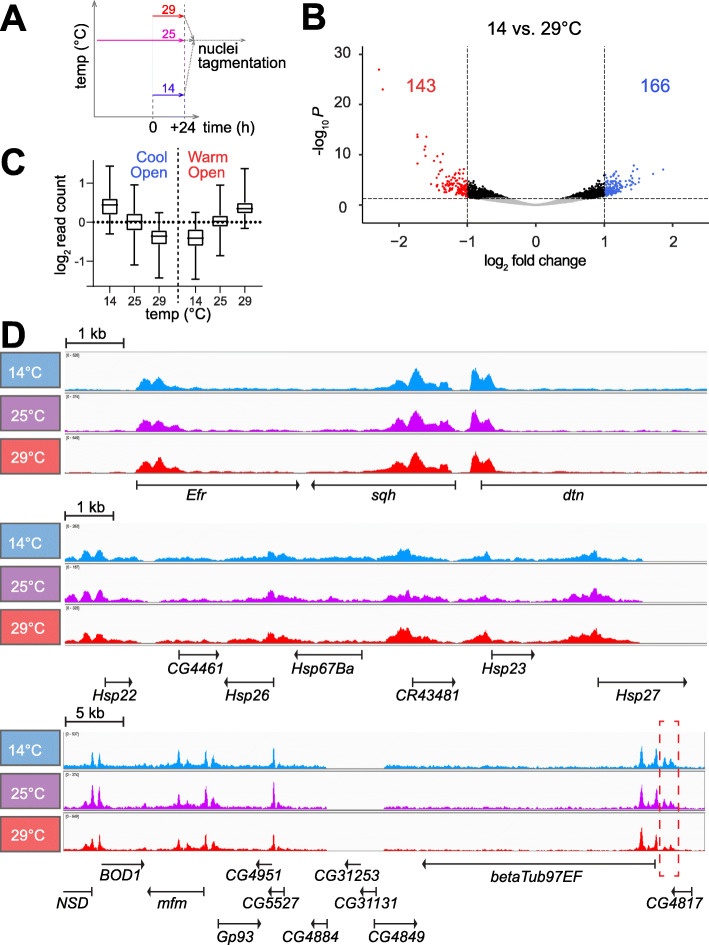
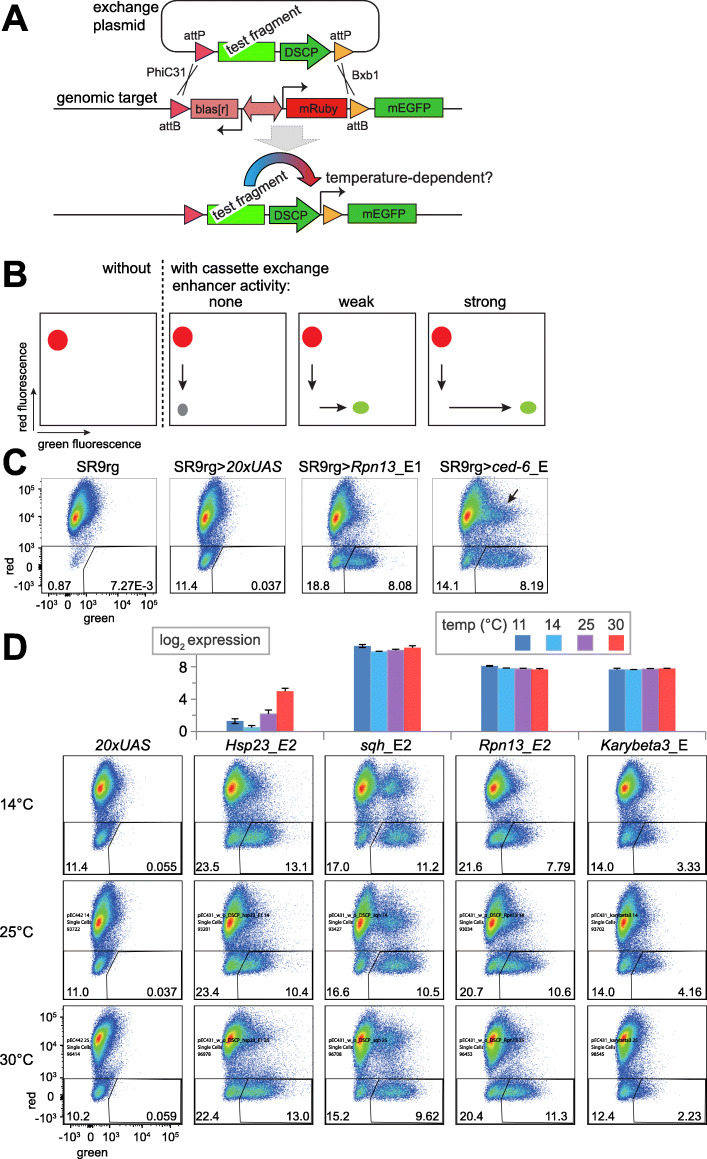
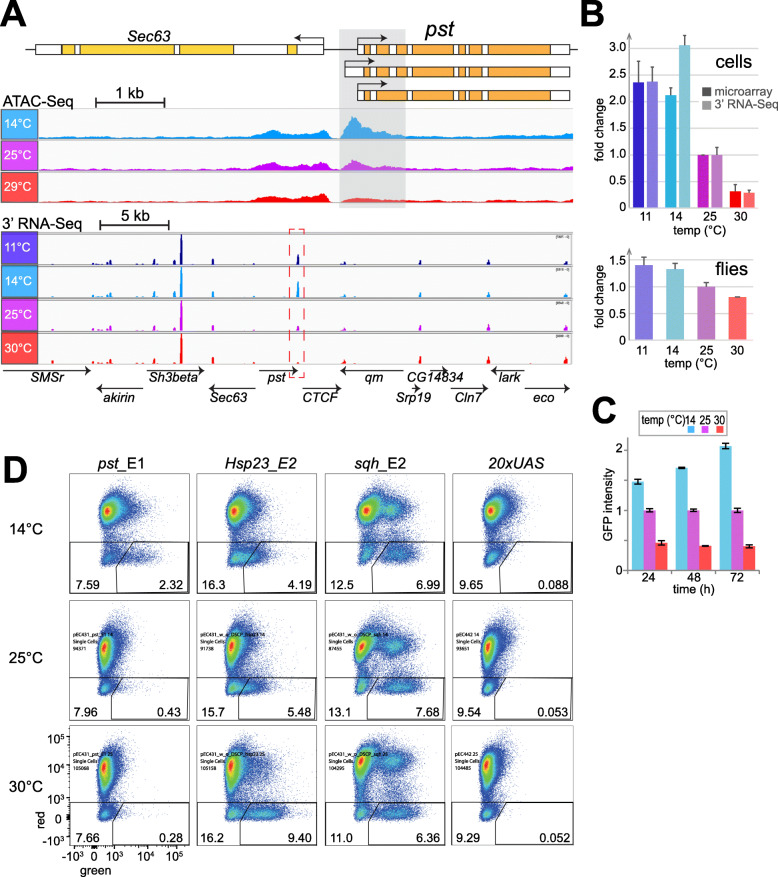
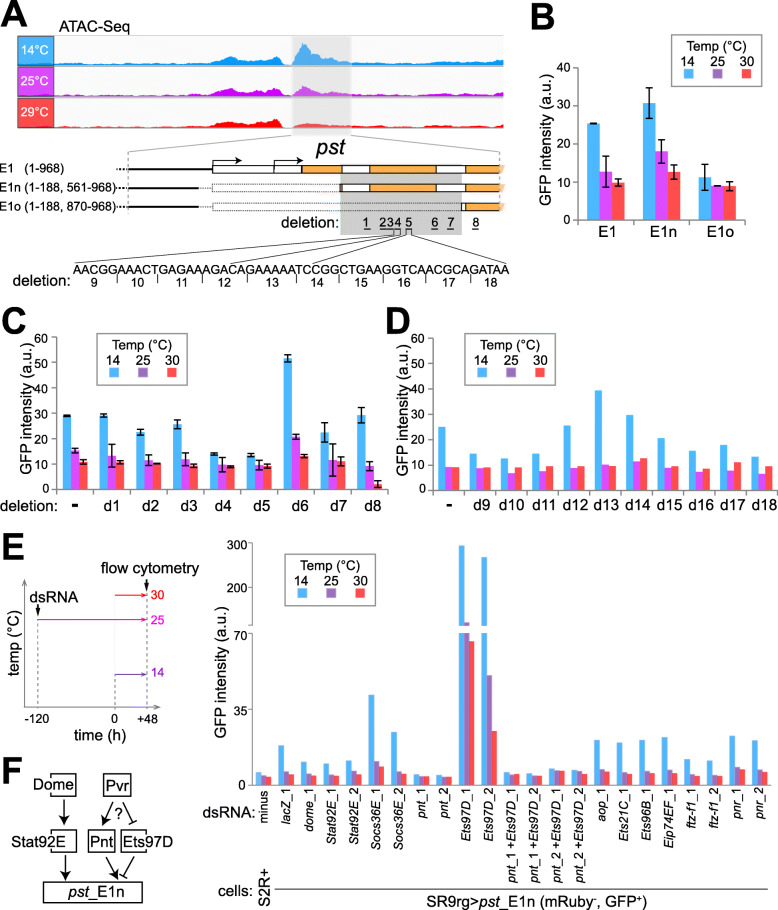
Results: The ectotherm Drosophila melanogaster with a presumed temperature optimum around 25 °C was used for transcriptomic analyses of effects of temperatures at the lower end of the readily tolerated range (14-29 °C). Comparative analyses with adult flies and cell culture lines indicated a striking degree of cell-type specificity in the transcriptional response to cool. To identify potential cis-regulatory elements (CREs) for transcriptional upregulation at cool temperature, we analyzed temperature effects on DNA accessibility in chromatin of S2R+ cells. Candidate cis-regulatory elements (CREs) were evaluated with a novel reporter assay for accurate assessment of their temperature-dependency. Robust transcriptional upregulation at low temperature could be demonstrated for a fragment from the pastrel gene, which expresses more transcript and protein at reduced temperatures. This CRE is controlled by the JAK/STAT signaling pathway and antagonizing activities of the transcription factors Pointed and Ets97D.

Conclusion: Beyond a rich data resource for future analyses of transcriptional control within the readily tolerated range of an ectothermic animal, a novel reporter assay permitting quantitative characterization of CRE temperature dependence was developed. Our identification and functional dissection of the pst_E1 enhancer demonstrate the utility of resources and assay. The functional characterization of this CoolUp enhancer provides initial mechanistic insights into transcriptional upregulation induced by a shift to temperatures at the lower end of the readily tolerated range.

Keywords: Cool temperature acclimation; Drosophila; Ectotherm; Ets97D; His2Av; NRF-2/GABP; S2R+ cells; Transcriptional control; cis-regulatory element (CRE); pastrel (pst).


Conflict of interest statement

The authors declare that they have no competing interests.

Figures

Fig. 1
Fig. 1
Proliferation of S2R+ cells at suboptimal temperatures. (A, B) For microscopic evaluation of cell proliferation, cells were plated in aliquots and shifted to the indicated suboptimal temperatures. Phase contrast images of the same regions were acquired at the indicated times after downshift. (B) High magnification views of cells grown to comparable cell density at the indicated temperatures illustrate increased cell aggregation and longer extensions (arrowheads) at low temperature. Scale bar = 50 μm (A) and 10 μm (B). (C) Cells were counted to assess cell proliferation at different temperatures (14, 18, 25 and 29 °C). Culture aliquots were shifted to the different target temperatures, followed by counting at the indicated times after the shift. Two replicates (R1 and R2) were analyzed for each temperature and time point. Counts of viable cells in the two replicates and their mean are displayed. (D) Temperature effects on the cell cycle profile. Additional culture aliquots beyond those used for the counting shown in panel (C) were analyzed by flow cytometry after DNA staining for identification of cells in the G1, S and G2/M phase. Mean and standard deviation (s.d.) are displayed (n = 2). (E) Immediate recovery of cell proliferation rate at 25 °C after prolonged incubation at 14 °C. Culture aliquots were shifted to either 14 or 25 °C. Moreover, after 10 days of incubation at 14 °C, some aliquots were transferred back to 25 °C. Mean and s.d. of the counts of viable cells are displayed (n = 3)
Fig. 2
Fig. 2
Temperature dependence of transcriptome in S2R+ and HB10 cells and adult male flies. (A, B) Aliquots of S2R+ cells and adult males were shifted to the indicated temperatures (11, 14, 25 and 30 °C) before RNA isolation (n = 3). A first experiment with S2R+ cells was analyzed with DNA microarrays, a second with S2R+ cells and adult males using 3′ RNA-Seq. (A) Pearson’s correlation coefficients after pairwise comparisons revealed maximal similarities between replicates from the same temperature and greater similarity of the transcriptomes at the lower temperatures (11 and 14 °C) compared to the higher temperatures (25 and 30 °C). (B) The number of CoolUp genes (blue dots) and CoolDown genes (red dots) with significantly different expression at the lower compared to the higher temperatures (FDR < 0.01; fold change ≥2). (C, D) Limited similarity of the transcriptome response to temperature change in S2R + cells and adult male flies. (C) Scatter plots of the fold changes of transcript levels (lower versus higher temperatures) either observed in the two experiments with S2R+ cells (top) or in the two 3′ RNA-Seq experiments with S2R+ cells and adult male flies (bottom). r = Pearson’s correlation coefficient. (D) Overlap among the top 300 CoolUp (left side) and CoolDown (right side) genes either in the two experiments with S2R+ cells (top) or in the two 3′ RNA-Seq experiments with S2R+ cells and adult male flies (bottom). (E) Transcriptome changes in response to low temperature in HB10 cells. Culture aliquots were shifted to the indicated temperatures (14 and 24 °C) before expression profiling. Pearson’s correlation coefficients obtained after pairwise comparison of the different samples, a volcano plot and a scatter plot are displayed
Fig. 3
Fig. 3
Cool temperature effects in S2R+ cells on cell cycle and stress genes. (A) Temperature dependence of transcript levels of genes functionally associated with central cellular processes. Microarray data of the S2R+ cell transcriptome at the indicated temperatures was used for an analysis with curated sets of genes associated with the indicated cellular processes. (B) Enrichment of gene ontology (GO) terms by temperature-regulated genes reveal cell-type specific differences between S2R+ and HB10 cells. (C) Expression of Hsp genes is minimal at 14 °C in S2R+ cells. (D) Time course analysis of the transcriptional response to a 25- > 14 °C temperature downshift in S2R+ cells using microarrays. Culture aliquots were analyzed at the indicated times after downshift (0, 4, 12, 24 and 72 h), as well as samples maintained at 25 °C for an additional 12 h (c12). The Pearson’s correlation coefficients obtained after pairwise comparison of the different samples revealed maximal similarities between the three to five replicates from the same time point (red dashed squares). (E) Gene clusters with similar temporal expression profiles in response to a 25- > 14 °C temperature downshift identified by k-means clustering using probes with differential expression over time. Plot (top left) obtained by the elbow method [45] after analysis of clusters resulting with increasing k. Additional plots describe the clusters obtained at k = 4. Temporal profiles of signal intensities revealed steady increase and decrease in cluster 1 and 2, or transient increase and decrease in the two partially separated clusters 3 and 4. Numbers of probes assigned to the four clusters are given. (F) Temporal profile of transcript levels from genes with functional association to central cellular processes
Fig. 4
Fig. 4
Temperature effects on DNA accessibility in nuclear chromatin of S2R+ cells. (A) Culture aliquots were shifted to the indicated temperatures and 24 h later analyzed by ATAC-Seq involving tagmentation in crude nuclei always at 25 °C. Three biological replicates were analyzed. (B) Volcano plots illustrate fold changes of read counts in ATAC-Seq peaks when comparing 14 with 29 °C. Peaks with insignificant change (FDR ≥ 0.05) are shown in grey, those with significant but limited change (FC ≤ 2) in black, and those with a strong change (FC > 2) in either blue (CoolOpen) or red (WarmOpen). (C) CoolOpen and WarmOpen regions (see panel B) have intermediate accessibility at 25 °C on average. (D) Browser tracks display read counts obtained by ATAC-Seq at the indicated temperatures within selected genome regions. While the region shown in the top panel does not include temperature-regulated genes (including sqh), the region shown in middle panel contains small Hsp genes with transcript levels that were most strongly CoolDown. The bottom panel includes betaTub97EF with strongly CoolUp transcript levels [53]. Just upstream of this betaTub97EF gene, a CoolOpen region was apparent (dashed red rectangle). In contrast, at most modest accessibility alterations appear to be induced by temperature change in the other regions
Fig. 5
Fig. 5
Assay for analysis of temperature dependence of CREs. (A) Scheme of assay involving an engineered target locus in SR9rg cells for directional RMCE. After insertion of a candidate CRE into an exchange plasmid and cotransfection with a dual integrase expression plasmid (not shown) for production of the PhiC31 and Bxb1 integrases, the chromosomal cassette (with bidirectional blasr and mRuby marker genes) can be replaced with the exchange plasmid cassette where the CRE is in front of the DSCP promoter. After RMCE, CRE activity can drive expression of green fluorescence in the resulting cell population, which can be cultured in aliquots at different temperatures before analysis by flow cytometry. (B) Flow cytometric analysis of enhancer activity of test fragments after RMCE with SR9rg cells. Cartoons of scatter plots with red and green fluorescence intensity along x and y axis depict expected results (from left to right): SR9rg cells before RMCE express mRuby but not mEGFP. RMCE with a test fragment lacking enhancer activity will generate a cell population with neither red nor green fluorescence (grey spot). In contrast, an enhancer fragment will result in a population that expresses only green fluorescence with an intensity depending on enhancer activity. (C) Validation of the SR9rg assay system. Scatter plots after flow cytometric analysis (from left to right): SR9rg cells before and after RMCE with the test fragments 20 × UAS, Rpn13_E1 and ced-6_E. Analyzed windows and percentage of cells therein are indicated. In the rightmost scatter plot, a population of cells expressing both red and green fluorescence is indicated (arrow). (D) Temperature-dependence of CRE activity. Test fragments from genes with temperature-regulated transcript levels (Hsp23) or without (sqh, Rpn13, Karybeta3), as indicated by 3′ RNA-Seq (bar diagrams). After RMCE, aliquots of the cells were shifted to 14, 25 or 30 °C before flow cytometric analysis
Fig. 6
Fig. 6
A fragment from CoolUp gene pastrel with increased enhancer activity at low temperature. (A) Increased DNA accessibility at low temperature in region (grey shading) in the 5′ region of pst, a gene with higher transcript levels at low temperature. The genomic pst region is shown schematically (top), as well as browser tracks obtained from S2R+ cells at the indicated temperatures (average of three biological replicates) by either ATAC-Seq data (middle) or 3′ RNA-Seq (bottom). (B) Quantification of pst transcript levels at the indicated temperatures in S2R+ cells (top) and adult male flies (bottom). Results from two independent analyses, by microarray and 3′ RNA-Seq, respectively, are displayed in case of S2R+ cells. The data for flies was obtained by 3′ RNA-Seq. Average of three biological replicates and s.d. are shown, relative to expression at 25 °C, which was set to 1. (C) Quantification of EGFP-Pst protein expression levels at the indicated temperatures by flow cytometry. Culture aliquots of S2R + _g-EGFP-pst cells were shifted to the indicated temperatures and analyzed at the indicated times after the shift. Average of three biological replicates and s.d. are shown, relative to expression at 25 °C, which was set to 1. (D) Temperature dependence of the enhancer activity of the pst_E1 fragment (shaded region in panel A) analyzed after RMCE with SR9rg cells. For comparison the fragments Hsp23_E2, sqh_E2 and 20 × UAS were analyzed in parallel. After RMCE, cells were shifted eventually to the indicated temperatures and 48 h later analyzed by flow cytometry
Fig. 7
Fig. 7
Characterization of the CoolUp enhancer from pastrel. (A) The CoolUp enhancer activity of the CoolOpen region in the pst 5′ region identified by ATAC-Seq (pst_E1, light grey shading) was further analyzed with terminal and internal deletion series. Comparison of E1n and E1o revealed an internal region essential for enhancer activity (dark grey shading). The internal deletions d1–8 eliminate predicted transcription factor binding sites. The consecutive 5 bp deletions d9–18 scan the d4-d5 region. (B-D) Comparison of enhancer activity of E1 and derived fragments at the indicated temperatures as detected after RMCE with SR9rg cells. Bar diagrams display the median GFP signal intensity in the scatter plot window with cells expressing green but not red fluorescence. Analysis of the fragments E1, E1n and E1o (B), E1n derivatives carrying one of the deletions d1–8 (C), or one of the deletions d9–18 (D). Average of duplicates +/− s.d. shown in (B), and values from a single experiment in (D). (E) Characterization of the role of transcription factors (TFs) with predicted binding sites in E1n. The indicated TFs were depleted in SR9rg > pst_E1n (mRuby, GFP+) cells, followed by a shift of culture aliquots to the indicated temperature and subsequent flow cytometric analysis. Bar diagram represents median GFP intensity of the cell population lacking red fluorescence. In most cases, two independent dsRNA preparations generated from distinct amplicons (xy_1 and xy_2) were used for depletion. Untreated S2R+ cells and SR9rg > pst_E1n (mRuby, GFP+) cells treated with lacZ dsRNA were used as negative and positive control, respectively. (F) Schematic summary model for the control of pst_E1 CoolUp enhancer activity. The JAK/STAT signaling pathway (with the transmembrane receptor Dome and the downstream TF STAT92E) acts positively. The TFs Pnt and Ets97D act as competing activator and repressor, respectively, presumably downstream of the Pvr receptor tyrosine kinase

References

    1. Ritossa F. A new puffing pattern induced by temperature shock and DNP in Drosophila. Experientia. 1962;18(12):571–3. 10.1007/BF02172188.
    1. Vihervaara A, Duarte FM, Lis JT. Molecular mechanisms driving transcriptional stress responses. Nat Rev Genet. 2018;19(6):385–97. 10.1038/s41576-018-0001-6. - PMC - PubMed
    1. Gomez-Pastor R, Burchfiel ET, Thiele DJ. Regulation of heat shock transcription factors and their roles in physiology and disease. Nature reviews. Mol Cell Biol. 2018;19(1):4–19. 10.1038/nrm.2017.73. - PMC - PubMed
    1. Liu AY, Bian H, Huang LE, Lee YK. Transient cold shock induces the heat shock response upon recovery at 37 degrees C in human cells. J Biol Chem. 1994;269(20):14768–75. 10.1016/S0021-9258(17)36691-7. - PubMed
    1. Colinet H, Hoffmann A. Gene and protein expression of Drosophila Starvin during cold stress and recovery from chill coma. Insect Biochem Mol Biol. 2010;40(5):425–8. 10.1016/j.ibmb.2010.03.002. - PubMed