. 2021 Oct 28;13(1):170.
doi: 10.1186/s13073-021-00989-6.

Novel temporal and spatial patterns of metastatic colonization from breast cancer rapid-autopsy tumor biopsies

Affiliations

Novel temporal and spatial patterns of metastatic colonization from breast cancer rapid-autopsy tumor biopsies

Xiaomeng Huang et al. Genome Med. .

Abstract

Background: Metastatic breast cancer is a deadly disease with a low 5-year survival rate. Tracking metastatic spread in living patients is difficult and thus poorly understood.

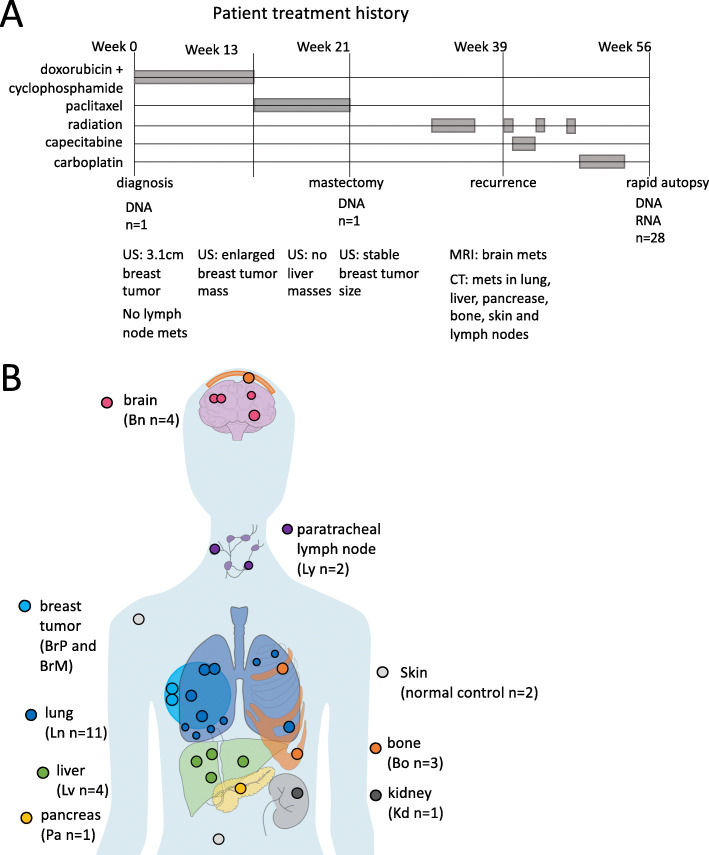
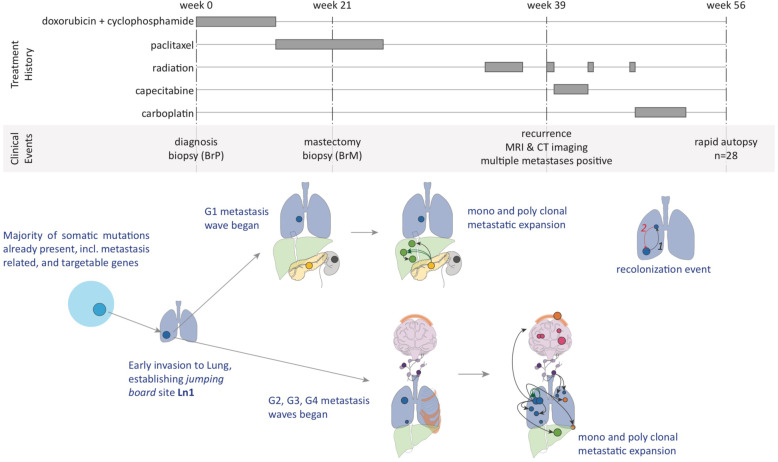
Methods: Via rapid autopsy, we have collected 30 tumor samples over 3 timepoints and across 8 organs from a triple-negative metastatic breast cancer patient. The large number of sites sampled, together with deep whole-genome sequencing and advanced computational analysis, allowed us to comprehensively reconstruct the tumor's evolution at subclonal resolution.

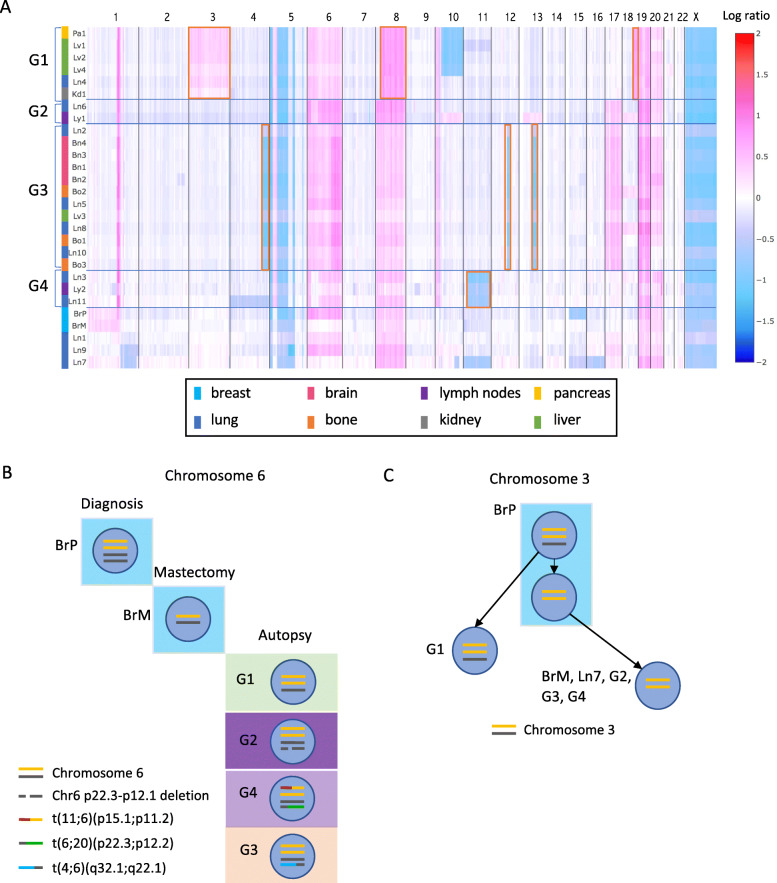
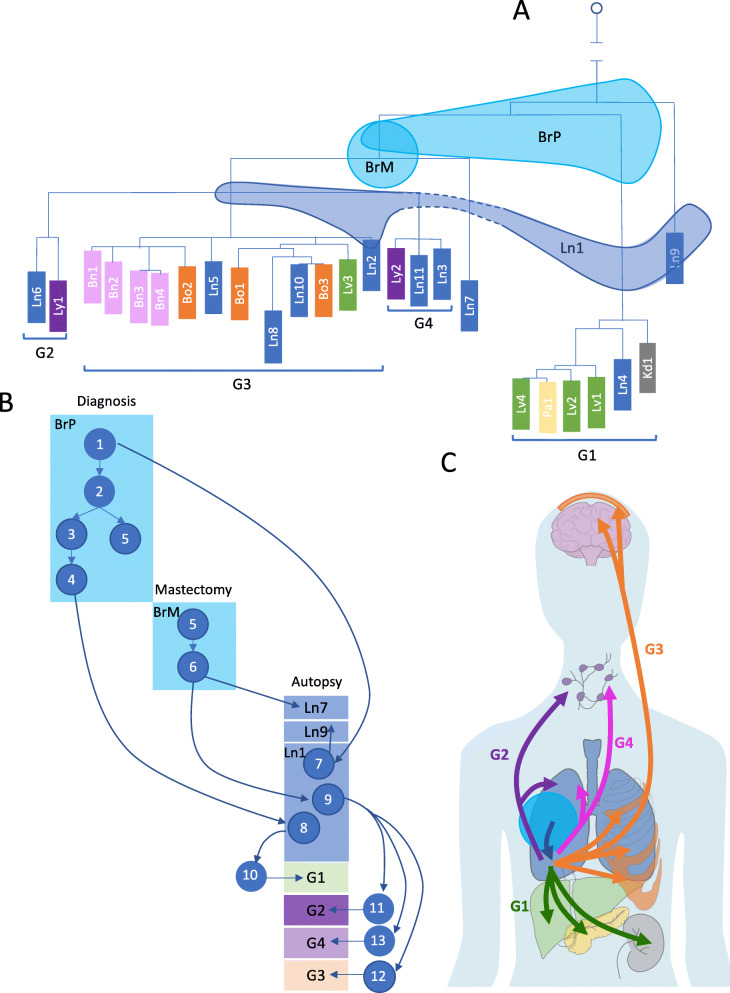
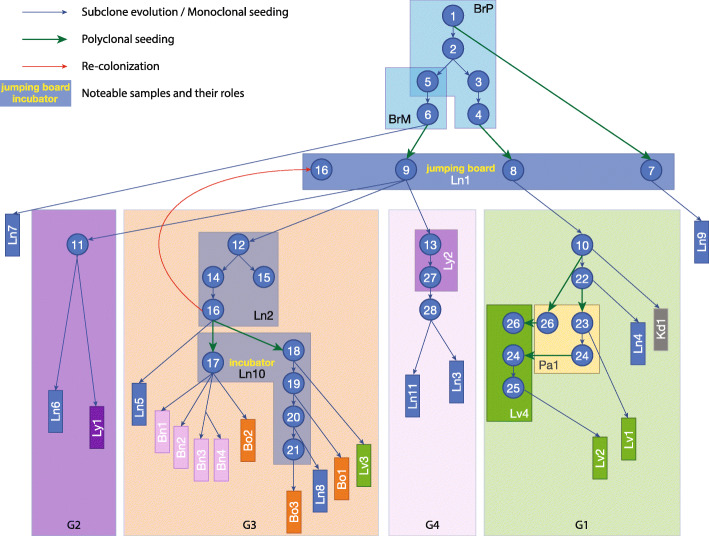
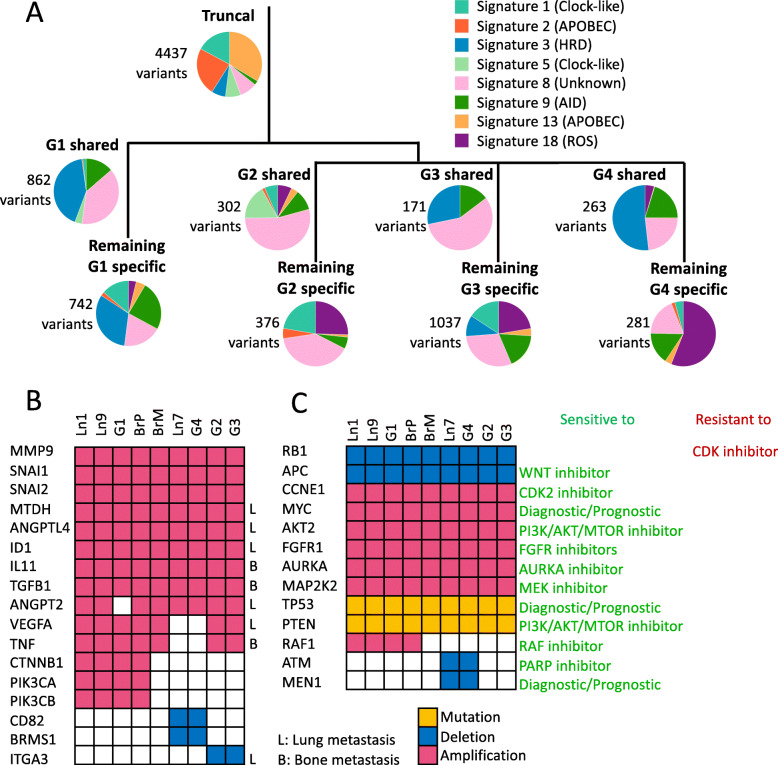
Results: The most unique, previously unreported aspect of the tumor's evolution that we observed in this patient was the presence of "subclone incubators," defined as metastatic sites where substantial tumor evolution occurs before colonization of additional sites and organs by subclones that initially evolved at the incubator site. Overall, we identified four discrete waves of metastatic expansions, each of which resulted in a number of new, genetically similar metastasis sites that also enriched for particular organs (e.g., abdominal vs bone and brain). The lung played a critical role in facilitating metastatic spread in this patient: the lung was the first site of metastatic escape from the primary breast lesion, subclones at this site were likely the source of all four subsequent metastatic waves, and multiple sites in the lung acted as subclone incubators. Finally, functional annotation revealed that many known drivers or metastasis-promoting tumor mutations in this patient were shared by some, but not all metastatic sites, highlighting the need for more comprehensive surveys of a patient's metastases for effective clinical intervention.

Conclusions: Our analysis revealed the presence of substantial tumor evolution at metastatic incubator sites in a patient, with potentially important clinical implications. Our study demonstrated that sampling of a large number of metastatic sites affords unprecedented detail for studying metastatic evolution.

Keywords: Metastatic breast cancer; Subclone; Tumor evolution.


Conflict of interest statement

The authors declare that they have no competing interests.

Figures

Fig. 1
Fig. 1
Patient treatment history and sample origins. A Treatment history over the course of disease progression as well as imaging history including ultrasound (US) imaging, MRI, and CT scan. B Primary breast tumors at diagnosis (BrP) and at mastectomy (BrM) were biopsied. 26 metastatic tumors and 2 normal skin autopsy samples were collected through a rapid-autopsy procedure. Placements of samples are indicative of organ-of-origin, not actual sample locations
Fig. 2
Fig. 2
Genomic CNV profiles across samples reveal metastatic waves. A Heatmap of copy number profile across all samples. Chromosomal coordinates are on the x-axis, and samples are plotted along the y-axis. Colors in the heatmap represent the log2 ratio of tumor copy number to normal copy number. Samples with similar CNV profiles are grouped together as G1, G2, G3, and G4. The shared CNVs in each group are highlighted in red boxes. Colored bars beside the sample names represent the host organs: lung(blue), bone(orange), brain(pink), breast(cyan), liver(green), kidney(grey), and pancreas(yellow). B An example of samples in the same group sharing complicated structural variants on chromosome 6, further confirming CNV-based grouping. Yellow and black lines are the two alleles of chromosome 6. A deletion occurred between 6p22.3 and 6p12.1 on one black allele in G2. A translocation occurred between chromosome 11 and one yellow allele of chromosome 6, designated as t(11;6)(p15.1;p11.2) (red and yellow line), and a translocation occurred between one black allele of chromosome 6 and chromosome 20, designated as t(6;20)(p22.3;p12.2) (black and green line), in G4. A translocation occurred between chromosome 4 and one black allele of chromosome 6, designated as t(4;6)(q32.1;q22.1) (blue and black line), in G3. C Copy number changes on chromosome 3 in different groups and inferred evolution. Yellow and black lines are two alleles of chromosome 3. G1, G2, G3, and G4 represent samples in each group. Each blue circle represents a cell population with certain chromosomal features inside
Fig. 3
Fig. 3
Short variants reveal high-resolution phylogenetic relationships among all tumor biopsies, and early subclonal expansion and migration events. A Reconstructed phylogenetic tree based on short variants confirms the grouping of the samples and reveals more detailed relationships among samples in groups as well as the placement of Ln7 and Ln9. BrP, BrM, and Ln1 shared variants with different samples, indicating that they are mixtures of cell populations. Three shades spanning multiple branches represent samples BrP, BrM, and Ln1. B Reconstructed subclone structures in BrP, BrM, and Ln1 show the heterogeneity of these three samples. The descendant relationship among the subclones suggests the earliest invasion was to the lung and reveal other subclone migrations and expansions from BrP. Each blue circle represents an inferred subclone. Each box represents a sample or a group of samples. C Overall migration patterns across all tumor sites, with arrow colors corresponding to metastatic waves. After the first invasion from primary breast tumor to lung (blue arrow), four metastatic waves spread the tumors to other organs
Fig. 4
Fig. 4
Subclone evolution and migration across all samples. Each blue circle represents an inferred subclone. Each box represents a sample or a group of samples. Samples in the same group are shown in a group box-labeled G1–G4. Blue arrows represent subclone evolution or monoclonal seeding. Green arrows represent polyclonal seeding (Sc1, Sc4, and Sc6 seeded Ln1; Sc26 and Sc24 seeded Lv4). Red arrow represents recolonization (Sc16 from Ln2 recolonized Ln1). Ln1 served as the “jumping board” where Sc7 and Sc8, descendants of Sc1 and Sc4 from BrP, and Sc9, descendant of Sc6 from BrM, were all attracted to stay, further evolved, and then colonized other samples. In G3, Ln10 served as an “incubator” where many subclones evolved and went on to seed other sites
Fig. 5
Fig. 5
Temporal and spatial distribution of mutational signatures, mutated metastasis-related genes, and clinically actionable genes. A Genome-wide mutational signatures exhibited at different stages of tumor evolution, annotated to the phylogenetic tree. The number of variants is labeled beside each pie chart. HRD homologous recombination deficiency. ROS reactive oxygen species. B Distribution of metastasis-related mutations across genes and samples. Genes that are involved in lung metastasis labeled L; genes that are involved in bone metastasis labeled B. C Distribution and type of potentially clinically informative mutations across genes and samples. Gene mutations are shown in yellow, deletions in blue, and amplifications in red
Fig. 6
Fig. 6
Summary of tumor evolution and metastasis progression in correlation with treatment history and clinical events

References

    1. Caswell-Jin JL, Plevritis SK, Tian L, Cadham CJ, Xu C, Stout NK, et al. Change in survival in metastatic breast cancer with treatment advances: meta-analysis and systematic review. JNCI Cancer Spectr. 2018;2(4):ky062. doi: 10.1093/jncics/pky062. - DOI - PMC - PubMed
    1. Mariotto AB, Etzioni R, Hurlbert M, Penberthy L, Mayer M. Estimation of the number of women living with metastatic breast cancer in the United States. Cancer Epidemiol Biomarkers Prev. 2017;26(6):809–815. doi: 10.1158/1055-9965.EPI-16-0889. - DOI - PMC - PubMed
    1. Network CGA. Comprehensive molecular portraits of human breast tumours. Nature. 2012;490(7418):61–70. doi: 10.1038/nature11412. - DOI - PMC - PubMed
    1. Banerji S, Cibulskis K, Rangel-Escareno C, Brown KK, Carter SL, Frederick AM, Lawrence MS, Sivachenko AY, Sougnez C, Zou L, Cortes ML, Fernandez-Lopez JC, Peng S, Ardlie KG, Auclair D, Bautista-Piña V, Duke F, Francis J, Jung J, Maffuz-Aziz A, Onofrio RC, Parkin M, Pho NH, Quintanar-Jurado V, Ramos AH, Rebollar-Vega R, Rodriguez-Cuevas S, Romero-Cordoba SL, Schumacher SE, Stransky N, Thompson KM, Uribe-Figueroa L, Baselga J, Beroukhim R, Polyak K, Sgroi DC, Richardson AL, Jimenez-Sanchez G, Lander ES, Gabriel SB, Garraway LA, Golub TR, Melendez-Zajgla J, Toker A, Getz G, Hidalgo-Miranda A, Meyerson M. Sequence analysis of mutations and translocations across breast cancer subtypes. Nature. 2012;486(7403):405–409. doi: 10.1038/nature11154. - DOI - PMC - PubMed
    1. Ciriello G, Gatza ML, Beck AH, Wilkerson MD, Rhie SK, Pastore A, Zhang H, McLellan M, Yau C, Kandoth C, Bowlby R, Shen H, Hayat S, Fieldhouse R, Lester SC, Tse GMK, Factor RE, Collins LC, Allison KH, Chen YY, Jensen K, Johnson NB, Oesterreich S, Mills GB, Cherniack AD, Robertson G, Benz C, Sander C, Laird PW, Hoadley KA, King TA, Perou CM, Akbani R, Auman JT, Balasundaram M, Balu S, Barr T, Beck A, Benz C, Benz S, Berrios M, Beroukhim R, Bodenheimer T, Boice L, Bootwalla MS, Bowen J, Bowlby R, Brooks D, Cherniack AD, Chin L, Cho J, Chudamani S, Ciriello G, Davidsen T, Demchok JA, Dennison JB, Ding L, Felau I, Ferguson ML, Frazer S, Gabriel SB, Gao JJ, Gastier-Foster JM, Gatza ML, Gehlenborg N, Gerken M, Getz G, Gibson WJ, Hayes DN, Heiman DI, Hoadley KA, Holbrook A, Holt RA, Hoyle AP, Hu H, Huang M, Hutter CM, Hwang ES, Jefferys SR, Jones SJM, Ju Z, Kim J, Lai PH, Laird PW, Lawrence MS, Leraas KM, Lichtenberg TM, Lin P, Ling S, Liu J, Liu W, Lolla L, Lu Y, Ma Y, Maglinte DT, Mardis E, Marks J, Marra MA, McAllister C, McLellan M, Meng S, Meyerson M, Mills GB, Moore RA, Mose LE, Mungall AJ, Murray BA, Naresh R, Noble MS, Oesterreich S, Olopade O, Parker JS, Perou CM, Pihl T, Saksena G, Schumacher SE, Shaw KRM, Ramirez NC, Rathmell WK, Rhie SK, Roach J, Robertson AG, Saksena G, Sander C, Schein JE, Schultz N, Shen H, Sheth M, Shi Y, Shih J, Shelley CS, Shriver C, Simons JV, Sofia HJ, Soloway MG, Sougnez C, Sun C, Tarnuzzer R, Tiezzi DG, van den Berg DJ, Voet D, Wan Y, Wang Z, Weinstein JN, Weisenberger DJ, Wilkerson MD, Wilson R, Wise L, Wiznerowicz M, Wu J, Wu Y, Yang L, Yau C, Zack TI, Zenklusen JC, Zhang H, Zhang J, Zmuda E. Comprehensive molecular portraits of invasive lobular breast cancer. Cell. 2015;163(2):506–519. doi: 10.1016/j.cell.2015.09.033. - DOI - PMC - PubMed

Publication types