. 2022 May;32(2):199-208.
doi: 10.1016/j.zemedi.2021.09.001. Epub 2021 Oct 26.

Volumetric 23Na Single and Triple-Quantum Imaging at 7T: 3D-CRISTINA

Affiliations

Volumetric 23Na Single and Triple-Quantum Imaging at 7T: 3D-CRISTINA

Michaela A U Hoesl et al. Z Med Phys. 2022 May.

Erratum in

Abstract

Purpose: To measure multi-quantum coherence (MQC) 23Na signals for noninvasive cell physiological information in the whole-brain, the 2D-CRISTINA method was extended to 3D. This experimental study investigated the use and results of a new sequence, 3D-CRISTINA, on a phantom and healthy volunteers.

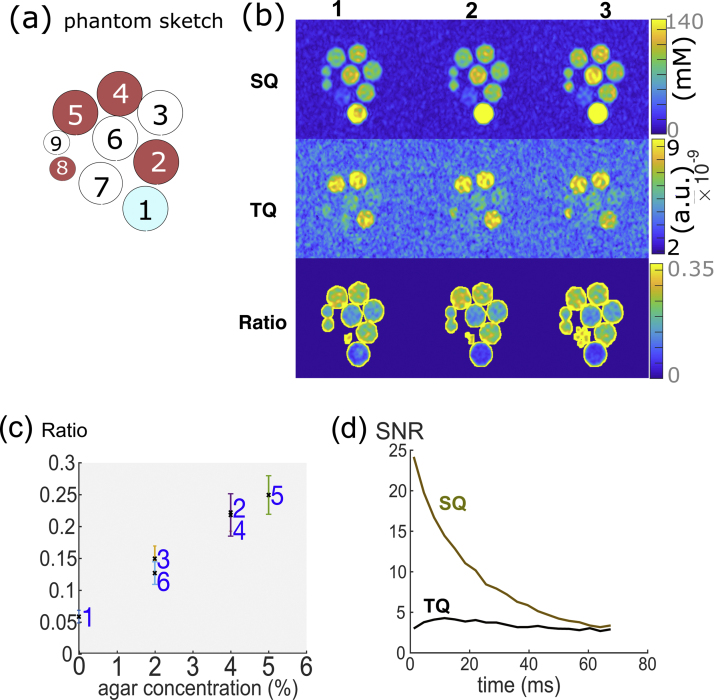
Methods: The 3D Cartesian single and triple-quantum imaging of 23Na (3D-CRISTINA) was developed and implemented at 7T, favoring a non-selective volume excitation for increased signal-to-noise ratio (SNR) and lower energy deployment than its 2D counterpart. Two independent phase cycles were used in analogy to the 2D method. A comparison of 6-steps cycles and 12-steps cycles was performed. We used a phantom composed of different sodium and agarose concentrations, 50mM to 150mM Na+, and 0-5% agarose for sequence validation. Four healthy volunteers were scanned at 7T for whole brain MQC imaging. The sequence 3D-CRISTINA was developed and tested at 7T.

Results: At 7T, the 3D-CRISTINA acquisition allowed to reduce the TR to 230ms from the previous 390ms for 2D, resulting in a total acquisition time of 53min for a 3D volume of 4×4×8mm resolution. The phase cycle evaluation showed that the 7T acquisition time could be reduced by 4-fold with moderate single and triple-quantum signals SNR loss. The healthy volunteers demonstrated clinical feasibility at 7T and showed a difference in the MQC signals ratio of White Matter (WM) and Grey Matter (GM).

Conclusion: Volumetric CRISTINA multi-quantum imaging allowed whole-brain coverage. The non-selective excitation enabled a faster scan due to a decrease in energy deposition which enabled a lower repetition time. Thus, it should be the preferred choice for future in vivo multi-quantum applications compared to the 2D method. A more extensive study is warranted to explore WM and GM MQC differences.

Keywords: Sodium MRI; Sodium triple-quantum imaging; Whole-brain imaging.


Figures

Figure 1
Figure 1
The previous 2D-CRISTINA sequence (a) featuring three pulses for multi-quantum excitation, was extended to 3D-CRISTINA (b) by adding an additional phase encoding direction and substituting the slice selection by a non-selective excitation.
Figure 2
Figure 2
(a) Phantom design for subsequent sequence evaluation composed of nine tubes with different agar (in %) and sodium concentration (in mM): 1) 0%, 154 mM, 2) 4%, 100 mM, 3) 2% agar, 100 mM, 4) 4%, 154 mM, 5) 5%, 154 mM, 6) 2% 130 mM, 7) 4%, 50 mM, 8) 4%, 100 mM, 9) 2%, 100 mM. Phantom vial 8 and 9 have a much smaller volume with 14 mL compared to the 2–5 with 40 mL. The phantom vials indicated in red correspond to the high agar vials containing >4% agar. (b) Phantom result of 3D-CRISTINA, SQ and TQ signal and their ratio for 3 central slices each. (c) For the ratio versus agar concentration evaluation without phantom 7–9 the result was: R2 = 0.987, p = 6e−5. (d) The SNR of TQ and SQ over echo time shows the characteristic signal evolution respectively.
Figure 3
Figure 3
Fit result for the phantom dataset for a single slice at the center of the dataset. (a) results with the measurement and fit data side by side. The fit was performed only within the body mask therefore the Fit results and Ratios are zero in the background. (b) Resulting fit parameter maps corresponding to Eq. (1), (2), (3). The liquid vial follows a mono-exponential decay by comparing the signal amplitudes ASQslow and ASQfast maps. In the T2* maps it can be appreciated that the higher agarose phantoms show shorter relaxation times.
Figure 4
Figure 4
(a) Phantom measurement comparison of TQ and SQ signal when doubling the phase cycle increment. (A) 64 min was acquired with a phase cycle increment of Δϕ=30° and two cycles of each 6 steps. For (B) 16 min, the increment was doubled to Δϕ=60°, without averaging, acquiring only a fourth of the data. The SQ and TQ SNR for the whole image was evaluated in (b). Due to cutting the amount of data the SNR is higher for A than for B, however visibly the image quality is not compromised, confirming the possibility of a shorter measurement time. (c) The SNR in vial 4 shows the signal comparison for A versus B measurement time in the 4% 154 mM vial.
Figure 5
Figure 5
Visual comparison of TQ and SQ signal when doubling the phase cycle increment, without averaging, in vivo for the 4 different healthy volunteers in analogy to the phantom measurement shown in Figure 4.
Figure 6
Figure 6
7T in vivo results, different slices of volunteer 1. (A) T2w transversal 1H image showing the corresponding slices. (B,C) 1H-T2w overlay with SQ and TQ signal to relate the high intensity regions to the morphology better described by 1H images. (D) B0 maps reconstructed from the multi-echo CRISTINA data, (E) SQ images quantified to Tissue Sodium Concentration, (F) TQ images as well as the ratio of SQ and TQ signal in (G).
Figure 7
Figure 7
7T in vivo results of the four volunteers demonstrated homogeneous TQ signal within the brain, with occasional darker regions in the periphery. These signal losses might be associated with the extra B1 sensitivity of TQ signal (to the power of 5). Interestingly, the TQ/SQ ratio highlighted regions of white matter in all volunteers, and low ratio values in cerebro-spinal fluid area.

References

    1. Hoesl M.A.U., Schad L.R., Rapacchi S. Efficient 23Na triple-quantum signal imaging on clinical scanners: Cartesian imaging of single and triple-quantum 23Na (CRISTINA) Magn Reson Med. 2020;(September):1–17. doi: 10.1002/mrm.28284. - DOI - PMC - PubMed
    1. Romanzetti S., Mirkes C.C., Fiege D.P., Celik A., Felder J., Shah N.J. Mapping tissue sodium concentration in the human brain: a comparison of MR sequences at 9.4 Tesla. Neuroimage. 2014;96(August):44–53. doi: 10.1016/j.neuroimage.2014.03.079. - DOI - PubMed
    1. Thulborn K.R. Quantitative sodium MR imaging: a review of its evolving role in medicine. Neuroimage. 2018 doi: 10.1016/j.neuroimage.2016.11.056. - DOI - PMC - PubMed
    1. Wagner D., Anton M., Vorwerk H. Dose uncertainty in radiotherapy of patients with head and neck cancer measured by in vivo ESR/alanine dosimetry using a mouthpiece’. Phys Med Biol. 2011;56(5):1373–1383. doi: 10.1088/0031-9155/56/5/010. - DOI - PubMed
    1. Hu R., Kleimaier D., Malzacher M., Hoesl M.A.U., Paschke N.K., Schad L.R. X-nuclei imaging: current state, technical challenges, and future directions. J Magn Reson Imaging. 2019;(May) doi: 10.1002/jmri.26780. - DOI - PubMed