. 2021 Dec 15;81(24):6196-6206.
doi: 10.1158/0008-5472.CAN-21-1079. Epub 2021 Oct 28.

Heterogeneity of Circulating Tumor Cell-Associated Genomic Gains in Breast Cancer and Its Association with the Host Immune Response

Affiliations

Heterogeneity of Circulating Tumor Cell-Associated Genomic Gains in Breast Cancer and Its Association with the Host Immune Response

Nisha Kanwar et al. Cancer Res. .

Abstract

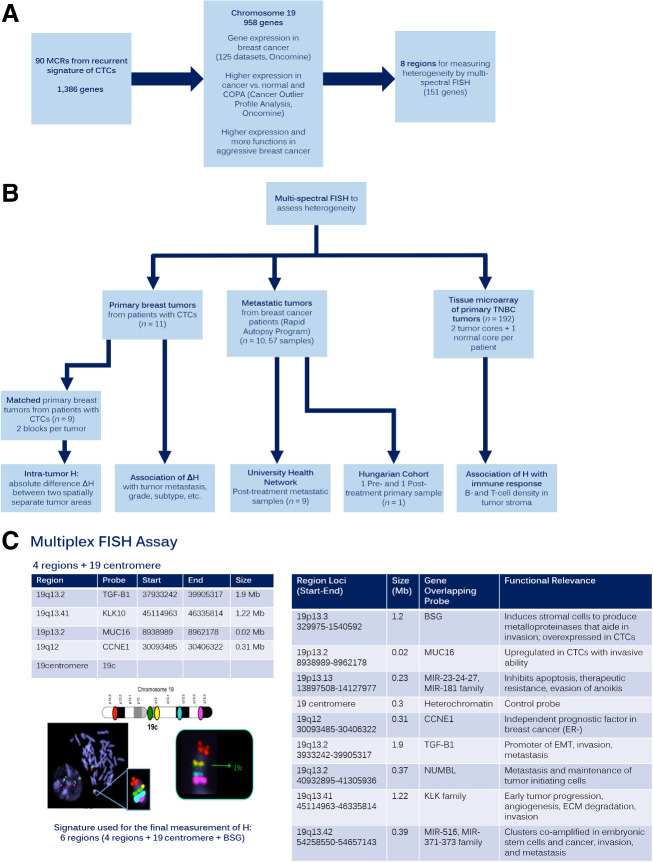
Tumor cells that preferentially enter circulation include the precursors of metastatic cancer. Previously, we characterized circulating tumor cells (CTC) from patients with breast cancer and identified a signature of genomic regions with recurrent copy-number gains. Through FISH, we now show that these CTC-associated regions are detected within the matched untreated primary tumors of these patients (21% to 69%, median 55.5%, n = 19). Furthermore, they are more prevalent in the metastases of patients who died from breast cancer after multiple rounds of treatment (70% to 100%, median 93%, samples n = 41). Diversity indices revealed that higher spatial heterogeneity for these regions within primary tumors is associated with increased dissemination and metastasis. An identified subclone with multiple regions gained (MRG clone) was enriched in a posttreatment primary breast carcinoma as well as multiple metastatic tumors and local breast recurrences obtained at autopsy, indicative of a distinct early subclone with the capability to resist multiple lines of treatment and eventually cause death. In addition, multiplex immunofluorescence revealed that tumor heterogeneity is significantly associated with the degree of infiltration of B lymphocytes in triple-negative breast cancer, a subtype with a large immune component. Collectively, these data reveal the functional potential of genetic subclones that comprise heterogeneous primary breast carcinomas and are selected for in CTCs and posttreatment breast cancer metastases. In addition, they uncover a relationship between tumor heterogeneity and host immune response in the tumor microenvironment. SIGNIFICANCE: As breast cancers progress, they become more heterogeneous for multiple regions amplified in circulating tumor cells, and intratumoral spatial heterogeneity is associated with the immune landscape.


Figures

Figure 1. Study design and objectives. A, Selection of regions/genes from CTC signatures. Using three filtering approaches to select from 90 recurrently gained minimum common regions in CTCs (1,386 genes), we compiled a list of eight regions (151 genes) that may be involved in dissemination of breast cancer cells. The eight regions were assessed using multispectral FISH for intratumoral heterogeneity. B, Study objectives. Our goal was to examine the heterogeneity of the eight regions in pretreated matched primary breast tumor samples of 11 patients with CTCs (including 9 patients with two spatially separate tumor samples, which allowed assessment of intratumoral heterogeneity). We also examined 57 posttreated metastatic tumor samples from 9 patients who had died of breast cancer (UHN samples) and one patient with pre- and posttreatment primary samples (Hungarian samples). Furthermore, a TMA consisting of 192 sets of tumors from patients with TNBC was investigated to assess the association of heterogeneity with immune response in this cohort. C, Validation of multispectral FISH to measure intratumor heterogeneity. Probes labeled with five nonoverlapping fluorescent spectra were designed to bind across several loci on the p and q arms of chromosome 19. Normal metaphase chromosomes show unique hybridization sites of each probe. Single interphase nuclei may be scored for FISH signals from all five probes simultaneously to measure intratumor heterogeneity of copy-number gains within five chromosomal regions. Using this approach, the eight regions listed were examined for H within primary and metastatic tumors (4 regions + chromosome 19 centromere control per each of two tumor sections). Results used for final analysis included six regions (TGFB1, KLK10, MUC16, CCNE1, BSG, and chromosome 19 centromere).
Figure 1.
Study design and objectives. A, Selection of regions/genes from CTC signatures. Using three filtering approaches to select from 90 recurrently gained minimum common regions in CTCs (1,386 genes), we compiled a list of eight regions (151 genes) that may be involved in dissemination of breast cancer cells. The eight regions were assessed using multispectral FISH for intratumoral heterogeneity. B, Study objectives. Our goal was to examine the heterogeneity of the eight regions in pretreated matched primary breast tumor samples of 11 patients with CTCs (including 9 patients with two spatially separate tumor samples, which allowed assessment of intratumoral heterogeneity). We also examined 57 posttreated metastatic tumor samples from 9 patients who had died of breast cancer (UHN samples) and one patient with pre- and posttreatment primary samples (Hungarian samples). Furthermore, a TMA consisting of 192 sets of tumors from patients with TNBC was investigated to assess the association of heterogeneity with immune response in this cohort. C, Validation of multispectral FISH to measure intratumor heterogeneity. Probes labeled with five nonoverlapping fluorescent spectra were designed to bind across several loci on the p and q arms of chromosome 19. Normal metaphase chromosomes show unique hybridization sites of each probe. Single interphase nuclei may be scored for FISH signals from all five probes simultaneously to measure intratumor heterogeneity of copy-number gains within five chromosomal regions. Using this approach, the eight regions listed were examined for H within primary and metastatic tumors (4 regions + chromosome 19 centromere control per each of two tumor sections). Results used for final analysis included six regions (TGFB1, KLK10, MUC16, CCNE1, BSG, and chromosome 19 centromere).
Figure 2. Increased heterogeneity is associated with metastasis. A, Heterogeneity in primary breast tumors. Tumors with low H have the same regions gained in most tumor cells as shown by homogeneity of FISH signals observed in individual tumor cells; tumors with high H have high heterogeneity of the combinations of regions gained for each tumor cell; some tumor cells show single/few FISH signals while other show multiple FISH signals. B and C, Intratumor or spatial heterogeneity in primary breast tumors. Two spatially separate areas of a tumor were assessed for H in 9 patients. Overall, the correlation coefficient for spatial heterogeneity was found to be moderate (r = 0.57, P = 0.048); however, it was quite striking in some patients. As an example, Patient 8 exhibits high intratumor or spatial heterogeneity between the two geographically separated tumor blocks, Block 1, H1 = 1.52 and Block 2, H2 = 2.53 (ΔH = 1.01). C, Association of ΔH and metastasis of primary breast tumors. Higher intratumor or spatial heterogeneity is associated with distant metastasis regardless of high average H (Havg) of the tumor.
Figure 2.
Increased heterogeneity is associated with metastasis. A, Heterogeneity in primary breast tumors. Tumors with low H have the same regions gained in most tumor cells as shown by homogeneity of FISH signals observed in individual tumor cells; tumors with high H have high heterogeneity of the combinations of regions gained for each tumor cell; some tumor cells show single/few FISH signals while other show multiple FISH signals. B and C, Intratumor or spatial heterogeneity in primary breast tumors. Two spatially separate areas of a tumor were assessed for H in 9 patients. Overall, the correlation coefficient for spatial heterogeneity was found to be moderate (r = 0.57, P = 0.048); however, it was quite striking in some patients. As an example, Patient 8 exhibits high intratumor or spatial heterogeneity between the two geographically separated tumor blocks, Block 1, H1 = 1.52 and Block 2, H2 = 2.53 (ΔH = 1.01). C, Association of ΔH and metastasis of primary breast tumors. Higher intratumor or spatial heterogeneity is associated with distant metastasis regardless of high average H (Havg) of the tumor.
Figure 3. CTC gains are more frequent in metastatic tumors versus primary tumors. A, There was no significant difference in heterogeneity between tumors from primary (n = 19) or metastatic breast cancer (n = 41). B, Comparison of clonal composition of primary (n = 19) and metastatic breast tumors (n = 41, UHN cohort). There were significantly higher proportions of cells with CTC gains present in metastatic tumors (mean 83% vs. 57%). Clones with ≥ 4 regions gained (or MRG clones) were observed at higher frequencies in metastatic tumors compared with the primary tumors. Primary tumors were more likely to be comprised of clones with no regions gained or a single region gained. C, P1, P2 refer to two primary tumors from two different patients, each with two spatially separate areas. M1, M2 refer to multiple different metastases from the organs of two different patients. There were differences in clonal compositions; primary tumors had larger proportions of clones with single regions gained versus metastatic tumors that had larger proportions of clones with multiple regions gained (“MRG” clones). MRG clones were also present in larger proportions in a posttreatment primary tumor compared with pretreatment, the former showed larger proportions of the MRG clones.
Figure 3.
CTC gains are more frequent in metastatic tumors versus primary tumors. A, There was no significant difference in heterogeneity between tumors from primary (n = 19) or metastatic breast cancer (n = 41). B, Comparison of clonal composition of primary (n = 19) and metastatic breast tumors (n = 41, UHN cohort). There were significantly higher proportions of cells with CTC gains present in metastatic tumors (mean 83% vs. 57%). Clones with ≥ 4 regions gained (or MRG clones) were observed at higher frequencies in metastatic tumors compared with the primary tumors. Primary tumors were more likely to be comprised of clones with no regions gained or a single region gained. C, P1, P2 refer to two primary tumors from two different patients, each with two spatially separate areas. M1, M2 refer to multiple different metastases from the organs of two different patients. There were differences in clonal compositions; primary tumors had larger proportions of clones with single regions gained versus metastatic tumors that had larger proportions of clones with multiple regions gained (“MRG” clones). MRG clones were also present in larger proportions in a posttreatment primary tumor compared with pretreatment, the former showed larger proportions of the MRG clones.
Figure 4. MRG clones are more frequent in metastatic tumors and increase aggressive tumor behavior. A, Significantly smaller proportions of cells with "MRG" clones were detected in primary tumors compared with local breast recurrences and metastatic tumors, suggesting selection of these cells after dissemination and posttreatment. Proportions are presented as averages. B, MRG clones were detected in different proportions in distant metastatic sites posttreatment. Primary tumors had smaller proportions of cells with MRG clones compared with local breast recurrences and metastatic tumors in other organs posttreatment. Proportions are presented as averages. C, In vitro migration, anchorage-independent growth and colony-forming assay validation in stable MCF7 cell lines showed that tumor cells with MRG overexpression profiles increased anchorage independent growth and colony-forming ability than tumor cells with only single genes overexpressed. In contrast, most tumor cell lines showed increased migration ability regardless of their overexpression profile.
Figure 4.
MRG clones are more frequent in metastatic tumors and increase aggressive tumor behavior. A, Significantly smaller proportions of cells with "MRG" clones were detected in primary tumors compared with local breast recurrences and metastatic tumors, suggesting selection of these cells after dissemination and posttreatment. Proportions are presented as averages. B, MRG clones were detected in different proportions in distant metastatic sites posttreatment. Primary tumors had smaller proportions of cells with MRG clones compared with local breast recurrences and metastatic tumors in other organs posttreatment. Proportions are presented as averages. C,In vitro migration, anchorage-independent growth and colony-forming assay validation in stable MCF7 cell lines showed that tumor cells with MRG overexpression profiles increased anchorage independent growth and colony-forming ability than tumor cells with only single genes overexpressed. In contrast, most tumor cell lines showed increased migration ability regardless of their overexpression profile.
Figure 5. High intratumor heterogeneity is a relatively rare event in TNBC. Distribution of heterogeneity scores (H-Score) of 105 primary TNBCs using the 8-gene CTC signature. H-scores were calculated using the Shannon diversity index, which uses a logarithmic scale. The majority of patients had a low H-score between 0 and 0.50, with very few over 1.00, resulting in a positive-skew distribution.
Figure 5.
High intratumor heterogeneity is a relatively rare event in TNBC. Distribution of heterogeneity scores (H-Score) of 105 primary TNBCs using the 8-gene CTC signature. H-scores were calculated using the Shannon diversity index, which uses a logarithmic scale. The majority of patients had a low H-score between 0 and 0.50, with very few over 1.00, resulting in a positive-skew distribution.
Figure 6. High intratumor heterogeneity is associated with increased TIL density and improved survival in TNBC patients. A, MxIF of primary TNBC tissue cores stained with a panel of antibody markers for each TIL subtype and the tumor epithelium. B, Correlation matrix between specific TIL subsets assessed in primary TNBC tumors. Boxes show the degree of correlation between immune markers. B, B-cell density; Tc, cytotoxic T-cell density; Th, helper T-cell density; Tr, regulatory T-cell density; PD-L1+, programmed death ligand 1 positive cell density. The degree of correlation is represented by the color's intensity. The Pearson correlation coefficient (R) is indicated in each square, with P values below each coefficient. Colocalization was determined through counts of each immune cell across all tumors examined. C, Correlation between the H-score and all B lymphocytes or the general TIL population in primary TNBC with R and P values. Regression line with 95% confidence interval is included. D, Kaplan–Meier survival curve of 105 patients with primary TNBCs assessed on the basis of degree of B lymphocyte density and intratumor heterogeneity. Medians for both the B-cell density and the H-score were used to evenly distribute patients into four cohorts of high and low intratumor heterogeneity or B-cell density.
Figure 6.
High intratumor heterogeneity is associated with increased TIL density and improved survival in TNBC patients. A, MxIF of primary TNBC tissue cores stained with a panel of antibody markers for each TIL subtype and the tumor epithelium. B, Correlation matrix between specific TIL subsets assessed in primary TNBC tumors. Boxes show the degree of correlation between immune markers. B, B-cell density; Tc, cytotoxic T-cell density; Th, helper T-cell density; Tr, regulatory T-cell density; PD-L1+, programmed death ligand 1 positive cell density. The degree of correlation is represented by the color's intensity. The Pearson correlation coefficient (R) is indicated in each square, with P values below each coefficient. Colocalization was determined through counts of each immune cell across all tumors examined. C, Correlation between the H-score and all B lymphocytes or the general TIL population in primary TNBC with R and P values. Regression line with 95% confidence interval is included. D, Kaplan–Meier survival curve of 105 patients with primary TNBCs assessed on the basis of degree of B lymphocyte density and intratumor heterogeneity. Medians for both the B-cell density and the H-score were used to evenly distribute patients into four cohorts of high and low intratumor heterogeneity or B-cell density.

References

    1. Curtis C, Shah SP, Chin S-F, Turashvili G, Rueda OM, Dunning MJ, et al. . The genomic and transcriptomic architecture of 2,000 breast tumors reveals novel subgroups. Nature 2012;486:346–52. - PMC - PubMed
    1. Waclaw B, Bozic I, Pittman ME, Hruban RH, Vogelstein B, Nowak MA. A spatial model predicts that dispersal and cell turnover limit intratumor heterogeneity. Nature 2015;25:261–4. - PMC - PubMed
    1. Zardavas D, Irrthum A, Swanton C, Piccart M. Clinical management of breast cancer heterogeneity. Nat Rev Clin Oncol 2015;12:381–94. - PubMed
    1. Rashid-Kolvear F, Pintilie M, Done SJ. Telomere length on chromosome 17q shortens more than global telomere length in the development of breast cancer. Neoplasia 2007;9:265–70. - PMC - PubMed
    1. O'Connell P, Pekkel V, Allred DC, Fuqua SAW, Osborne CK, Clark GM. Analysis of loss of heterozygosity in 399 premalignant breast lesions at 15 genetic loci. J Natl Cancer Inst 1998;90:697–703. - PubMed

Publication types

MeSH terms

Substances

Grants and funding