. 2022 Mar 1;12(3):856-871.
doi: 10.1158/2159-8290.CD-21-0551.

Intracellular Cholesterol Pools Regulate Oncogenic Signaling and Epigenetic Circuitries in Early T-cell Precursor Acute Lymphoblastic Leukemia

Affiliations

Intracellular Cholesterol Pools Regulate Oncogenic Signaling and Epigenetic Circuitries in Early T-cell Precursor Acute Lymphoblastic Leukemia

Marissa Rashkovan et al. Cancer Discov. .

Abstract

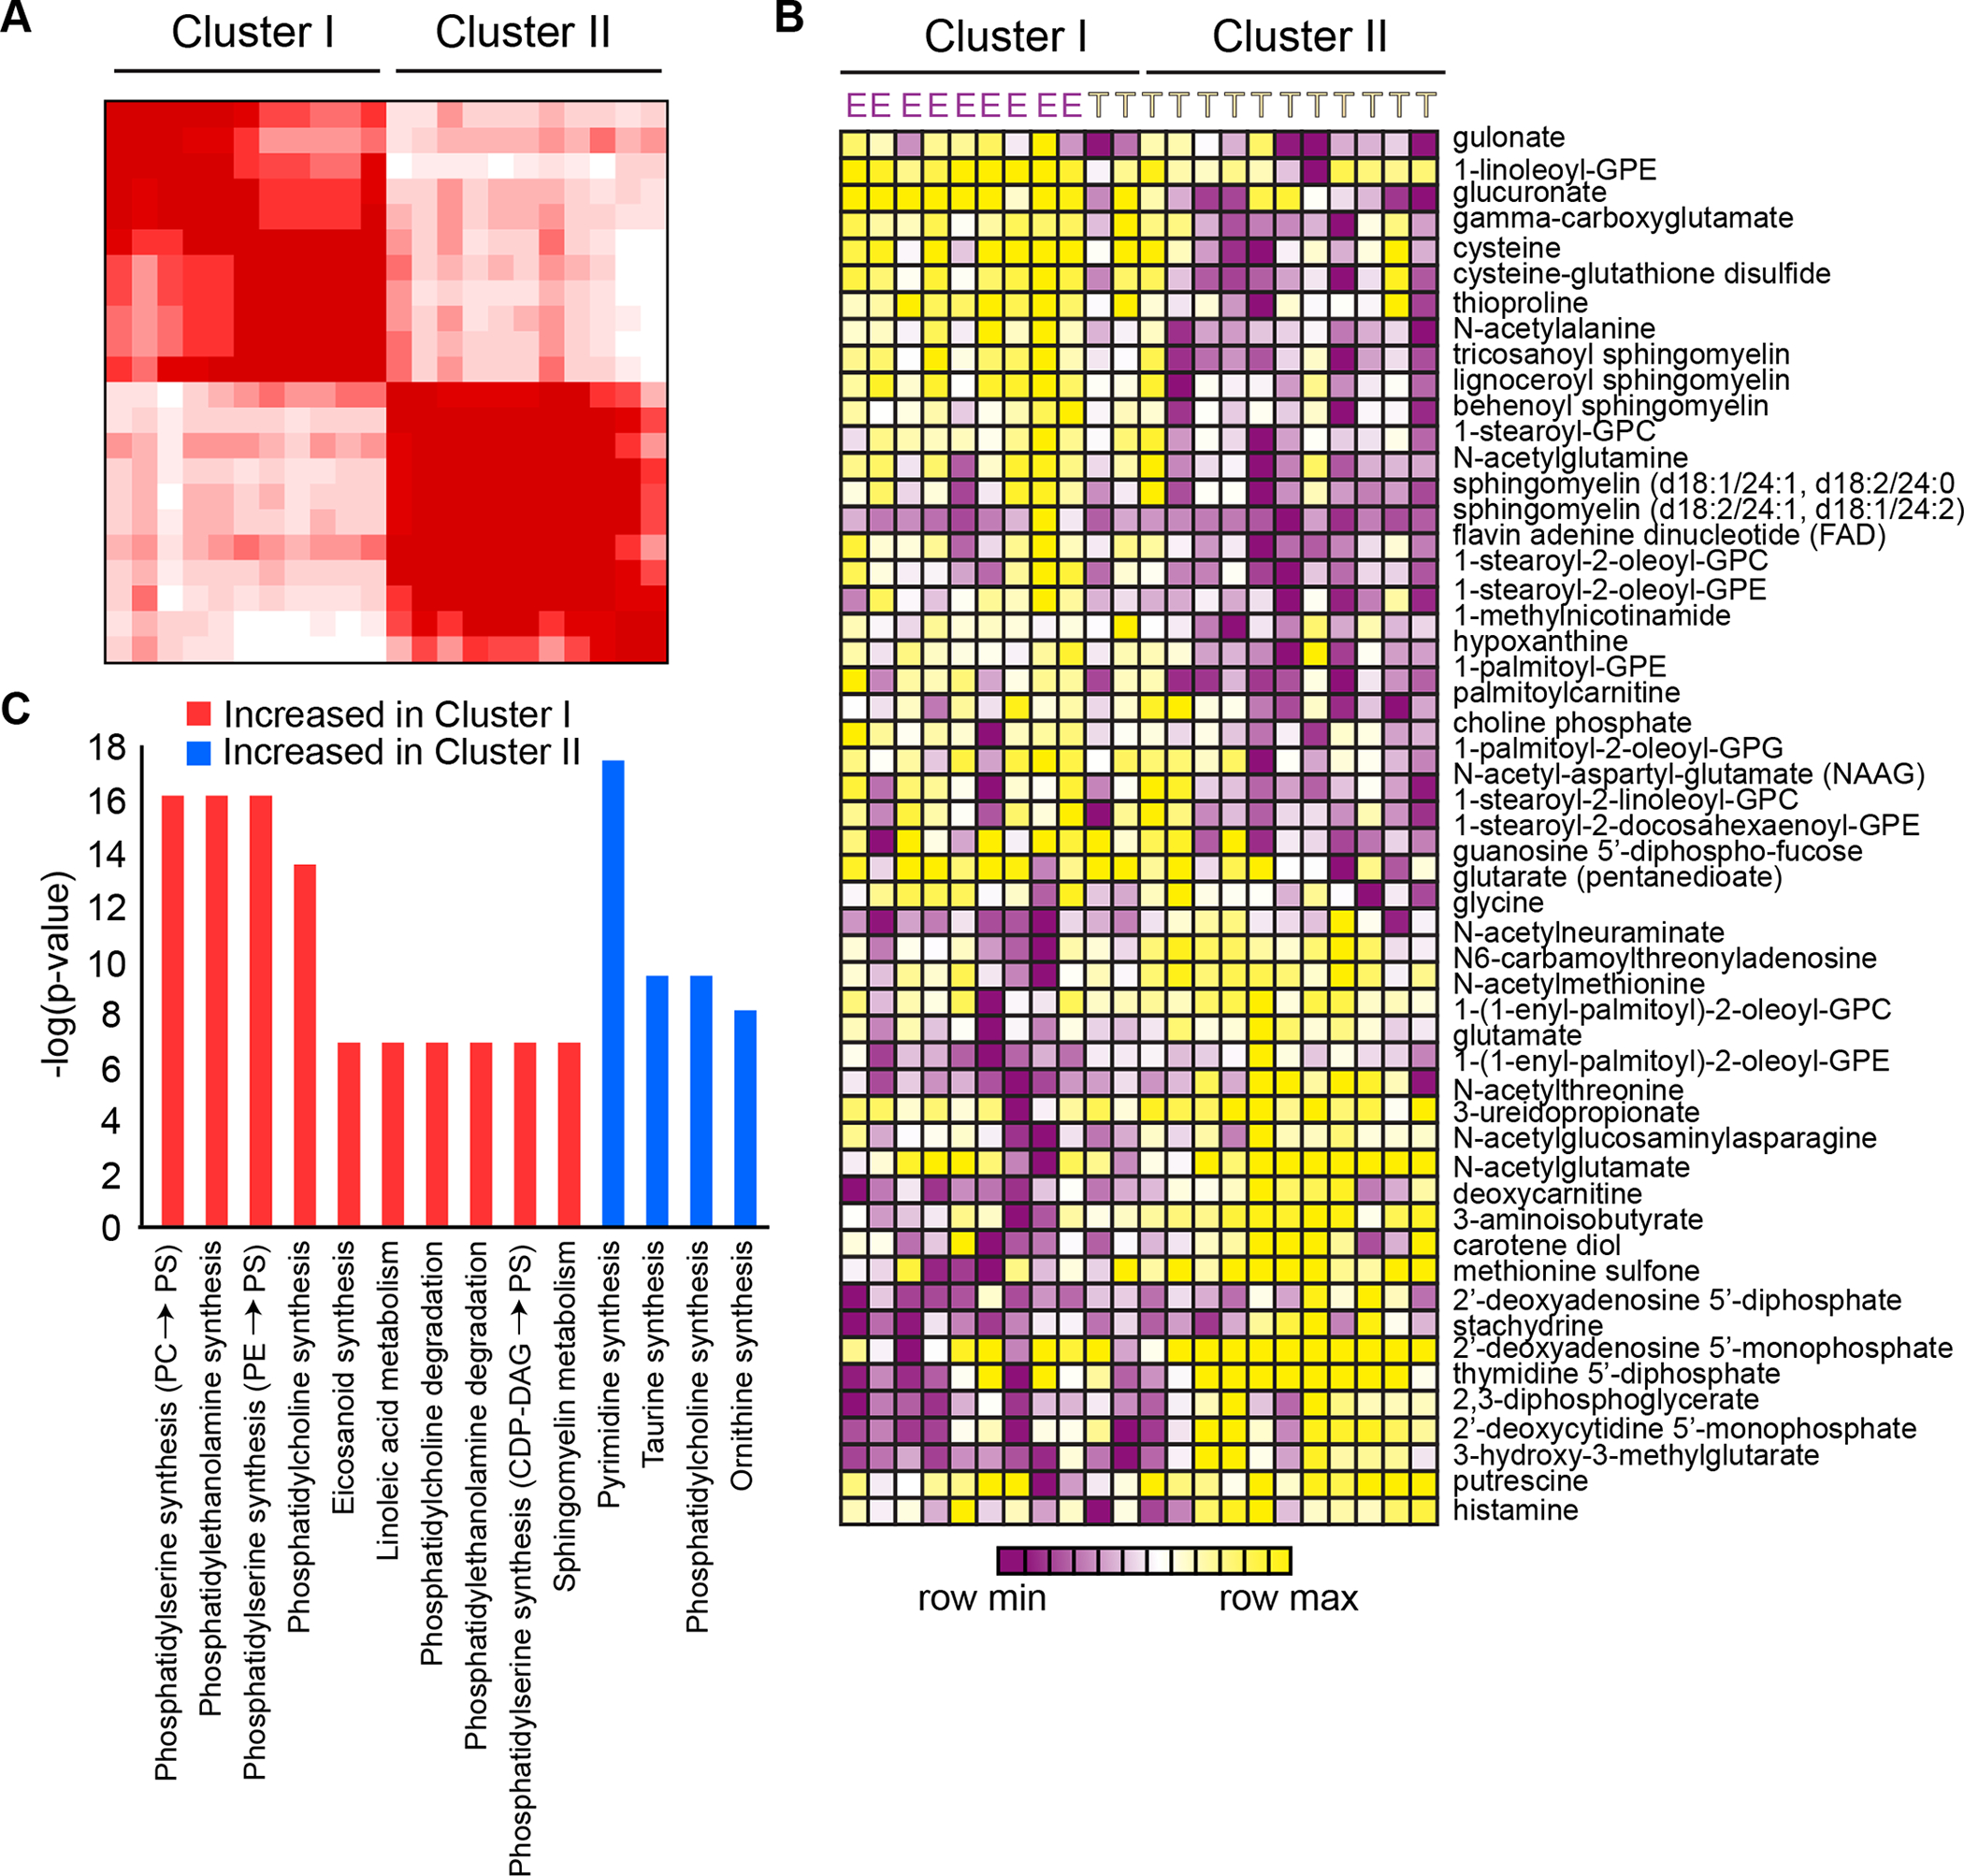
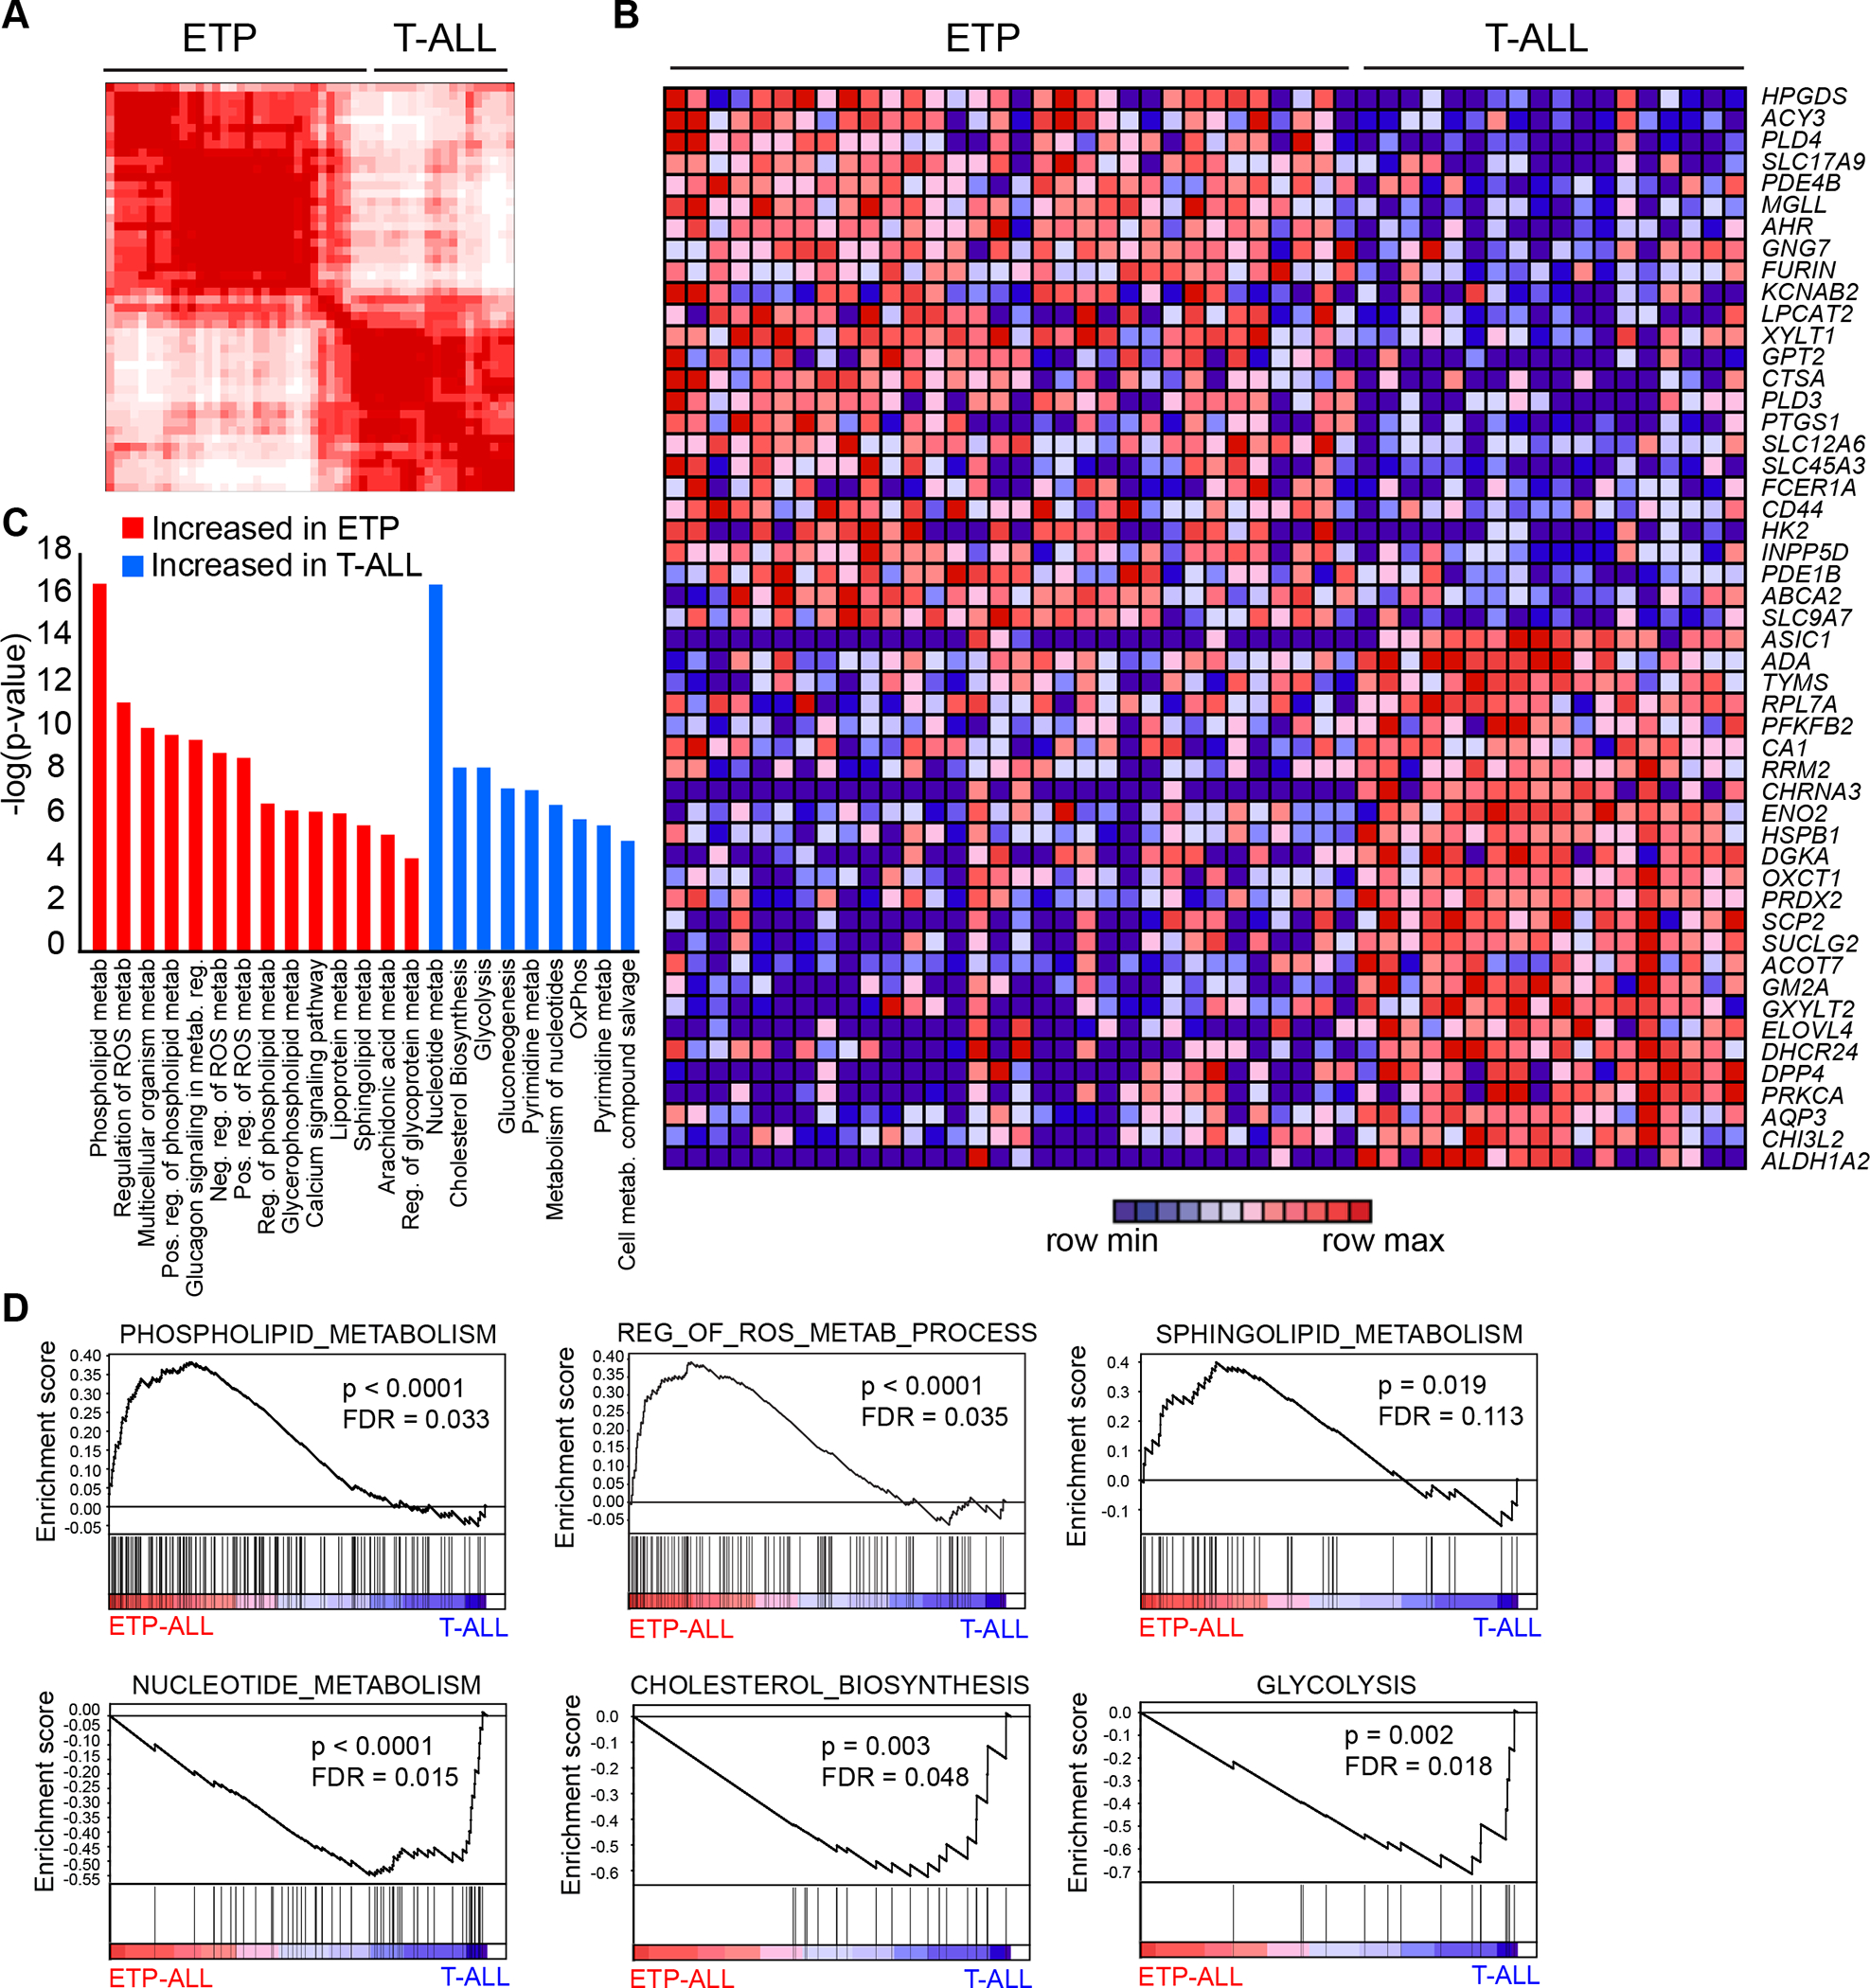
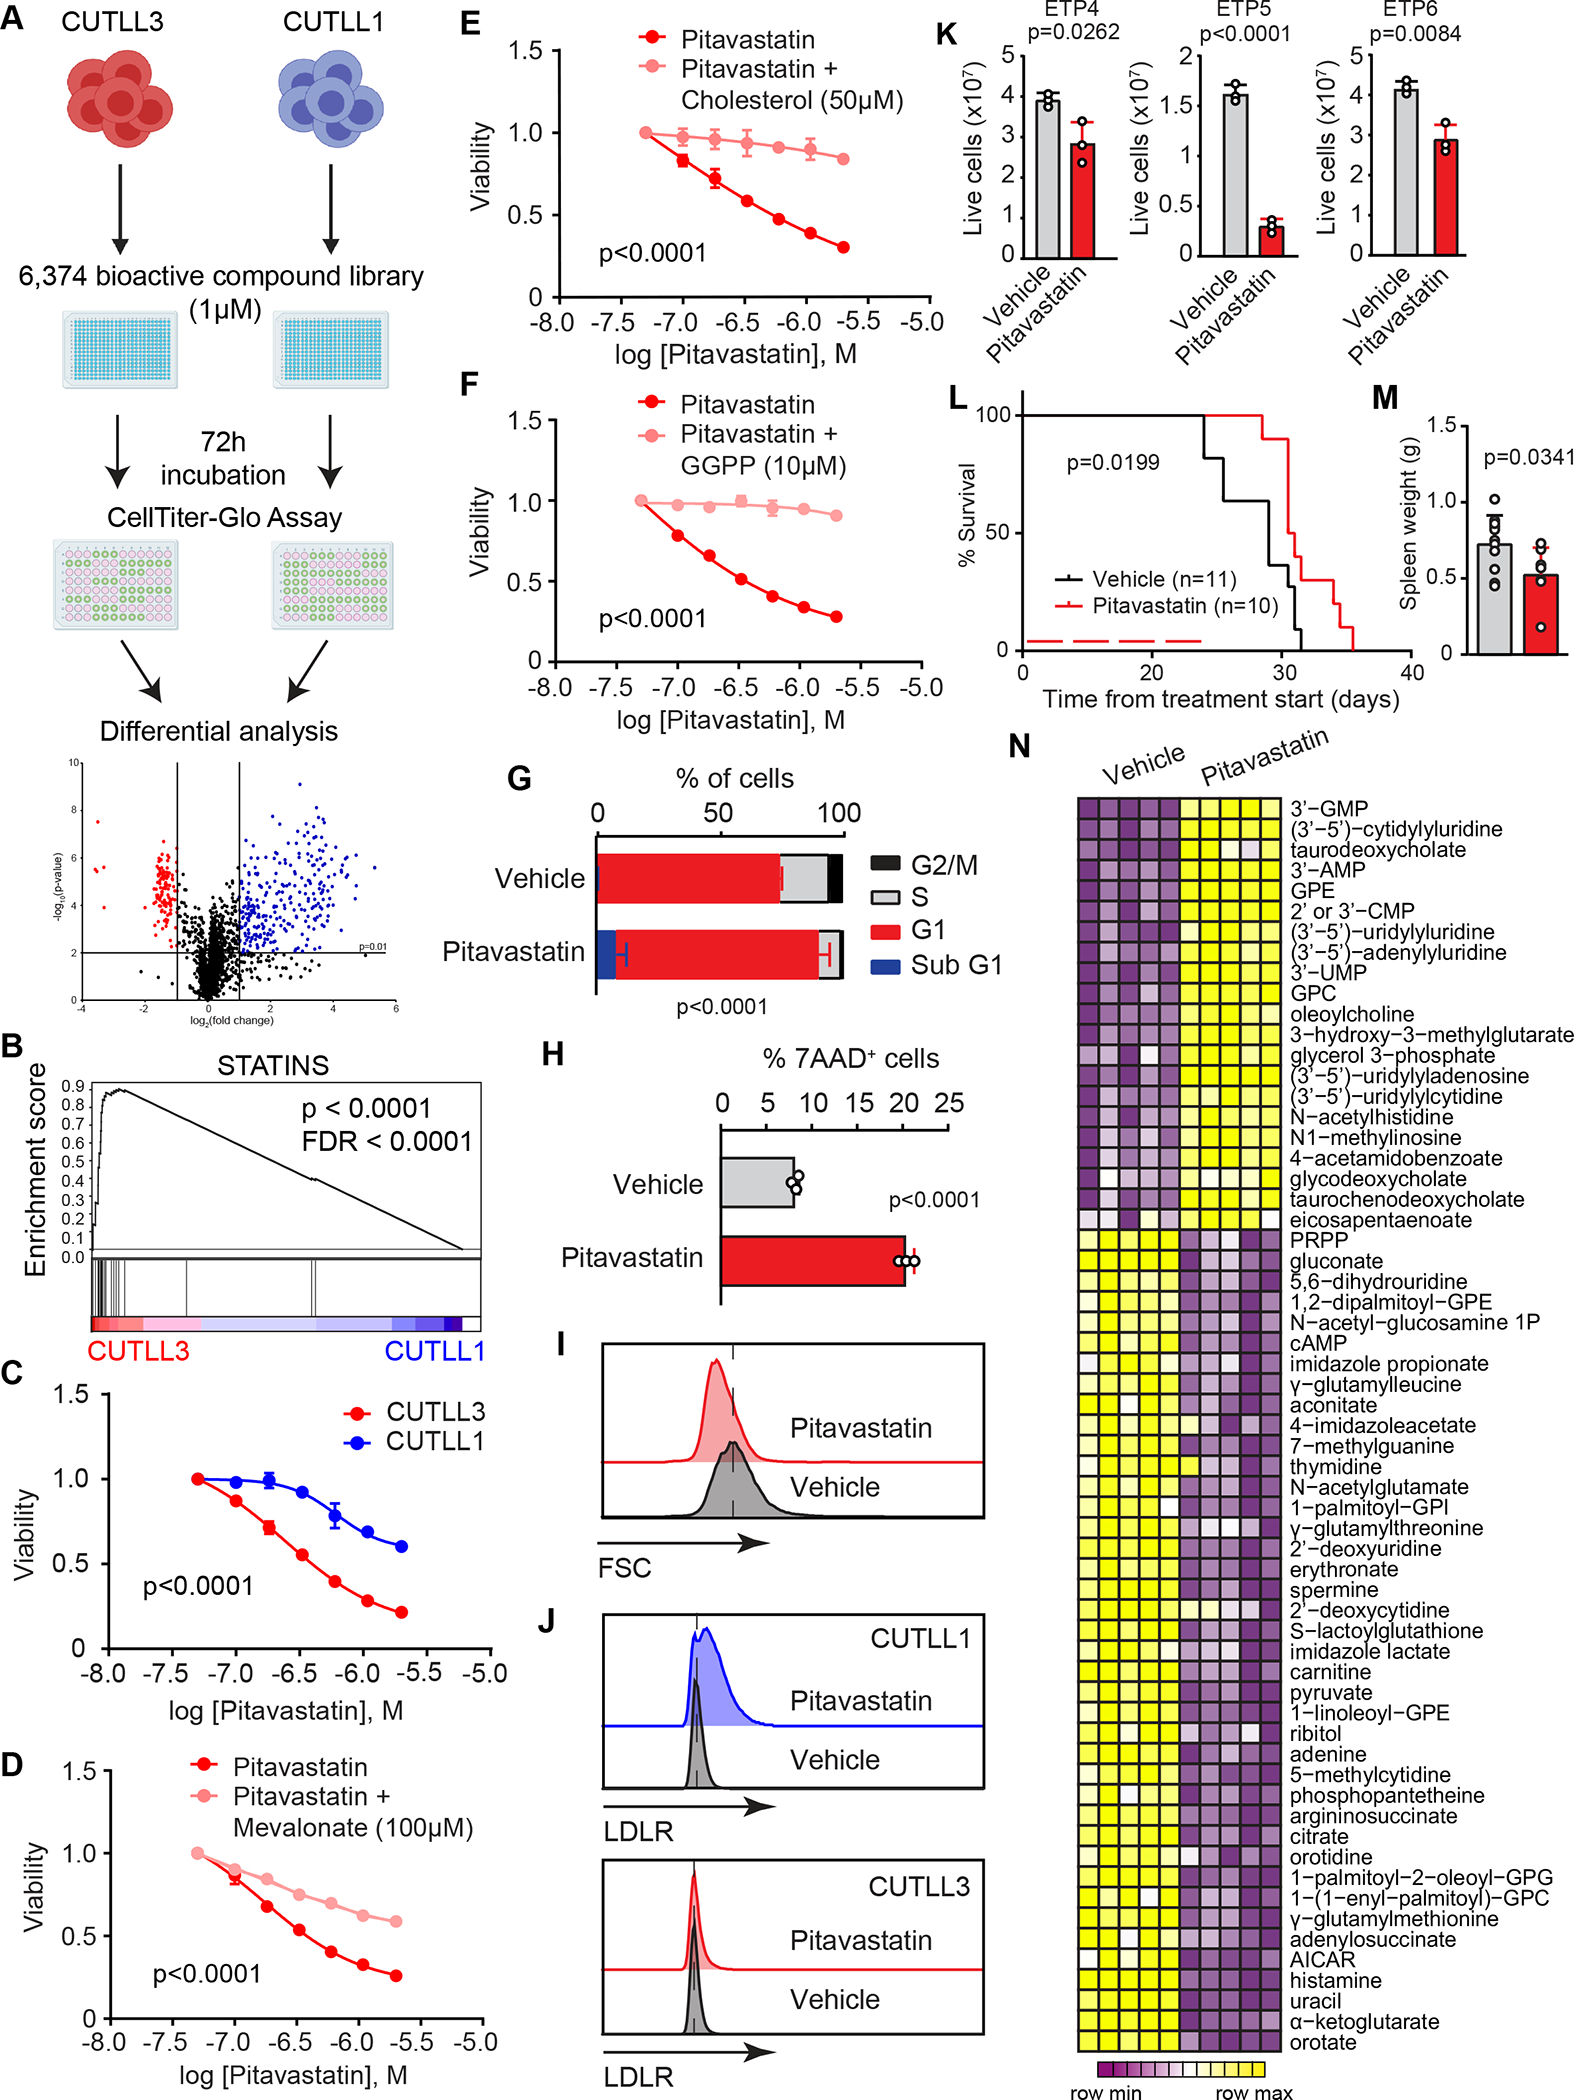
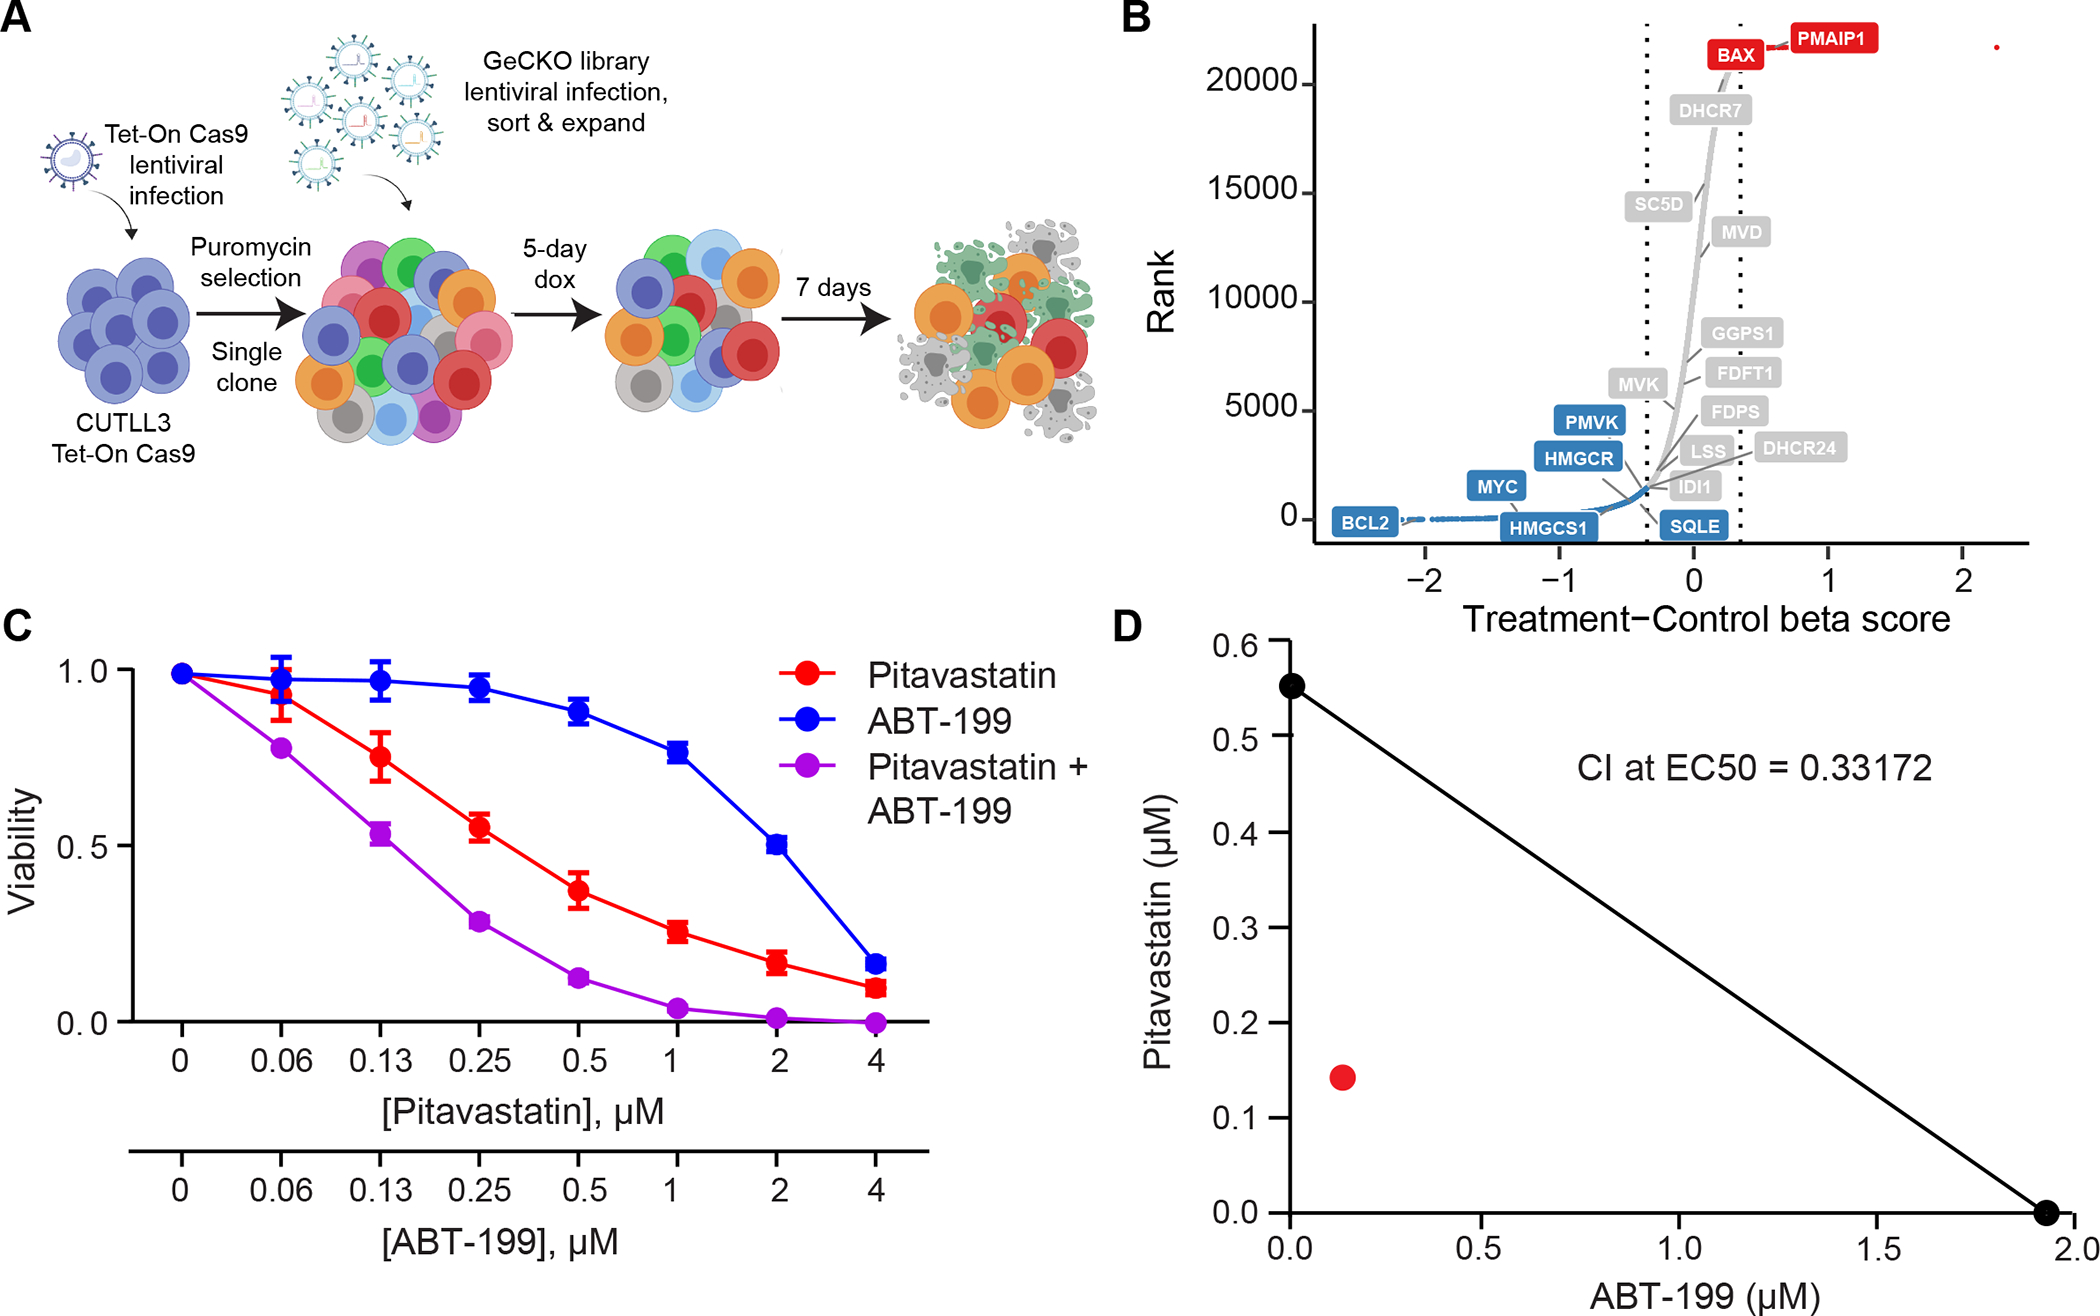
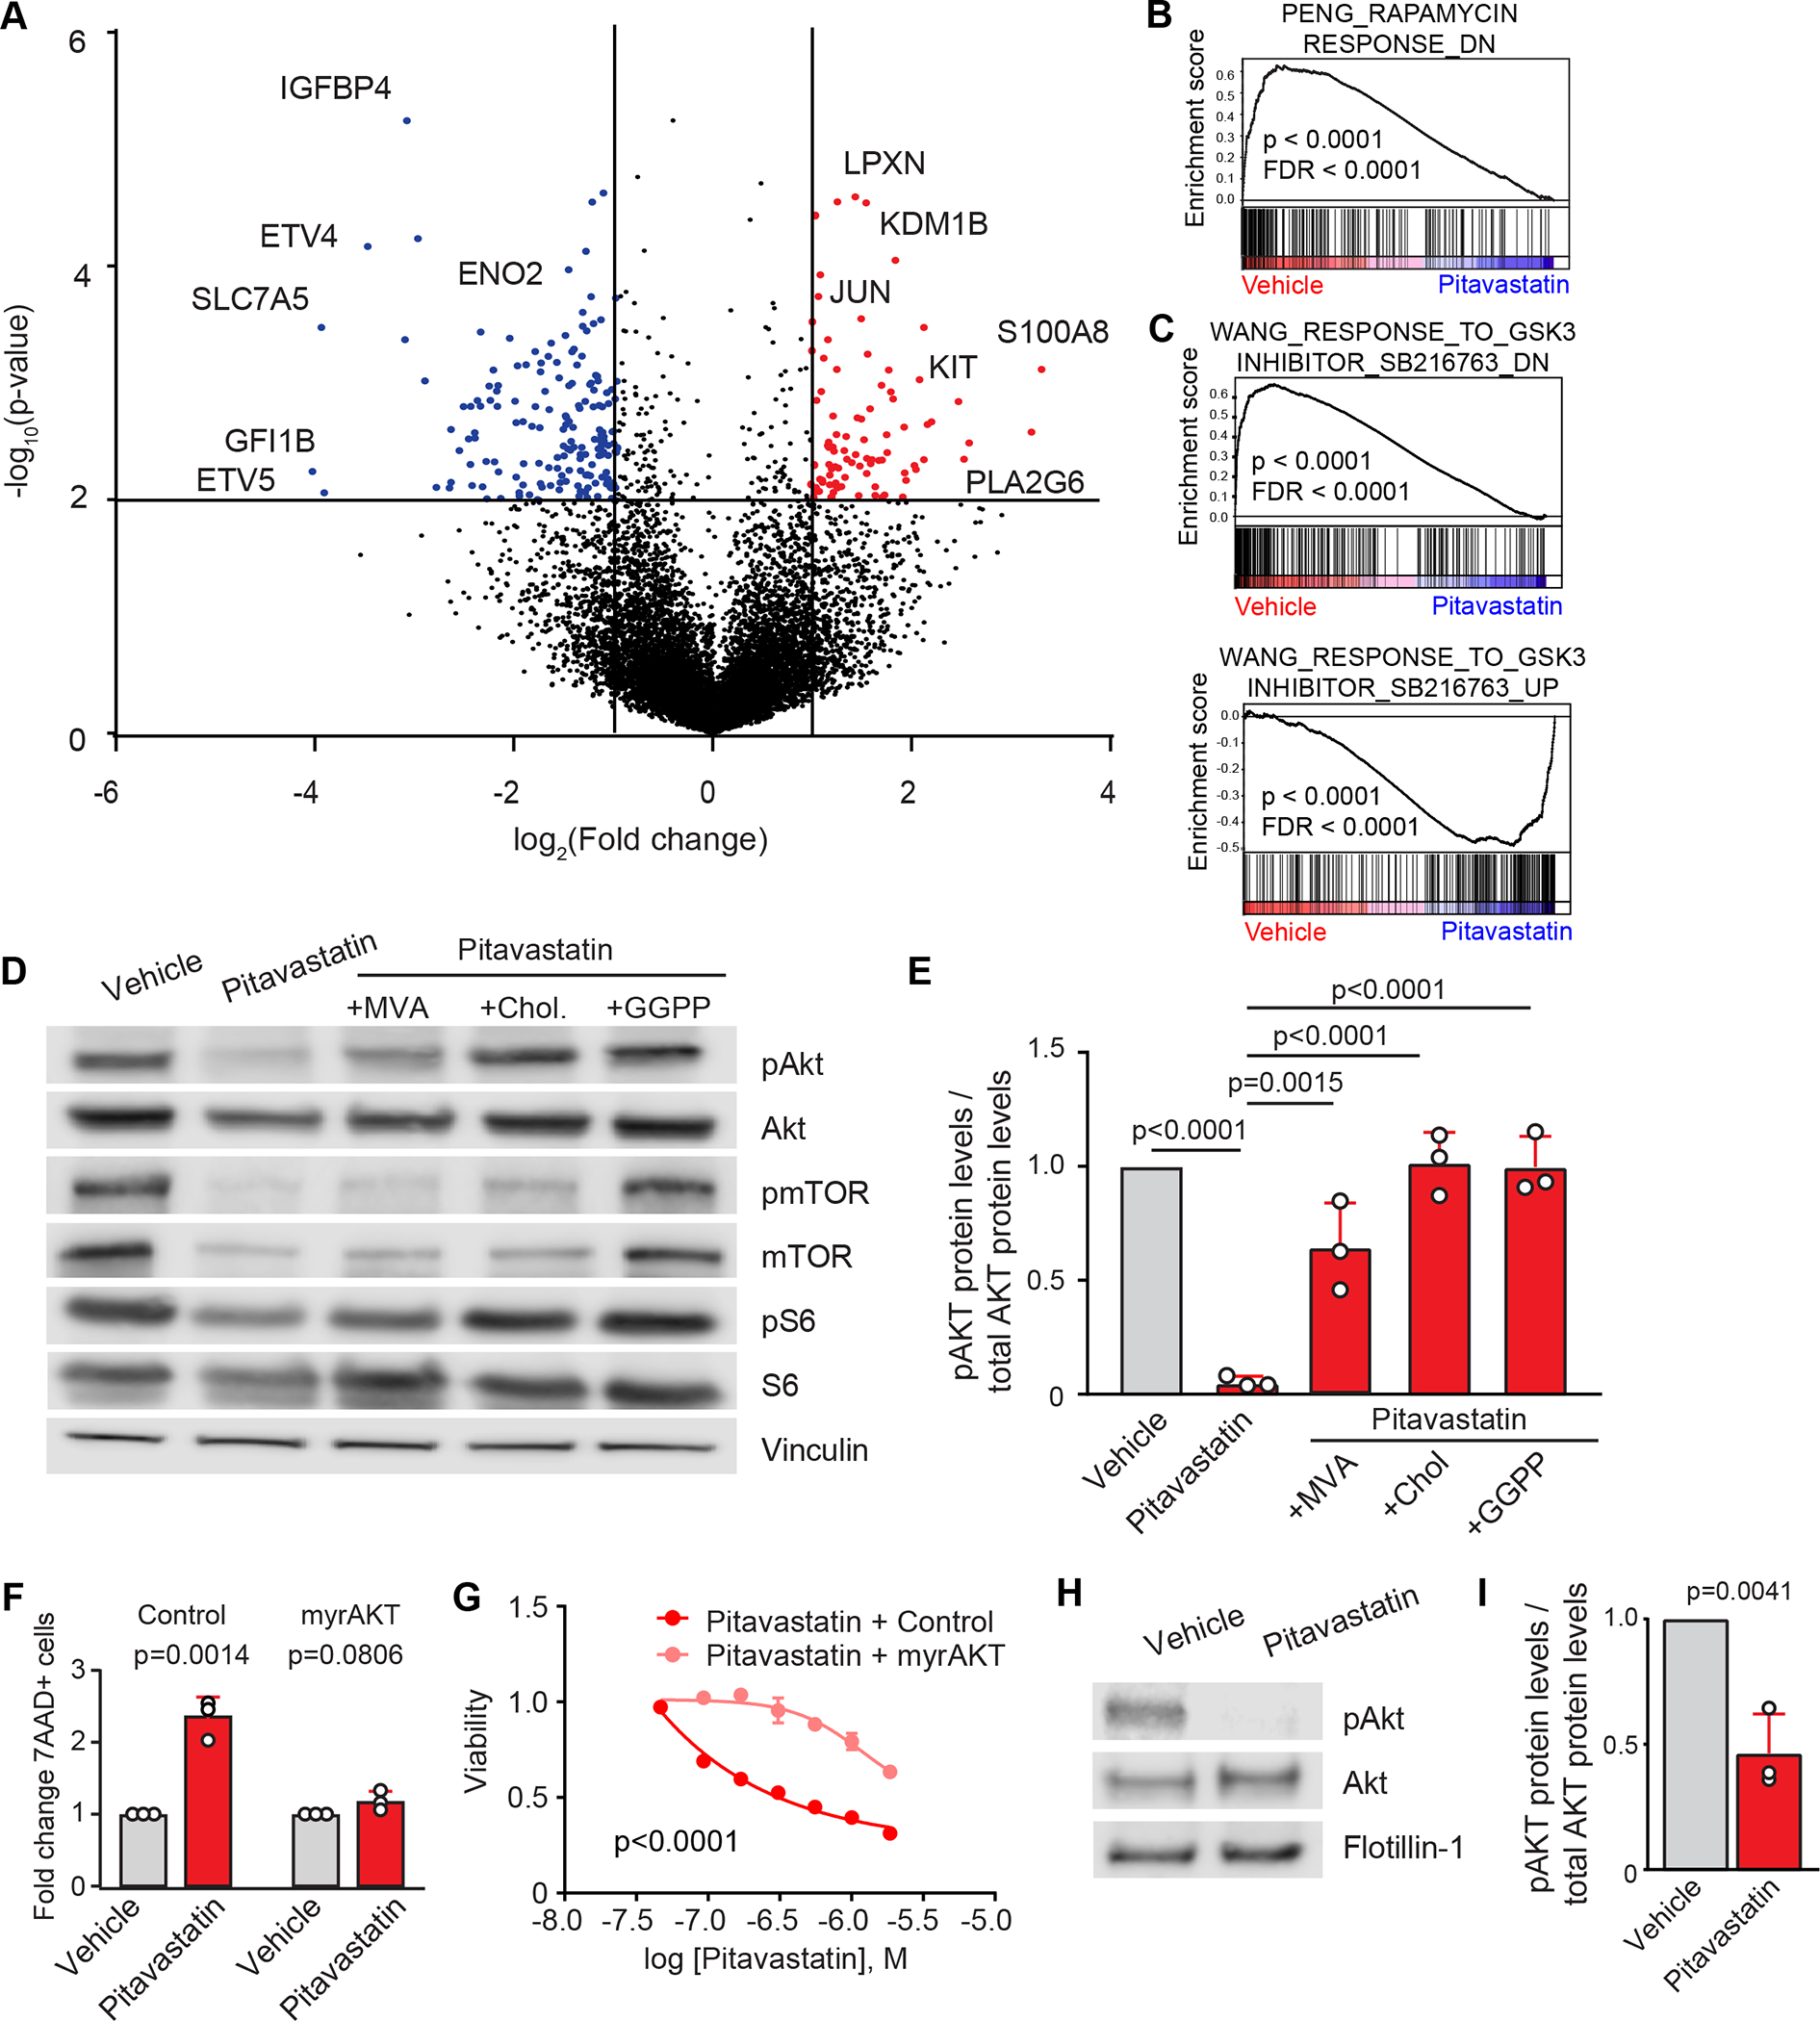
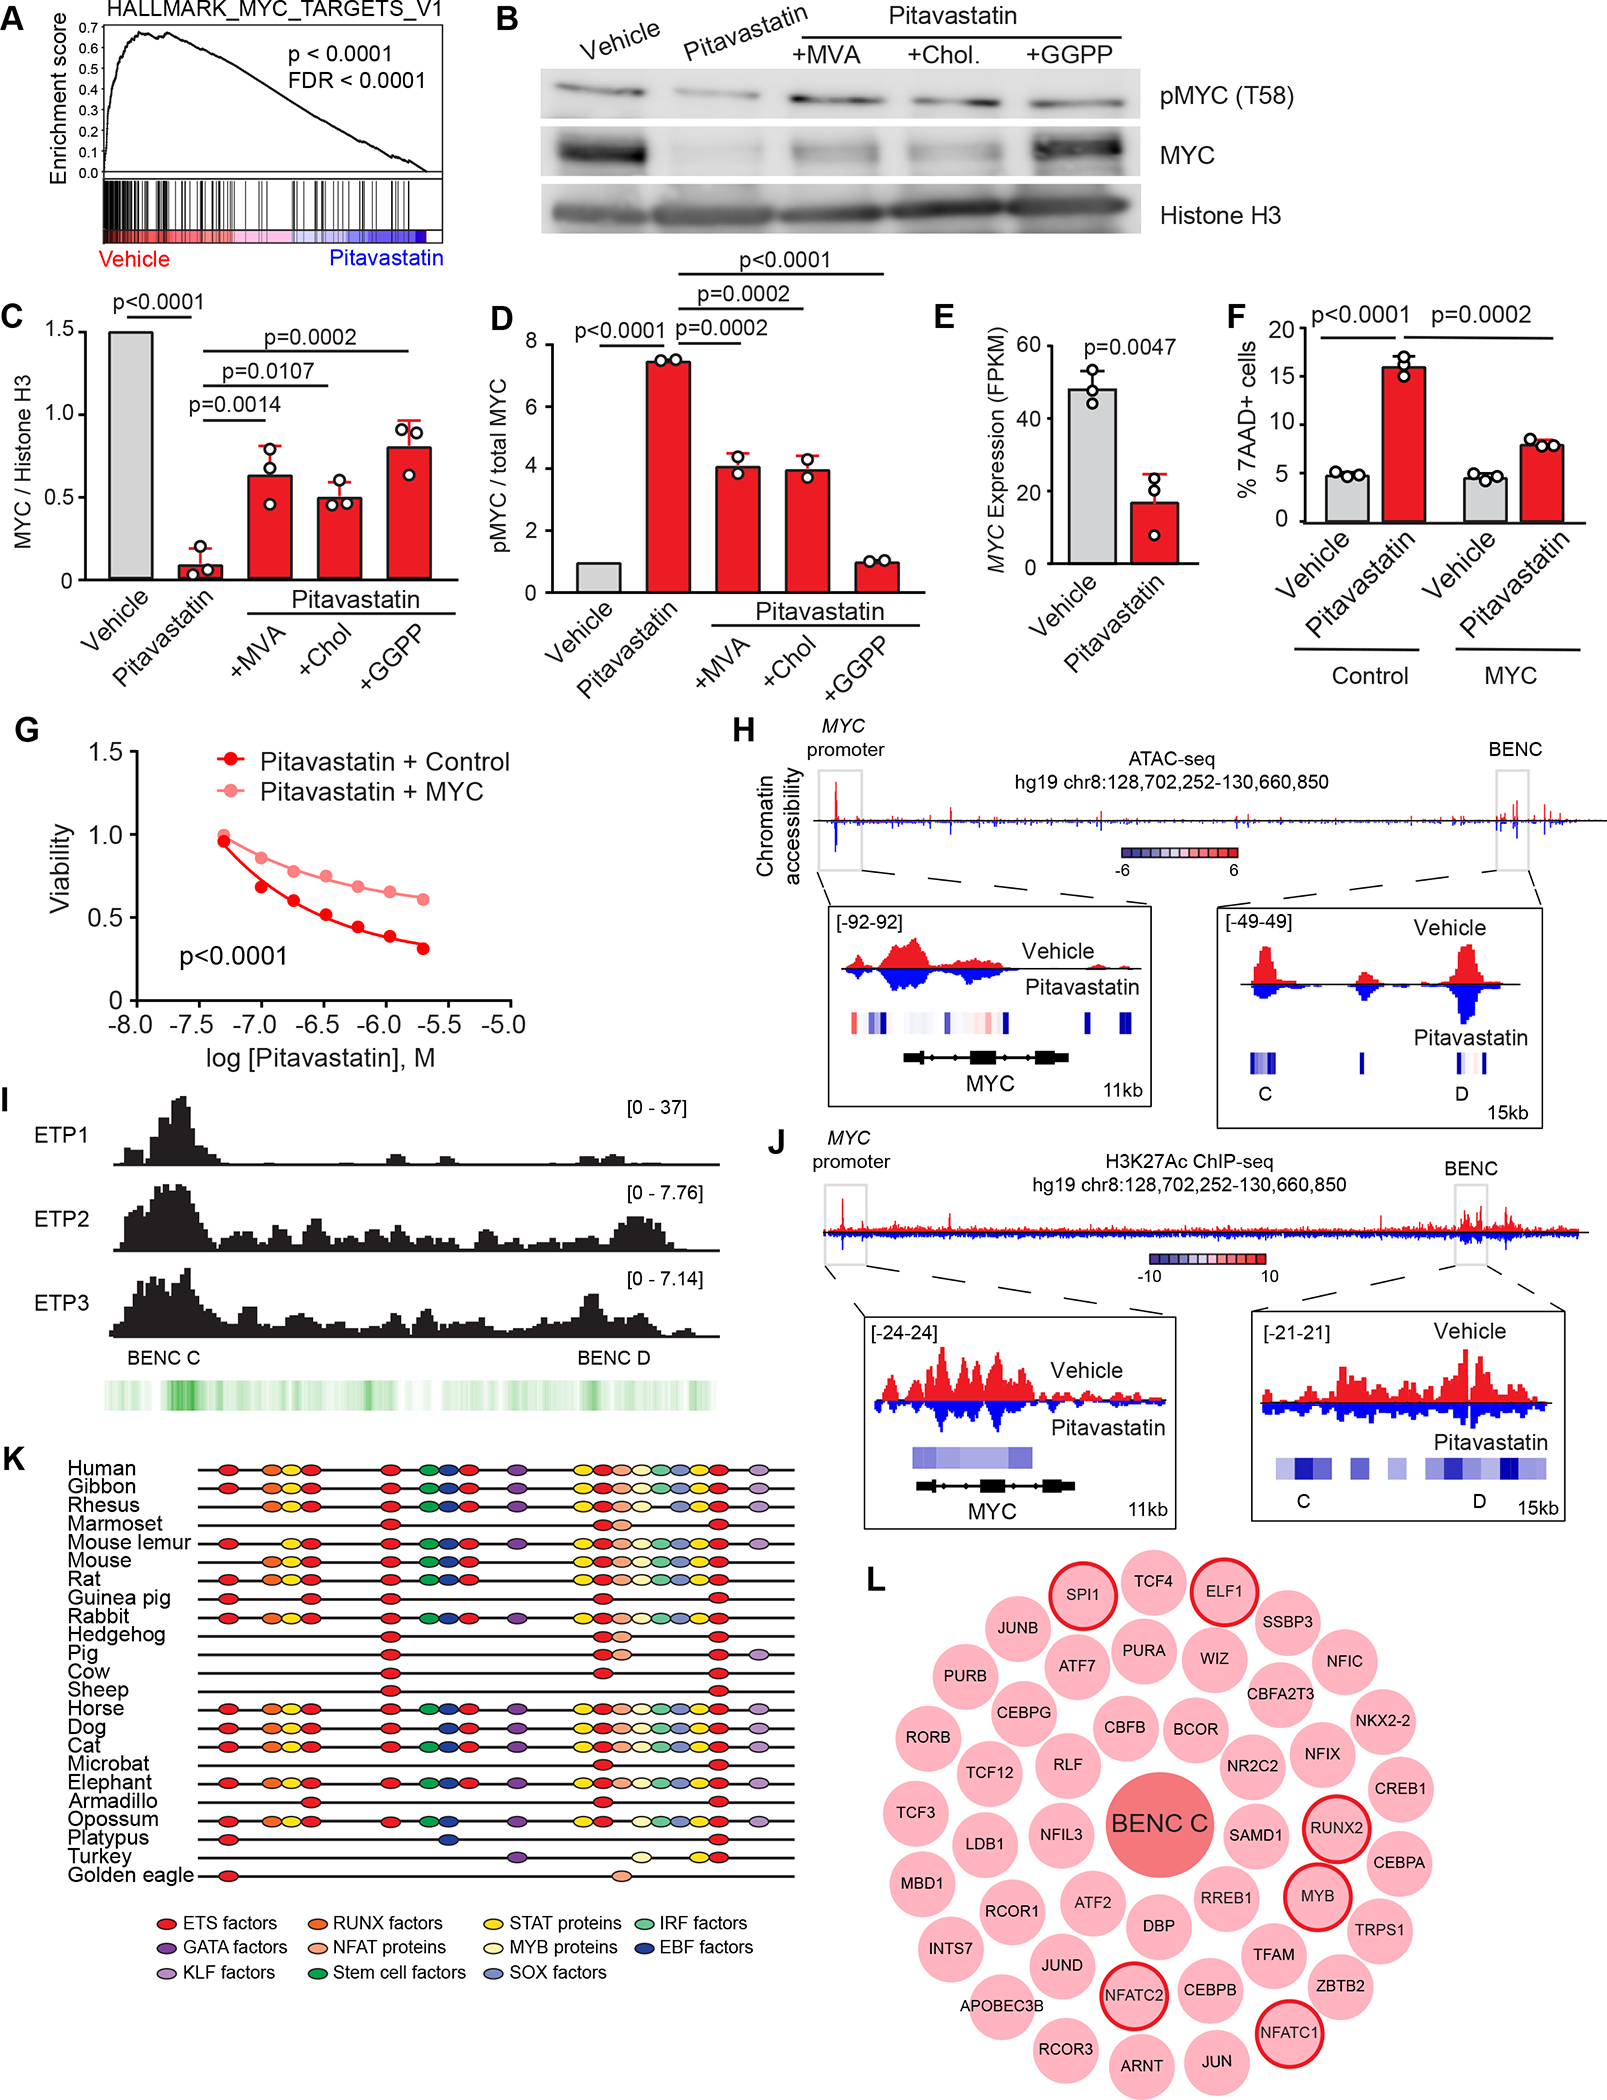
Early T-cell acute lymphoblastic leukemia (ETP-ALL) is an aggressive hematologic malignancy associated with early relapse and poor prognosis that is genetically, immunophenotypically, and transcriptionally distinct from more mature T-cell acute lymphoblastic leukemia (T-ALL) tumors. Here, we leveraged global metabolomic and transcriptomic profiling of primary ETP- and T-ALL leukemia samples to identify specific metabolic circuitries differentially active in this high-risk leukemia group. ETP-ALLs showed increased biosynthesis of phospholipids and sphingolipids and were specifically sensitive to inhibition of 3-hydroxy-3-methylglutaryl-CoA reductase, the rate-limiting enzyme in the mevalonate pathway. Mechanistically, inhibition of cholesterol synthesis inhibited oncogenic AKT1 signaling and suppressed MYC expression via loss of chromatin accessibility at a leukemia stem cell-specific long-range MYC enhancer. In all, these results identify the mevalonate pathway as a druggable novel vulnerability in high-risk ETP-ALL cells and uncover an unanticipated critical role for cholesterol biosynthesis in signal transduction and epigenetic circuitries driving leukemia cell growth and survival.

Significance: Overtly distinct cell metabolic pathways operate in ETP- and T-ALL pointing to specific metabolic vulnerabilities. Inhibition of mevalonate biosynthesis selectively blocks oncogenic AKT-MYC signaling in ETP-ALL and suppresses leukemia cell growth. Ultimately, these results will inform the development of novel tailored and more effective treatments for patients with high-risk ETP-ALL. This article is highlighted in the In This Issue feature, p. 587.


Conflict of interest statement

Declaration of Interests

The authors declare no competing financial interests relevant for the work reported here. Financial disclosures for Adolfo Ferrando: Consulting for Ayala Pharmaceuticals and SpringWorks Therapeutics; previous research support by Pfizer, Bristol Myers Squib, Merck, Eli Lilly; patent and reagent licensing royalties from Novartis, EMD Millipore and Applied Biological Materials.

Figures

Figure 1.
Figure 1.
Metabolic profiling of T-ALL patient samples. (A) Unsupervised consensus clustering (k = 2) of 22 T-ALL patients using differential detection of 403 named cellular metabolites. (B) Heat map representation of the 53 differentially represented metabolites between Cluster I and Cluster II (fold change > 1.3, p < 0.05). (C) MBrole 2.0 analysis of metabolic pathways encompassing metabolites differentially detected between Cluster I and Cluster II from (B).
Figure 2.
Figure 2.
Transcriptional profiling of T-ALL patient samples. (A) Unsupervised consensus clustering (k = 2) of 50 T-ALL patients using 2,417 expressed metabolic genes. (B) Heat map representation of metabolic genes differentially expressed between ETP-ALL and T-ALL samples. Pictured are the top 50 differentially expressed metabolic genes. (C) GSEA of the top differentially expressed metabolic pathways in ETP-ALL vs. T-ALL. GSEA analysis was performed on 152 metabolic gene sets selected from the MSigDB curated gene sets (C2) collection. (D) GSEA plots for 3 metabolic pathways upregulated in ETP-ALL (top) and 3 metabolic pathways upregulated in T-ALL (bottom). P-value and false discovery rate (FDR) are shown.
Figure 3.
Figure 3.
ETP-ALL are selectively sensitive to statins. (A) Schematic representation of high throughput drug screen. (B) GSEA plot for statins from high throughput drug screen. (C) Dose response curve of CUTLL1 and CUTLL3 cell lines showing cell viability following treatment with Pitavastatin for 72 hours. Shown is a representative example of a dose response curve (n = 3). (D) Dose response curve of CUTLL3 cells showing cell viability following treatment with Pitavastatin or Pitavastatin with 100 μM mevalonate for 72 hours. Shown is a representative example of a dose response curve (n = 3). (E) Dose response curve of CUTLL3 cells showing cell viability following treatment with Pitavastatin or Pitavastatin with 50 μM cholesterol for 72 hours. Shown is a representative example of a dose response curve (n = 3). (F) Dose response curve of CUTLL3 cells showing cell viability following treatment with Pitavastatin or Pitavastatin with 10 μM geranylgeranyl pyrophosphate (GGPP) for 72 hours. Shown is a representative example of a dose response curve (n = 3). (G) Cell cycle analysis of CUTLL3 cells treated with 0.5μM Pitavastatin or vehicle for 72 hours (n = 3). (H) Quantification of 7AAD+ CUTLL3 cells by flow cytometry (n = 3) following treatment with 0.5 μM Pitavastatin or vehicle for 72 hours. (I) Representative histogram of forward scatter as analyzed by flow cytometry from CUTLL3 cells treated with 0.5 μM Pitavastatin or vehicle for 72 hours (n = 3). (J) Representative histogram of LDL receptor (LDLR) surface expression as analyzed by flow cytometry from CUTLL1 (top) or CUTLL3 (bottom) treated with 0.5 μM Pitavastatin or vehicle for 48 hours (n = 3). (K) Live cell number (PI-cells, n = 3) of 3 ETP-ALL patient-derived xenograft samples ex vivo following treatment with 5 μM Pitavastatin or vehicle for 72 hours. (L) Kaplan-Meier survival curve of mice xenografted with human primary ETP-ALL cells (ETP5) treated with 4 cycles of vehicle or Fluvastatin on a 5 days on (red blocks) and two days off schedule. (M) Spleen weights (in grams) of mice from (L). (N) Heat map representation of 62 differentially represented metabolites between CUTLL3 cells treated with Pitavastatin or vehicle for 48 hours (fold change > 2, p < 0.01).
Figure 4.
Figure 4.
Genome-wide mapping of genetic vulnerabilities in ETP-ALL. (A) Schematic illustration of inducible genome-scale CRISPR-Cas9 knockout screening in CUTLL3 ETP-ALL cells. (B) CRISPR screen results. Genes are ranked based on the enrichment of their respective gRNAs compared to controls. Red and blue circles in indicate genes with enriched and depleted gRNAs (FDR < 0.5), respectively. Selected essential genes and genes involved in the cholesterol biosynthetic pathway are highlighted. (C) Dose response curve of CUTLL3 cells showing cell viability following treatment with Pitavastatin, ABT-199 or the combination of Pitavastatin and ABT-199 for 72 hours. Shown is a representative example of a dose response curve (n = 3). (D) Isobologram analysis of the effects of fixed molar ratio combinations of Pitavastatin and ABT-199 in CUTLL3 cells during 72 hours of treatment from (C). Black dots represent the IC50 concentrations for Pitavastatin and ABT-199 individually, and red dot represents the IC50 concentrations for Pitavastatin and ABT-199 in combination.
Figure 5.
Figure 5.
Statins induce cell death by modulating the Akt pathway. (A) Volcano plot representation of changes in gene expression induced by Pitavastatin treatment. Genes downregulated or upregulated are marked in blue or red respectively. (B) GSEA plot of Rapamycin responsive gene signature. P-value and false discovery rate (FDR) are shown. (C) GSEA plots of GSK3 inhibitor (SB216763) responsive genes. Genes that display decreased expression following treatment were tested separately (top) from those that show increased expression (bottom). P-value and false discovery rate (FDR) are shown. (D) Western blot analysis of phospho-AKT, total AKT, phospho-mTOR, total mTOR, phospho-S6, total S6 and Vinculin from CUTLL3 cells treated with vehicle, Pitavastatin or Pitavastatin with mevalonate (MVA), cholesterol (chol.) or geranylgeranyl pyrophosphate (GGPP) after 48 hours. Shown is one representative image for each blot from three independent experiments. (E) Quantification of phospho-AKT expression relative to total AKT expression in CUTLL3 cells from (D). (F) Quantification of 7AAD+ cells by flow cytometry (n = 3) following treatment with Pitavastatin or vehicle for 72 hours in CUTLL3 cells stably expressing empty vector control or myristoylated AKT. Respective Pitavastatin values are normalized to respective vehicle controls. (G) Dose response curve of CUTLL3 cells showing cell viability following treatment with Pitavastatin for 72 hours in cells stably expressing empty vector control or myristoylated AKT. Shown is a representative example of a dose response curve (n = 3). (H) Western blot analysis of phospho-AKT, total AKT and Flotillin-1 from plasma membrane-derived lipid rafts isolated from CUTLL3 cells treated with vehicle or Pitavastatin after 48 hours. Shown is one representative image for each blot from three independent experiments. (I) Quantification of phospho-AKT expression relative to total AKT expression in CUTLL3 cells from (H).
Figure 6.
Figure 6.
Regulation of the MYC locus following statin treatment. (A) GSEA plot of Hallmark MYC targets gene signature. P-value and false discovery rate (FDR) are shown. (B) Western blot analysis of phospho-MYC, total MYC, and Histone H3 from CUTLL3 cells treated with vehicle, Pitavastatin or Pitavastatin with mevalonate (MVA), cholesterol (chol.) or geranylgeranyl pyrophosphate (GGPP) after 48 hours. Shown is one representative image for each blot from three independent experiments. (C) Quantification of total MYC expression relative to Histone H3 expression in CUTLL3 cells from (B). (D) Quantification of pMYC expression relative to total MYC expression in CUTLL3 cells from (B). (E) Normalized MYC expression in FPKM. (F) Quantification of 7AAD+ cells by flow cytometry (n = 3) following treatment with Pitavastatin or vehicle for 72 hours in CUTLL3 cells stably expressing empty vector control or MYC. Respective Pitavastatin values are normalized to respective vehicle controls. (G) Dose response curve of CUTLL3 cells showing cell viability following treatment with Pitavastatin for 72 hours in cells stably expressing empty vector control or MYC. Shown is a representative example of a dose response curve (n = 3). (H) ATACseq chromatin accessibility analysis of the MYC locus in CUTLL3 cells treated with vehicle or Pitavastatin for 48 hours. Normalized signal tracks for each treatment and differential chromatin accessibility heat map are shown. (I) ATACseq chromatin accessibility analysis of the BENC-C locus in 3 ETP-ALL patients. Normalized signal tracks for each sample are shown. Cumulative accessibility from all 3 ETP-ALL patients is shown as a heatmap in green. (J) H3K27Ac ChIPseq analysis of the MYC locus in CUTLL3 cells treated with vehicle or Pitavastatin for 48 hours. Normalized signal tracks for each treatment and differential acetylation heat map are shown. (K) Schematic representation of conserved transcription factor binding motifs in the BENC-C sequence. (L) Reverse ChIP identification of potential BENC-C–binding factors. A BENC-C DNA bait was incubated in the presence of nuclear extracts from CUTLL3 cells and recovered peptides were analyzed by mass spectrometry.

References

    1. Rashkovan M, Ferrando A. Metabolic dependencies and vulnerabilities in leukemia. Genes Dev 2019;33(21–22):1460–74 doi 10.1101/gad.326470.119. - DOI - PMC - PubMed
    1. Xiao G, Chan LN, Klemm L, Braas D, Chen Z, Geng H, et al. B-Cell-Specific Diversion of Glucose Carbon Utilization Reveals a Unique Vulnerability in B Cell Malignancies. Cell 2018;173(2):470–84 e18 doi 10.1016/j.cell.2018.02.048. - DOI - PMC - PubMed
    1. Palomero T, Lim WK, Odom DT, Sulis ML, Real PJ, Margolin A, et al. NOTCH1 directly regulates c-MYC and activates a feed-forward-loop transcriptional network promoting leukemic cell growth. Proceedings of the National Academy of Sciences of the United States of America 2006;103(48):18261–6 doi 10.1073/pnas.0606108103. - DOI - PMC - PubMed
    1. Palomero T, Sulis ML, Cortina M, Real PJ, Barnes K, Ciofani M, et al. Mutational loss of PTEN induces resistance to NOTCH1 inhibition in T-cell leukemia. Nature medicine 2007;13(10):1203–10 doi 10.1038/nm1636. - DOI - PMC - PubMed
    1. Herranz D, Ambesi-Impiombato A, Sudderth J, Sanchez-Martin M, Belver L, Tosello V, et al. Metabolic reprogramming induces resistance to anti-NOTCH1 therapies in T cell acute lymphoblastic leukemia. Nature medicine 2015;21(10):1182–9 doi 10.1038/nm.3955. - DOI - PMC - PubMed

Publication types

MeSH terms