. 2021 Oct 28;6(1):129.
doi: 10.1038/s41541-021-00392-7.

A SARS-CoV-2 spike ferritin nanoparticle vaccine protects hamsters against Alpha and Beta virus variant challenge

Affiliations

A SARS-CoV-2 spike ferritin nanoparticle vaccine protects hamsters against Alpha and Beta virus variant challenge

Kathryn McGuckin Wuertz et al. NPJ Vaccines. .

Abstract

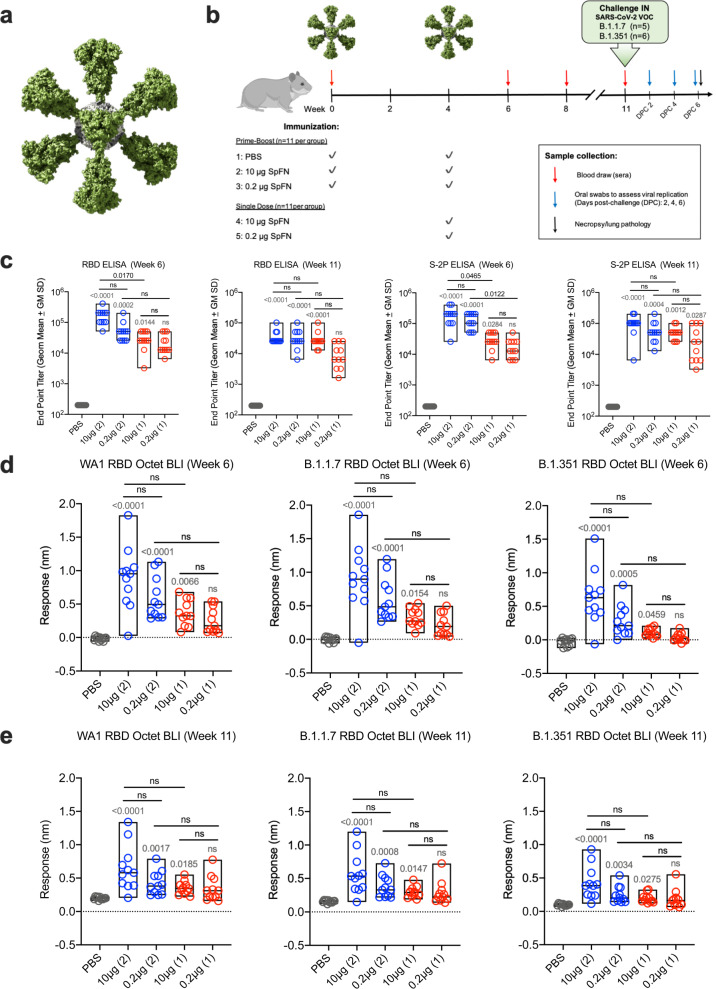
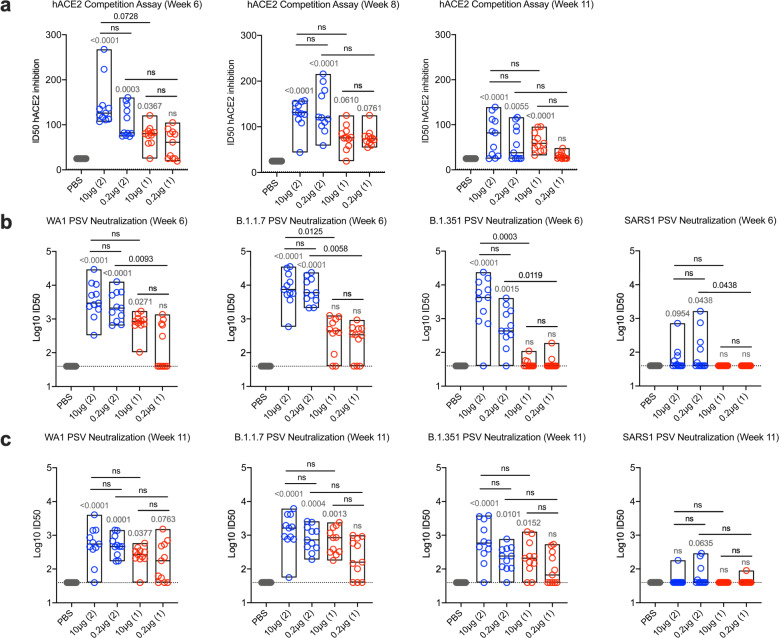
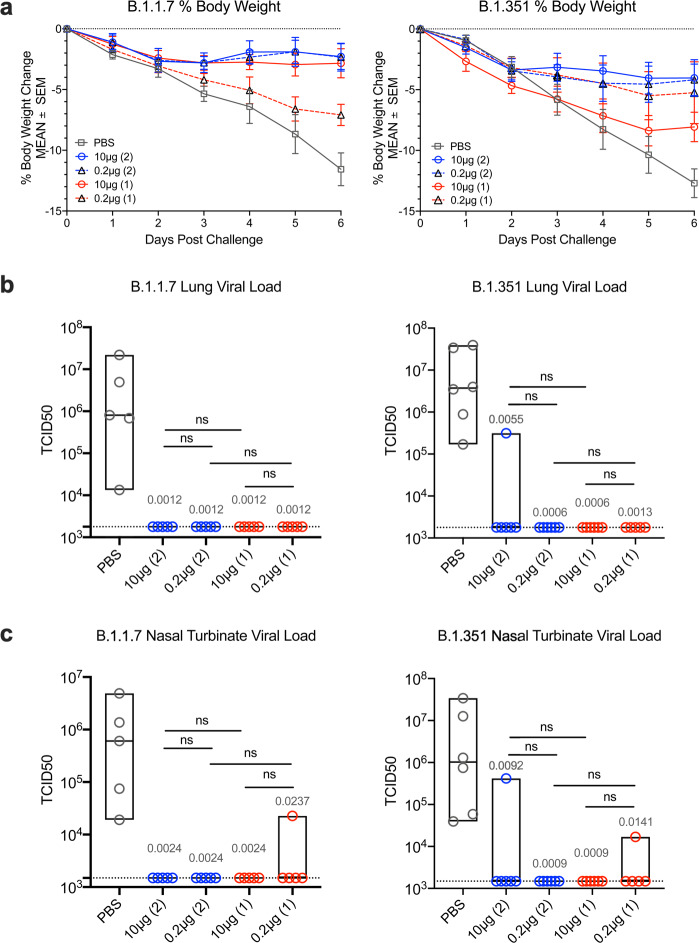
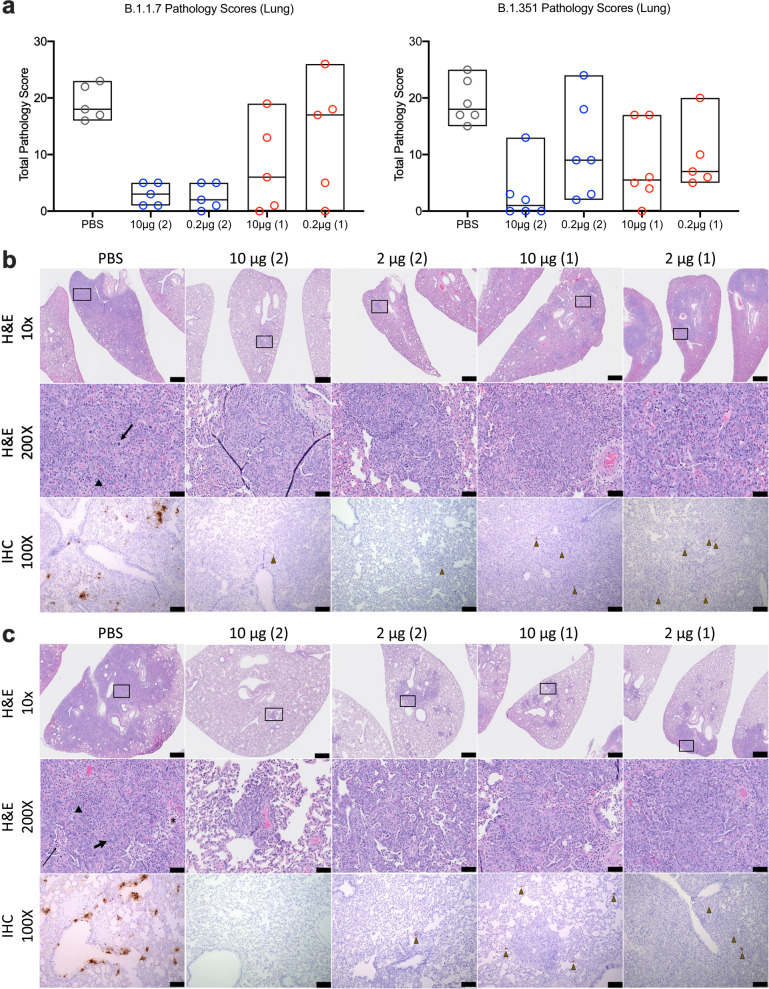
The emergence of SARS-CoV-2 variants of concern (VOC) requires adequate coverage of vaccine protection. We evaluated whether a SARS-CoV-2 spike ferritin nanoparticle vaccine (SpFN), adjuvanted with the Army Liposomal Formulation QS21 (ALFQ), conferred protection against the Alpha (B.1.1.7), and Beta (B.1.351) VOCs in Syrian golden hamsters. SpFN-ALFQ was administered as either single or double-vaccination (0 and 4 week) regimens, using a high (10 μg) or low (0.2 μg) dose. Animals were intranasally challenged at week 11. Binding antibody responses were comparable between high- and low-dose groups. Neutralizing antibody titers were equivalent against WA1, B.1.1.7, and B.1.351 variants following two high dose vaccinations. Dose-dependent SpFN-ALFQ vaccination protected against SARS-CoV-2-induced disease and viral replication following intranasal B.1.1.7 or B.1.351 challenge, as evidenced by reduced weight loss, lung pathology, and lung and nasal turbinate viral burden. These data support the development of SpFN-ALFQ as a broadly protective, next-generation SARS-CoV-2 vaccine.


Conflict of interest statement

Drs. Modjarrad and Joyce are co-inventors on a pending patent application for the Spike Protein Ferritin Nanoparticle (PCT/US2021/021405) Assigned to the U.S. Government as represented by the Secretary of the Army.

Figures

Fig. 1
Fig. 1. Antibody responses following SpFN-ALFQ immunization.
a The 3-dimensional model of SpFN with Spike protein trimers (green) decorating a ferritin core (gray) as viewed down a 3-fold axis. b Experimental design with hamsters receiving immunization at weeks 0 and 4 in the 2-dose regimen and week 4 in the 1-dose regimen as depicted by green SpFN structures above the time-line and check marks below the timeline indicating immunogen dose (10 μg or 0.2 μg or PBS control). Phlebotomy samples were taken at weeks 0, 6, 8, and 11 as indicated by red arrows. Intranasal (IN) viral challenge was performed at week 11 with either VOC B.1.1.7 or B.1.351 viral stocks with the number of animals challenged noted parenthetically. Oral swabs were collected at 2, 4, and 6 days post challenge (DPC) as indicated by blue arrows above the timeline. Necropsy was performed on all animals at day 6 post-challenge as indicated by the black arrow. c ELISA was performed using either WA1 derived Receptor Binding Domain (RBD) or S-2P Spike proteins from sera taken at weeks 6 and 11. Sera from week 0 was also assessed, with no detectable signal observed in any samples (data not shown). The vaccine regimens are indicated on the x-axis by PBS (control) or SpFN concentration with the number of vaccinations in the regimen given parenthetically and by color code (blue, 2-dose, red, 1-dose). Endpoint titers are graphed as geometric mean titers. d, e Octet Biolayer Interferometry (BLI) responses against the WA1, B.1.1.7, and B.1.351 sequences of the RBD are given for the vaccination regimens as in c at weeks 6 (d) and 11 (e). BLI responses are given in nanometers (nm) on the y-axis. Box plot bounds depict the standard deviation and the center line the median value. p-values for active vaccination groups compared with PBS control are given just above the boxes in light gray; intra-active regimen p-values are given above the boxes in black. ns not significant (p > 0.05) using the Kruskal–Wallis multiple comparisons test, with Dunn’s correction.
Fig. 2
Fig. 2. Human angiotensin-converting enzyme competition and pseudovirus neutralization responses following SpFN-ALFQ immunization.
a Human angiotensin-converting enzyme competition (hACE2) assays were performed from sera taken at week 6, 8, and 11. The vaccine regimens are indicated on the x-axis by PBS (control) or SpFN-ALFQ concentration with the number of vaccinations in the regimen given parenthetically and by color code (blue, 2-dose, red, 1-dose). Inhibitory dose 50% (ID50) are given on the y-axis. b, c Pseudovirus neutralization at weeks 6 and 11 are given against Spike proteins derived from WA1, B.1.1.7, B.1.351 SARS-CoV-2 variants and from SARS-CoV-1. The neutralization titers are given as inhibitory dose 50% (ID50) on the y-axis in logarithmic scale. Box plot bounds depict the standard deviation and the center line the median value. p-values for SpFN-ALFQ vaccination groups compared with PBS control are given just above the boxes in light gray while intra-active regimen p-values are given above the boxes in black. ns not significant (p > 0.05) using the Kruskal–Wallis multiple comparisons test, with Dunn’s correction.
Fig. 3
Fig. 3. Body weight changes and lung viral load post-challenge.
Daily weights were gathered on hamsters from the time of viral challenge to necropsy on day 6 post challenge when lungs were harvested for a whole tissue, culture based viral load assessment in Vero TMPRSS2 cells. a Mean percent body weight changes plus and minus standard error of the mean (SEM) are given on the y-axis for groups of hamsters assigned to phosphate buffered saline control (PBS) or SpFN-ALFQ vaccination from day of challenge (day 0) to day of necropsy (day 6) for either B.1.1.7 or B.1.351 challenge. Data from immunization groups are given in each graph as PBS (gray plot, phosphate buffered saline control) or active immunogen dose (blue circle/ blue solid line, 10 μg 2-dose regimen; black triangle/ blue dotted line, 0.2 μg 2-dose regimen; red circle/red solid line, 10 μg 1-dose regimen; black triangle/red dotted line, 0.2 μg 1-dose regimen. Number of vaccinations in the vaccine regimen are also given parenthetically within each graph. b SARS-CoV-2 viral load data from lung tissue harvested on day 6 post challenge is given on the y-axis as the tissue culture infective dose, 50% (TCID50) per gram of tissue as titered on Vero TMPRSS2 cells and read out by cytopathic effects for either B.1.1.7 and B.1.351 challenged hamsters. Immunization groups are given on the x-axis as PBS (control (gray circles); 10 μg and 0.2 μg 2-dose vaccine regimens (blue circles); 10 μg and 0.2 μg 1-dose vaccine regimens (red circles). c SARS-CoV-2 viral load data from nasal turbinate tissue harvested on day 6 post challenge is given as in b. Group data are displayed as box plots with the top and bottom bars of the box the standard deviation and the center line as median group values. The dotted horizontal line is the lower limit of detection of the assay. p-values for SpFN-ALFQ vaccination groups compared with PBS control are given just above the boxes in light gray while intra-active regimen p-values are given above the boxes in black. ns not significant (p > 0.05) using the Kruskal–Wallis multiple comparisons test, with Dunn’s correction.
Fig. 4
Fig. 4. Standard and immunohistopathologic examination post-challenge.
Lung tissues were collected at necropsy on day 6 post-challenge, fixed with neutral-buffered formalin, and stained with hematoxylin and eosin (H&E) for standard microscopic examination as well has submitted for immunohistochemical (IHC) staining for SARS-CoV-2 nucleocapsid (N) protein. a H&E stained slides were scored for pathologic effects on the y-axis (see Methods section) for B.1.1.7 (left) and B.1.351 (right) challenged hamsters. Vaccination group box plot bounds reflect minimum and maximum values and the center line is the median group score. Vaccination groups are given as: PBS control (gray circles); 10 μg and 0.2 μg 2-dose vaccine regimens (blue circles); 10 μg and 0.2 μg 1-dose vaccine regimens (red circles). b, c Representative lung tissue sections from the PBS control and 10 μg and 0.2 μg 2-dose and 1-dose regimens with the number of vaccinations given parenthetically for B.1.1.7 (b) and B.1.351 (c) challenged hamsters in the columns as indicated. Rows are given by either H&E at 10- and 200-times magnification power (×10 and ×200, respectively) or IHC of SARS-CoV-2 viral antigen at 100 times magnification power (×100). The black boxes in the top row indicate the area magnified in the middle row. Interstitial pneumonia is characterized by inflammatory cellular infiltrates (triangle), type II pneumocyte hyperplasia (thick arrow), bronchiolar epithelial hyperplasia, bronchiolar exudate (thin arrow), and edema (asterisk). SARS-CoV-2 immunopositive cells are highlighted by brown triangles. Scale bars: top row, 1 mm; middle row, 50 µm; bottom row, 100 µm.

Update of

References

    1. Craven, J. (Regulatory Affairs Professionals Society, 2021). https://www.raps.org/news-and-articles/news-articles/2020/3/covid-19-vac....
    1. Hu B, Guo H, Zhou P, Shi ZL. Characteristics of SARS-CoV-2 and COVID-19. Nat. Rev. Microbiol. 2021;19:141–154. doi: 10.1038/s41579-020-00459-7. - DOI - PMC - PubMed
    1. CDC. SARS-CoV-2 Variant Classifications and Definitions, https://www.cdc.gov/coronavirus/2019-ncov/cases-updates/variant-surveill... (2021).
    1. Wang P, et al. Antibody resistance of SARS-CoV-2 variants B.1.351 and B.1.1.7. Nature. 2021;593:130–135. doi: 10.1038/s41586-021-03398-2. - DOI - PubMed
    1. Wibmer CK, et al. SARS-CoV-2 501Y.V2 escapes neutralization by South African COVID-19 donor plasma. Nat. Med. 2021;27:622–625. doi: 10.1038/s41591-021-01285-x. - DOI - PubMed