

Published Erratum
doi: 10.1038/s41598-021-01168-8.
Publisher Correction: Morphodynamics facilitate cancer cells to navigate 3D extracellular matrix
Affiliations
- PMID: 34711844
- PMCID: PMC8553770
- DOI: 10.1038/s41598-021-01168-8
Item in Clipboard
Published Erratum
Publisher Correction: Morphodynamics facilitate cancer cells to navigate 3D extracellular matrix
Sci Rep.
.
No abstract available
Figures
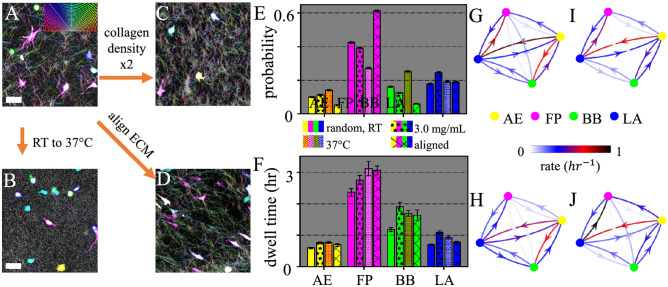
Physical properties of collagen ECM regulate the morphological phenotype homeostasis of 3D migrating MDA-MB-231 cells. (A–D) Confocal reflection images and pseudo colored MDA-MB-231 cells for collagen matrices prepared at varying conditions. Scale bars: 20 μm. A Collagen ECM prepared at room temperature (RT, or 25 °C) and collagen concentration of mg/mL. B Collagen ECM prepared at 37 °C and mg/mL. C Collagen ECM prepared at RT and mg/mL. D collagen ECM prepared with flow-aligned collagen fibers. (E) Fraction of cells in each morphological phenotype. 8000 single cell images are analyzed under each ECM condition. (F) Dwell time of cells in each morphological phenotype. Errorbars in (E, F) represent 95% confidence intervals calculated from 1000 bootstrap iterations. (G–J) The transition matrix—morphological phenotype transition rates under varying ECM conditions. G Collagen ECM prepared at room temperature and mg/mL. H Collagen ECM prepared at 37 °C and mg/mL. I Collagen ECM prepared at RT and mg/mL. J Collagen ECM prepared with flow-aligned collagen fibers. Under each ECM condition a total of more than 2000 h of single cell trajectories are analyzed. This figure is prepared with Matlab R2020a (www.mathworks.com ) and ImageJ (https://imagej.net ).
Erratum for
-
Morphodynamics facilitate cancer cells to navigate 3D extracellular matrix.Sci Rep. 2021 Oct 14;11(1):20434. doi: 10.1038/s41598-021-99902-9. Sci Rep. 2021. PMID: 34650167 Free PMC article.
Publication types
LinkOut - more resources
Full Text Sources
