

Kinetics, energy efficiency and mathematical modeling of thin layer solar drying of figs (Ficus carica L.)
- PMID: 34711867
- PMCID: PMC8553925
- DOI: 10.1038/s41598-021-00690-z
Kinetics, energy efficiency and mathematical modeling of thin layer solar drying of figs (Ficus carica L.)
Erratum in
-
Author Correction: Kinetics, energy efficiency and mathematical modeling of thin layer solar drying of figs (Ficus carica L.).Sci Rep. 2021 Nov 9;11(1):22226. doi: 10.1038/s41598-021-01688-3. Sci Rep. 2021. PMID: 34754054 Free PMC article. No abstract available.
Abstract
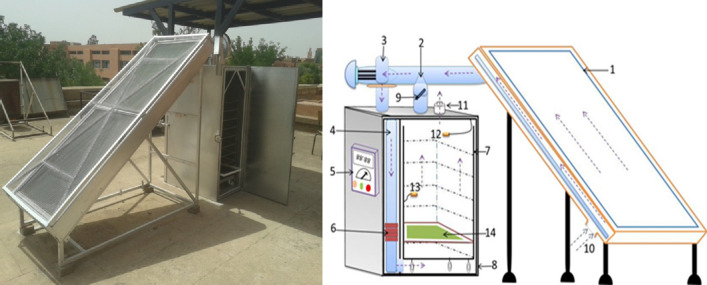
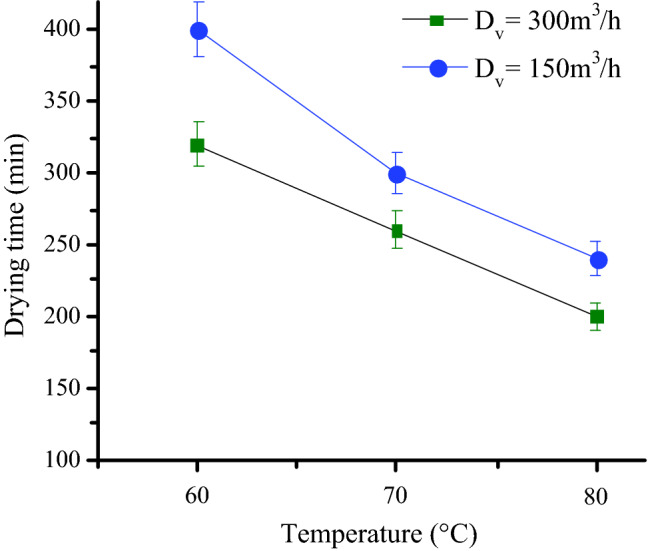
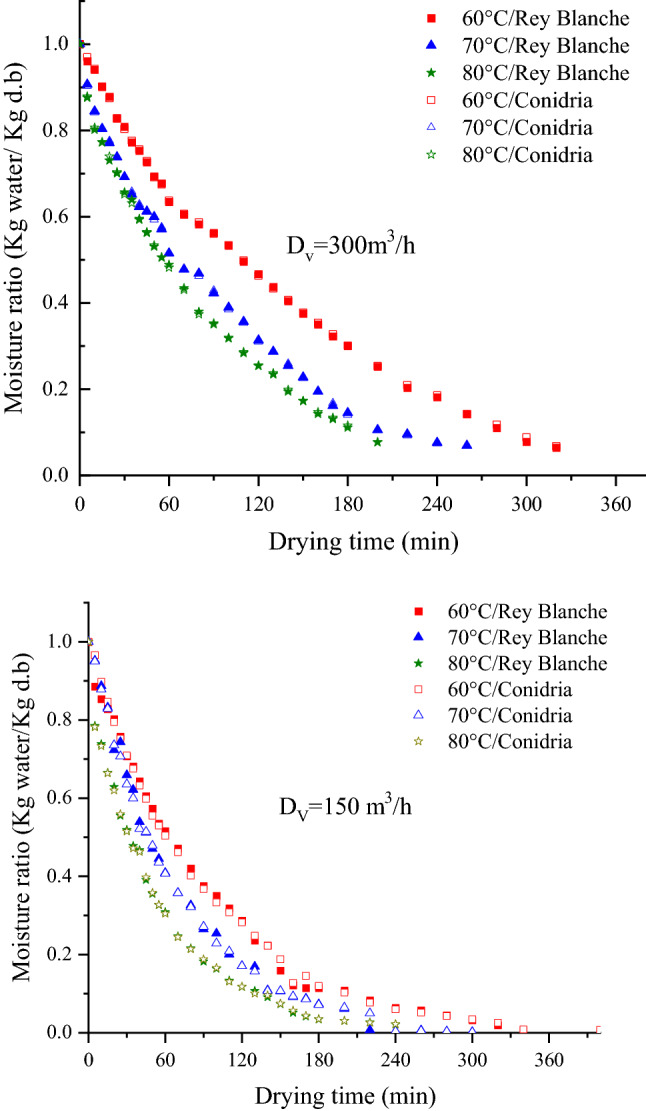
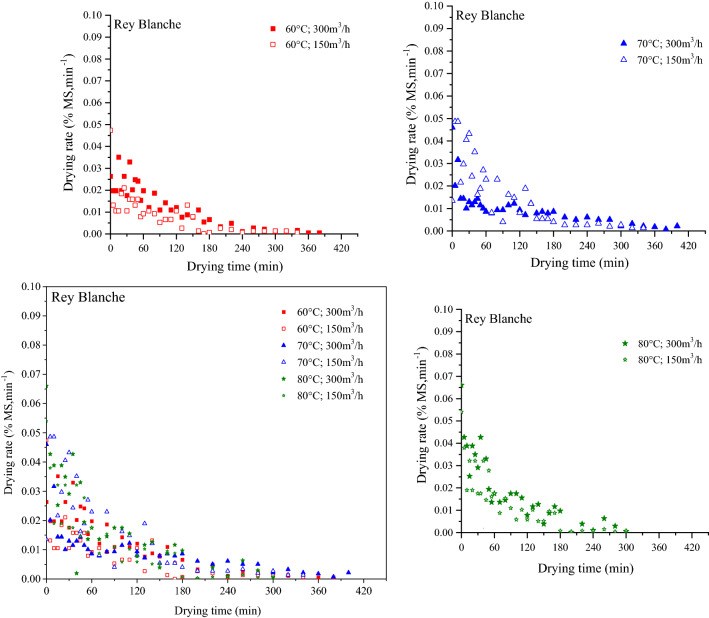
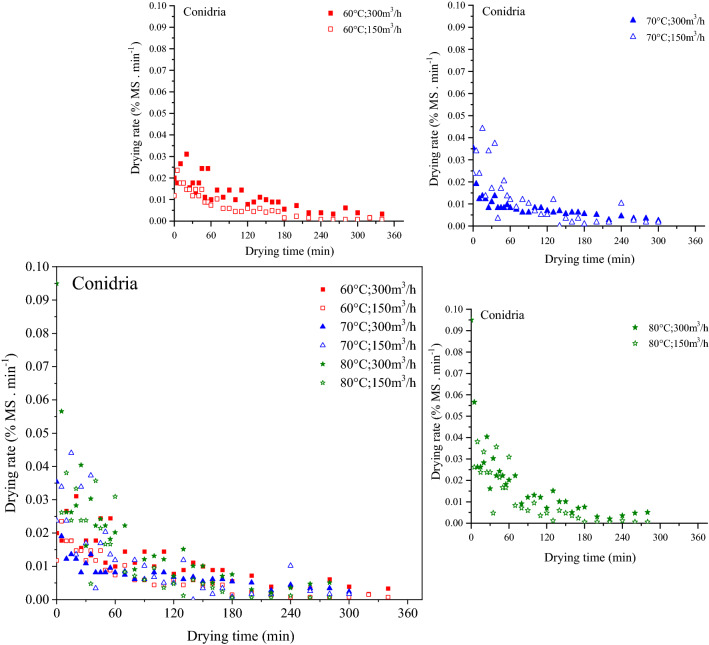
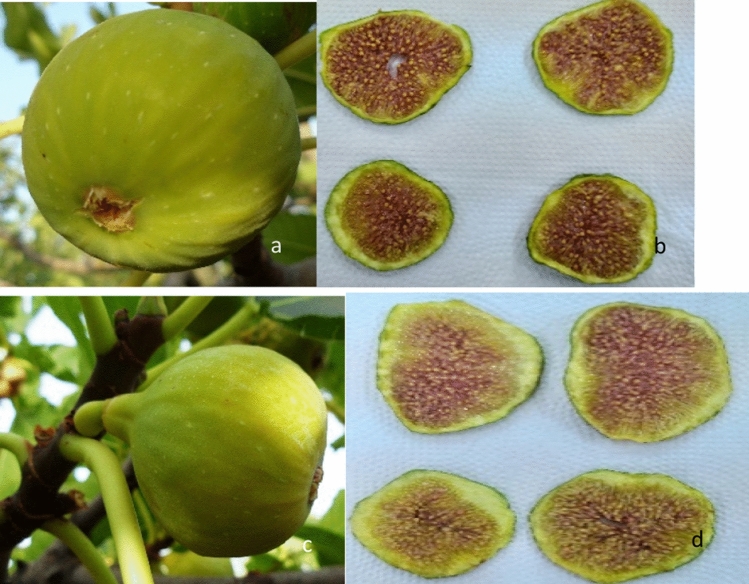
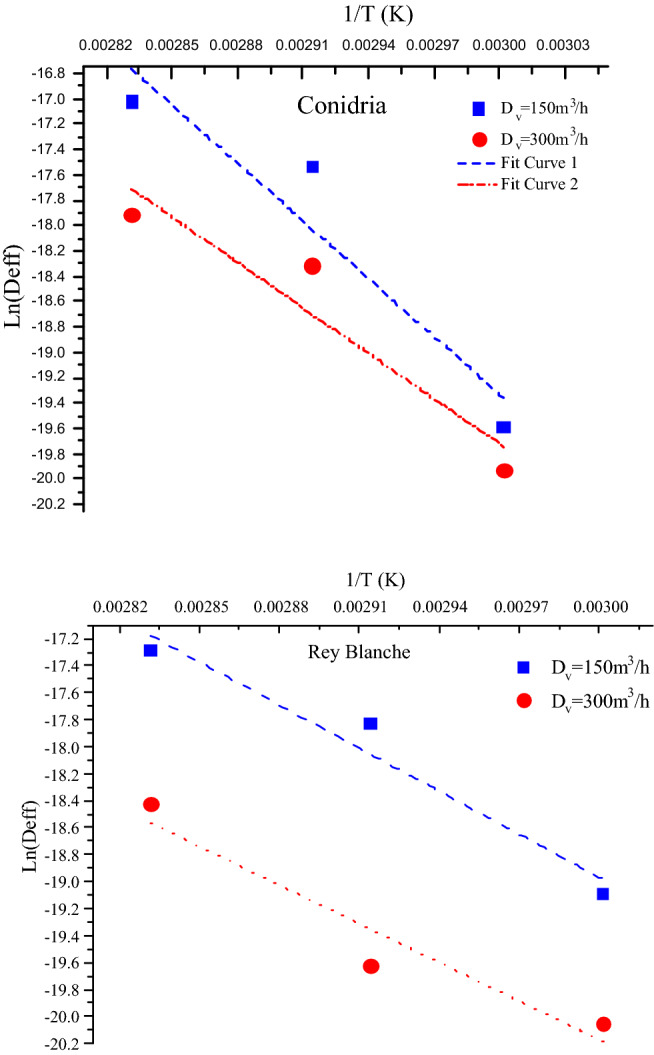
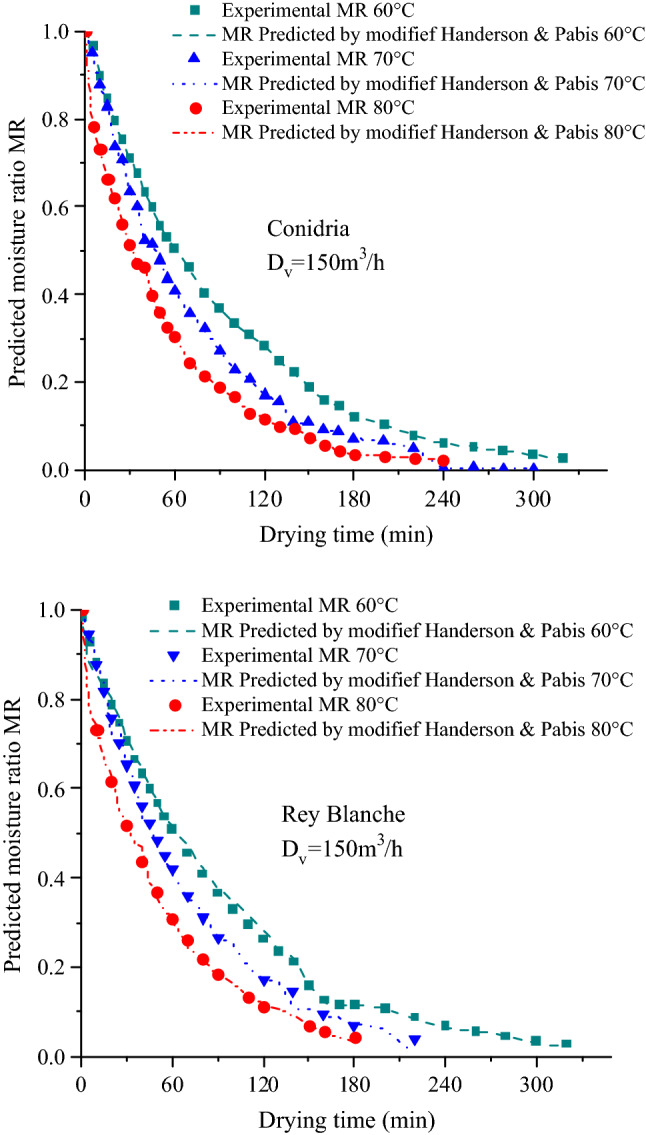
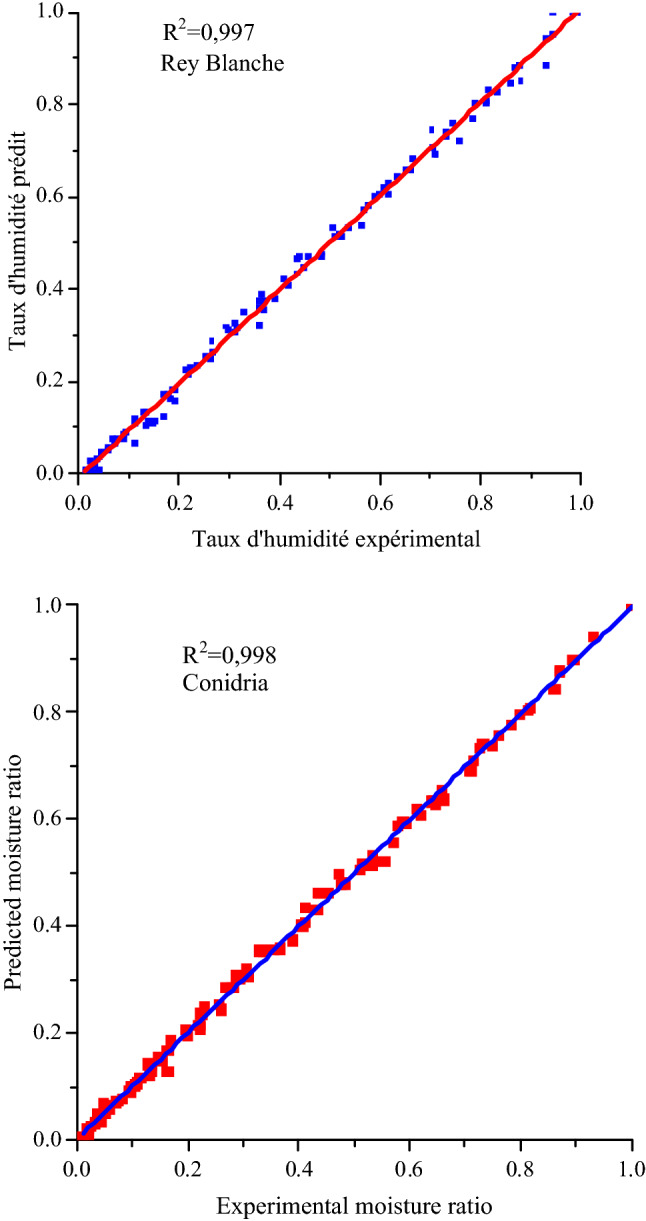
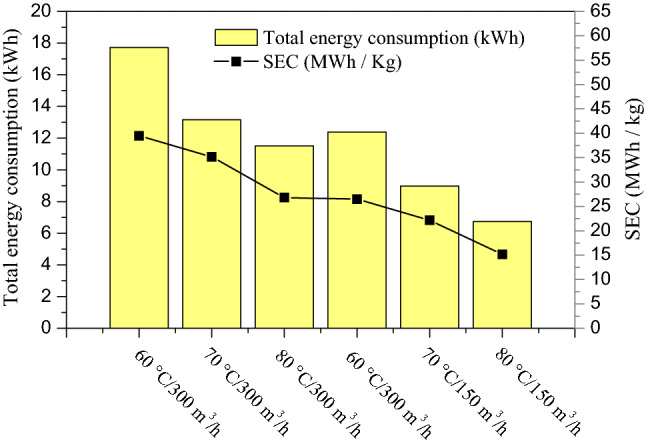
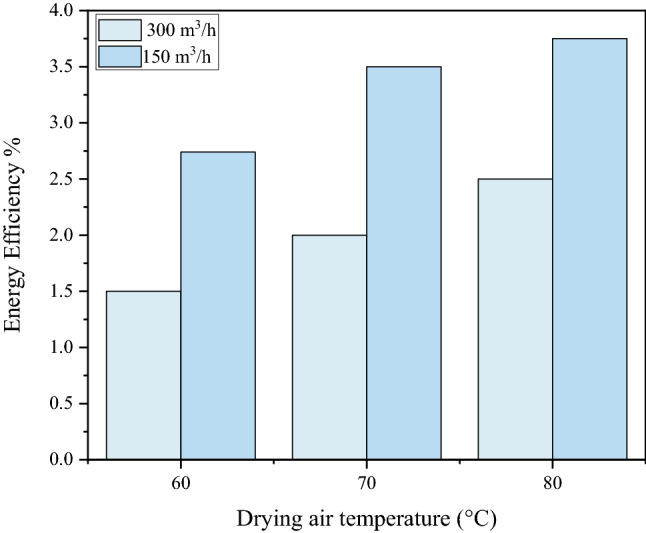
First convectional thin layer drying of two fig (Ficus carica L.) varieties growing in Moroccan, using partially indirect convective dryer, was performed. The experimental design combined three air temperatures levels (60, 70 and 80 °C) and two air-flow rates (150 and 300 m3/h). Fig drying curve was defined as a third-order polynomial equation linking the sample moisture content to the effective moisture diffusivity. The average activation energy was ranged between 4699.41 and 7502.37 kJ/kg. It raised proportionally with the air flow velocity, and the same pattern were observed for effective moisture diffusivity regarding drying time and velocity. High levels of temperature (80 °C) and velocity (300 m3/h) lead to shorten drying time (200 min) and improve the slices physical quality. Among the nine tested models, Modified Handerson and Pabis exhibited the highest correlation coefficient value with the lowest chi-square for both varieties, and then give the best prediction performance. Energetic investigation of the dryer prototype showed that the total use of energy alongside with the specific energy utilization (13.12 and 44.55 MWh/kg) were inversely proportional to the velocity and drying temperature. Likewise, the energy efficiency was greater (3.98%) higher in drying conditions.
© 2021. The Author(s).
Conflict of interest statement
The authors declare no competing interests.
Figures


References
-
- Hssaini L, et al. Comparative analysis and physio-biochemical screening of an ex-situ fig (Ficus carica L.) collection. Hortic. Environ. Biotechnol. 2019;60:671–683.
-
- Wang D, et al. Drying kinetics of American ginseng slices in thin-layer air impingement dryer. Int. J. Food Eng. 2015;11:701–711.
-
- Nurlaila W, Desa M, Mohammad M, Fudholi A. Review of drying technology of fig. Trends Food Sci. Technol. 2019 doi: 10.1016/j.tifs.2019.03.018. - DOI
-
- Raghavi LM, Moses JA, Anandharamakrishnan C. Refractance window drying of foods: A review. J. Food Eng. 2018;222:267–275.
-
- Mat Desa WN, Mohammad M, Fudholi A. Review of drying technology of fig. Trends Food Sci. Technol. 2019;88:93–103.
LinkOut - more resources
Full Text Sources
