

Co-infection of SARS-CoV-2 and influenza virus causes more severe and prolonged pneumonia in hamsters
- PMID: 34711897
- PMCID: PMC8553868
- DOI: 10.1038/s41598-021-00809-2
Co-infection of SARS-CoV-2 and influenza virus causes more severe and prolonged pneumonia in hamsters
Abstract
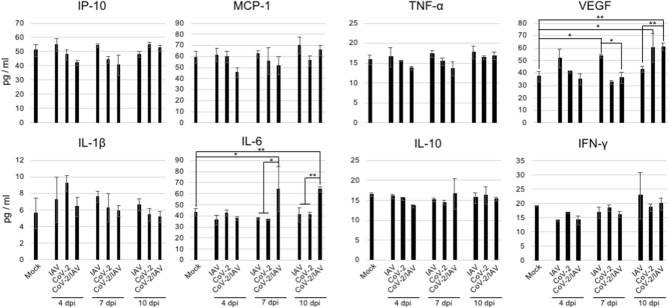
Coronavirus disease 2019 (COVID-19) caused by severe acute respiratory syndrome coronavirus 2 (SARS-CoV-2) is currently a serious public health concern worldwide. Notably, co-infection with other pathogens may worsen the severity of COVID-19 symptoms and increase fatality. Here, we show that co-infection with influenza A virus (IAV) causes more severe body weight loss and more severe and prolonged pneumonia in SARS-CoV-2-infected hamsters. Each virus can efficiently spread in the lungs without interference by the other. However, in immunohistochemical analyses, SARS-CoV-2 and IAV were not detected at the same sites in the respiratory organs of co-infected hamsters, suggesting that either the two viruses may have different cell tropisms in vivo or each virus may inhibit the infection and/or growth of the other within a cell or adjacent areas in the organs. Furthermore, a significant increase in IL-6 was detected in the sera of hamsters co-infected with SARS-CoV-2 and IAV at 7 and 10 days post-infection, suggesting that IL-6 may be involved in the increased severity of pneumonia. Our results strongly suggest that IAV co-infection with SARS-CoV-2 can have serious health risks and increased caution should be applied in such cases.
© 2021. The Author(s).
Conflict of interest statement
The authors declare no competing interests.
Figures


Similar articles
-
Coinfection with influenza A virus enhances SARS-CoV-2 infectivity.Cell Res. 2021 Apr;31(4):395-403. doi: 10.1038/s41422-021-00473-1. Epub 2021 Feb 18. Cell Res. 2021. PMID: 33603116 Free PMC article.
-
Coinfection with SARS-CoV-2 and Influenza A Virus Increases Disease Severity and Impairs Neutralizing Antibody and CD4+ T Cell Responses.J Virol. 2022 Mar 23;96(6):e0187321. doi: 10.1128/jvi.01873-21. Epub 2022 Feb 2. J Virol. 2022. PMID: 35107382 Free PMC article.
-
Sequential Infection with Influenza A Virus Followed by Severe Acute Respiratory Syndrome Coronavirus 2 (SARS-CoV-2) Leads to More Severe Disease and Encephalitis in a Mouse Model of COVID-19.Viruses. 2024 May 28;16(6):863. doi: 10.3390/v16060863. Viruses. 2024. PMID: 38932155 Free PMC article.
-
Co-infection of SARS-COV-2 and Influenza A Virus: A Case Series and Fast Review.Curr Med Sci. 2021 Feb;41(1):51-57. doi: 10.1007/s11596-021-2317-2. Epub 2021 Feb 13. Curr Med Sci. 2021. PMID: 33582905 Free PMC article. Review.
-
Immunopathological similarities between COVID-19 and influenza: Investigating the consequences of Co-infection.Microb Pathog. 2021 Mar;152:104554. doi: 10.1016/j.micpath.2020.104554. Epub 2020 Nov 3. Microb Pathog. 2021. PMID: 33157216 Free PMC article. Review.
Cited by
-
SARS-CoV-2 and Influenza Virus Co-Infection Cases Identified through ILI/SARI Sentinel Surveillance: A Pan-India Report.Viruses. 2022 Mar 17;14(3):627. doi: 10.3390/v14030627. Viruses. 2022. PMID: 35337033 Free PMC article.
-
Human respiratory syncytial virus subgroups A and B outbreak in a kindergarten in Zhejiang Province, China, 2023.Front Public Health. 2024 Feb 16;12:1368744. doi: 10.3389/fpubh.2024.1368744. eCollection 2024. Front Public Health. 2024. PMID: 38435292 Free PMC article.
-
mRNA-encoded Cas13 treatment of Influenza via site-specific degradation of genomic RNA.PLoS Pathog. 2024 Jul 5;20(7):e1012345. doi: 10.1371/journal.ppat.1012345. eCollection 2024 Jul. PLoS Pathog. 2024. PMID: 38968329 Free PMC article.
-
Anti-influenza T cells in bronchoalveolar microenvironment of critically severe COVID-19 patients.Crit Care. 2021 Dec 20;25(1):444. doi: 10.1186/s13054-021-03871-4. Crit Care. 2021. PMID: 34930426 Free PMC article. No abstract available.
-
Rational development of a combined mRNA vaccine against COVID-19 and influenza.NPJ Vaccines. 2022 Jul 26;7(1):84. doi: 10.1038/s41541-022-00478-w. NPJ Vaccines. 2022. PMID: 35882870 Free PMC article.
References
Publication types
MeSH terms
Substances
Grants and funding
LinkOut - more resources
Full Text Sources
Medical
Miscellaneous
