. 2021 Nov;53(11):1527-1533.
doi: 10.1038/s41588-021-00945-5. Epub 2021 Oct 28.

An open approach to systematically prioritize causal variants and genes at all published human GWAS trait-associated loci

Affiliations

An open approach to systematically prioritize causal variants and genes at all published human GWAS trait-associated loci

Edward Mountjoy et al. Nat Genet. 2021 Nov.

Abstract

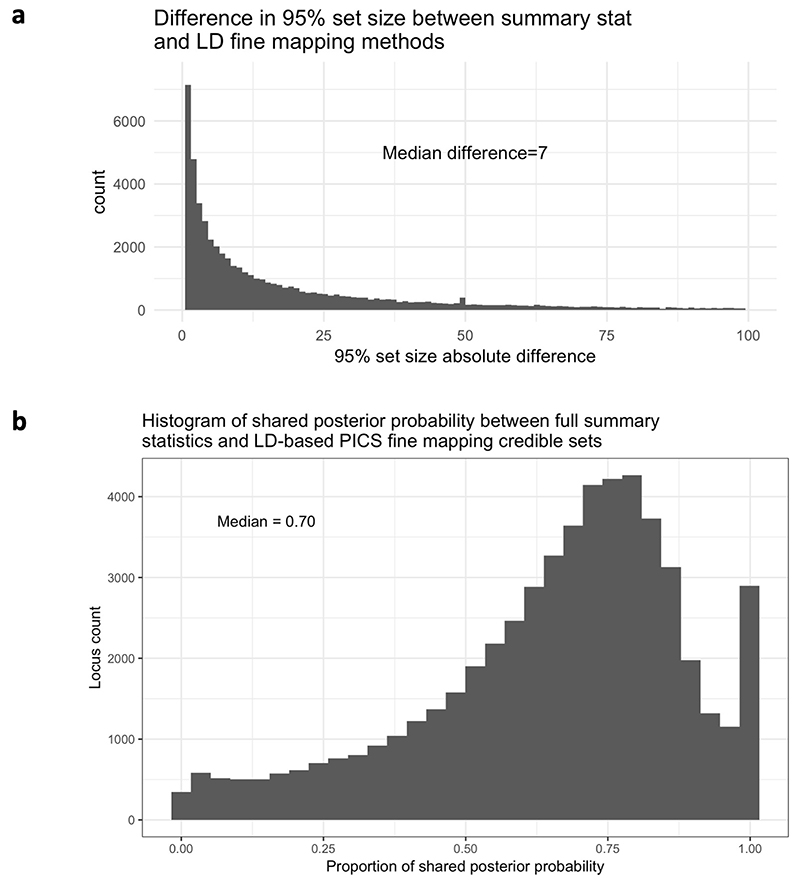
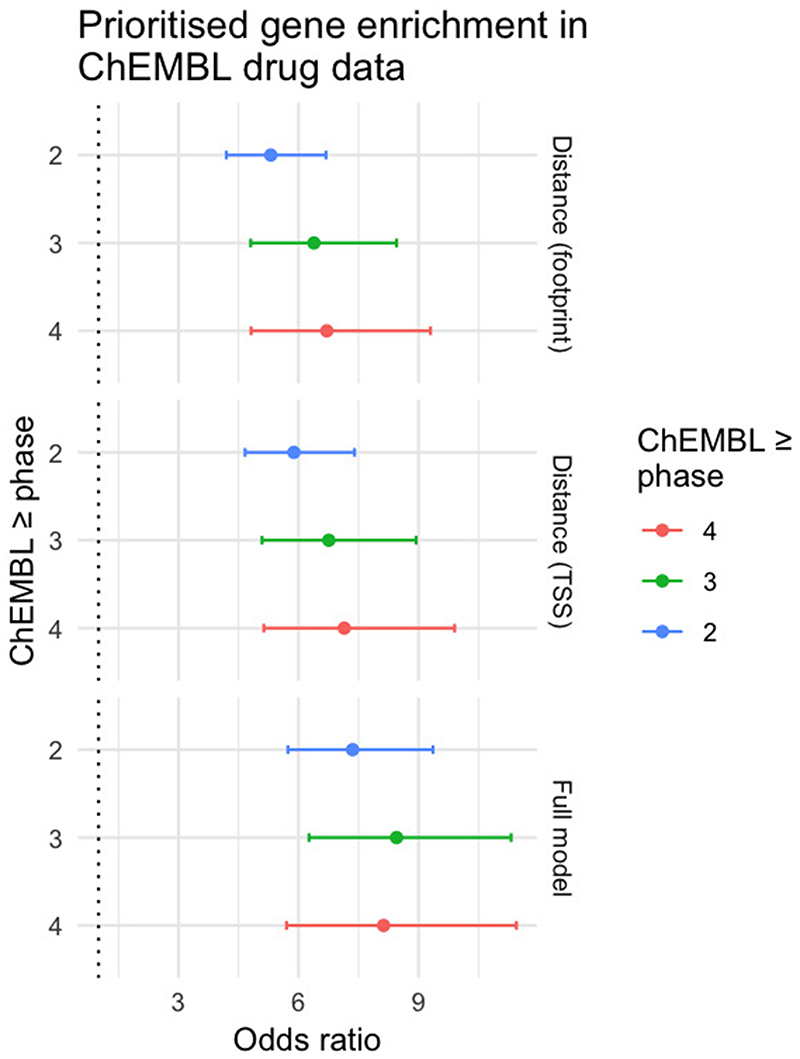
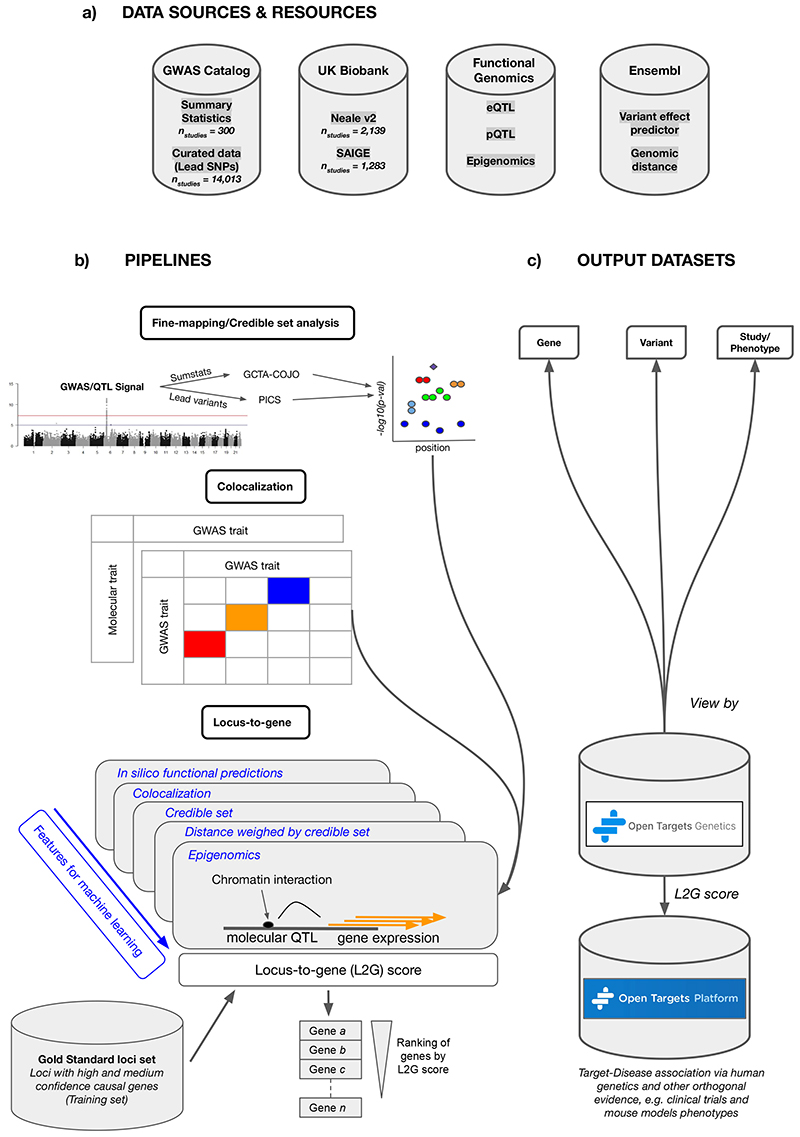
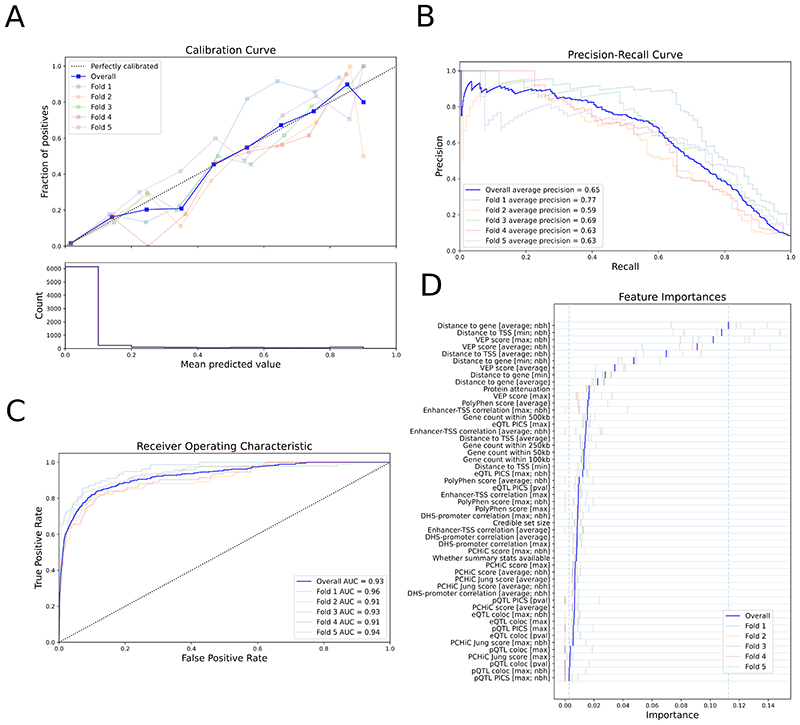
Genome-wide association studies (GWASs) have identified many variants associated with complex traits, but identifying the causal gene(s) is a major challenge. In the present study, we present an open resource that provides systematic fine mapping and gene prioritization across 133,441 published human GWAS loci. We integrate genetics (GWAS Catalog and UK Biobank) with transcriptomic, proteomic and epigenomic data, including systematic disease-disease and disease-molecular trait colocalization results across 92 cell types and tissues. We identify 729 loci fine mapped to a single-coding causal variant and colocalized with a single gene. We trained a machine-learning model using the fine-mapped genetics and functional genomics data and 445 gold-standard curated GWAS loci to distinguish causal genes from neighboring genes, outperforming a naive distance-based model. Our prioritized genes were enriched for known approved drug targets (odds ratio = 8.1, 95% confidence interval = 5.7, 11.5). These results are publicly available through a web portal ( http://genetics.opentargets.org ), enabling users to easily prioritize genes at disease-associated loci and assess their potential as drug targets.


Conflict of interest statement

Competing interests

J.A.T. is a member of the GSK Human Genetics Advisory Board. E.B.F. is a full time employee of and shareholder in Pfizer, Inc. E.P. was an employee of Biogen at the time of the work. E.P. is now an employee of AstraZeneca.

Figures

Extended Data Figure 1
Extended Data Figure 2
Extended Data Figure 3
Extended Data Figure 4
Extended Data Figure 5
Extended Data Figure 6
Extended Data Figure 7
Extended Data Figure 8
Figure 1
Figure 1. Open Targets Genetics pipeline schematic.
a, Data sources include all available GWAS, as well as variant effect predictions and functional genomic data. b, A number of pipelines are run to perform statistical fine-mapping of GWAS, colocalization with gene expression quantitative trait studies (QTLs) and also between distinct GWAS traits, and integrative “locus-to-gene” prioritization from both genetic and functional genomic input features. c, Outputs of the pipelines are available in a web portal, via programmatic API, and as bulk downloads.
Figure 2
Figure 2. Performance of the locus-to-gene (L2G) model.
Colors show metrics calculated on each individual fold of the 5-fold cross-validation. The overall metric, combining all folds, is shown in dark blue. a, Calibration curve showing (top) the fraction of all GSP genes found as positives at different L2G score thresholds (mean predicted value) and (bottom) the count of genes in each L2G score bin. b,c, The precision-recall curve (b) and the receiver-operator characteristic curve (c) for identifying GSP genes from among those within 500 kb at each locus. d, The Relative Importance of each predictor in the L2G model. Blue vertical bars show the mean importance for each feature in cross-validation, while paler bars show the importance obtained in each fold. The vertical dashed lines show the minimum and maximum mean feature importances. max denotes that the maximum score for any variant in the 95% credible set was used for each gene; average denotes that a score averaged over the 95% credible set, weighted by posterior probability, was used for each gene; nbh (neighbourhood) denotes that scores were calculated for each gene relative to the best scoring gene at the locus. Insets in a-c indicate the chromosomes for which each fold of the data was evaluated in cross-validation, and the average precision (AP) (b) or AUC (c) for that fold.

References

    1. Hindorff LA, et al. Potential etiologic and functional implications of genome-wide association loci for human diseases and traits. Proc Natl Acad Sci U S A. 2009;106:9362–9367. - PMC - PubMed
    1. Altshuler D, Daly MJ, Lander ES. Genetic mapping in human disease. Science. 2008;322:881–888. - PMC - PubMed
    1. Claussnitzer M, et al. FTO obesity variant circuitry and adipocyte browning in humans. N Engl J Med. 2015;373:895–907. - PMC - PubMed
    1. Zhu Z, et al. Integration of summary data from GWAS and eQTL studies predicts complex trait gene targets. Nat Genet. 2016;48:481–487. - PubMed
    1. Brænne I, et al. Prediction of causal candidate genes in coronary artery disease loci. Arterioscler Thromb Vasc Biol. 2015;35:2207–2217. - PMC - PubMed

Publication types