. 2021 Nov;18(11):1377-1385.
doi: 10.1038/s41592-021-01303-3. Epub 2021 Oct 28.

Metabolite discovery through global annotation of untargeted metabolomics data

Affiliations

Metabolite discovery through global annotation of untargeted metabolomics data

Li Chen et al. Nat Methods. 2021 Nov.

Abstract

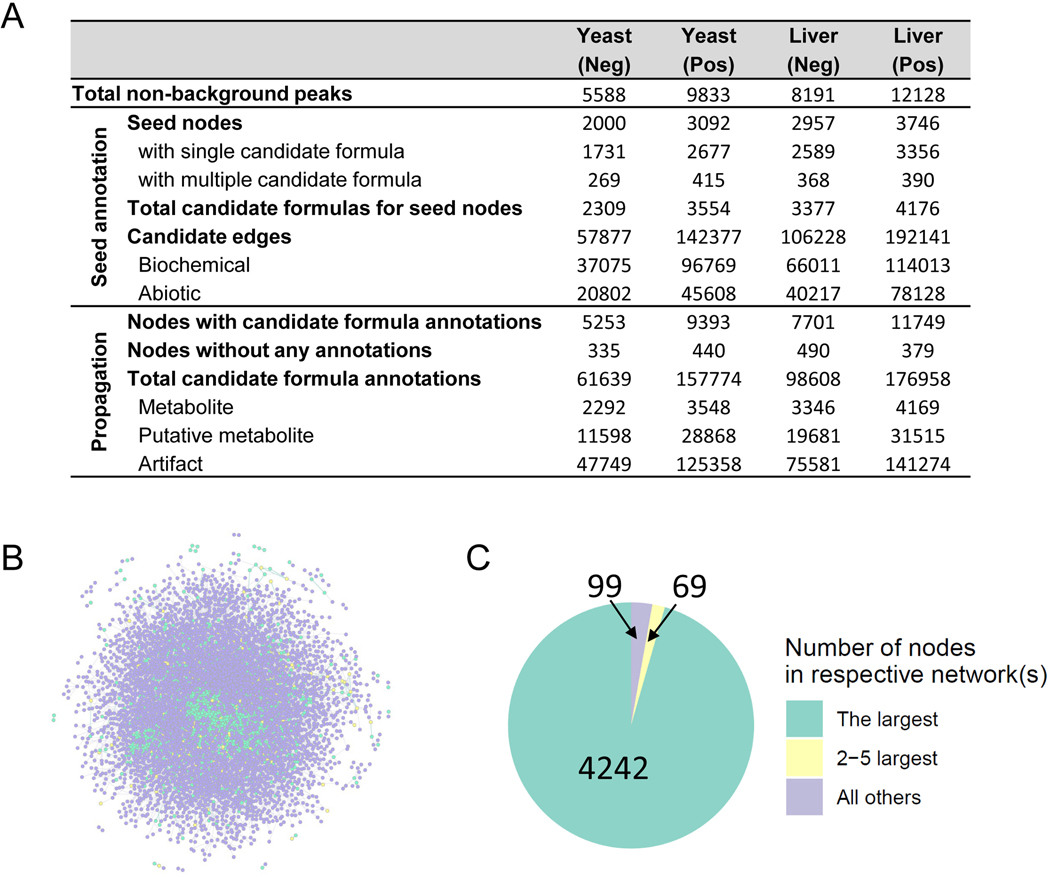
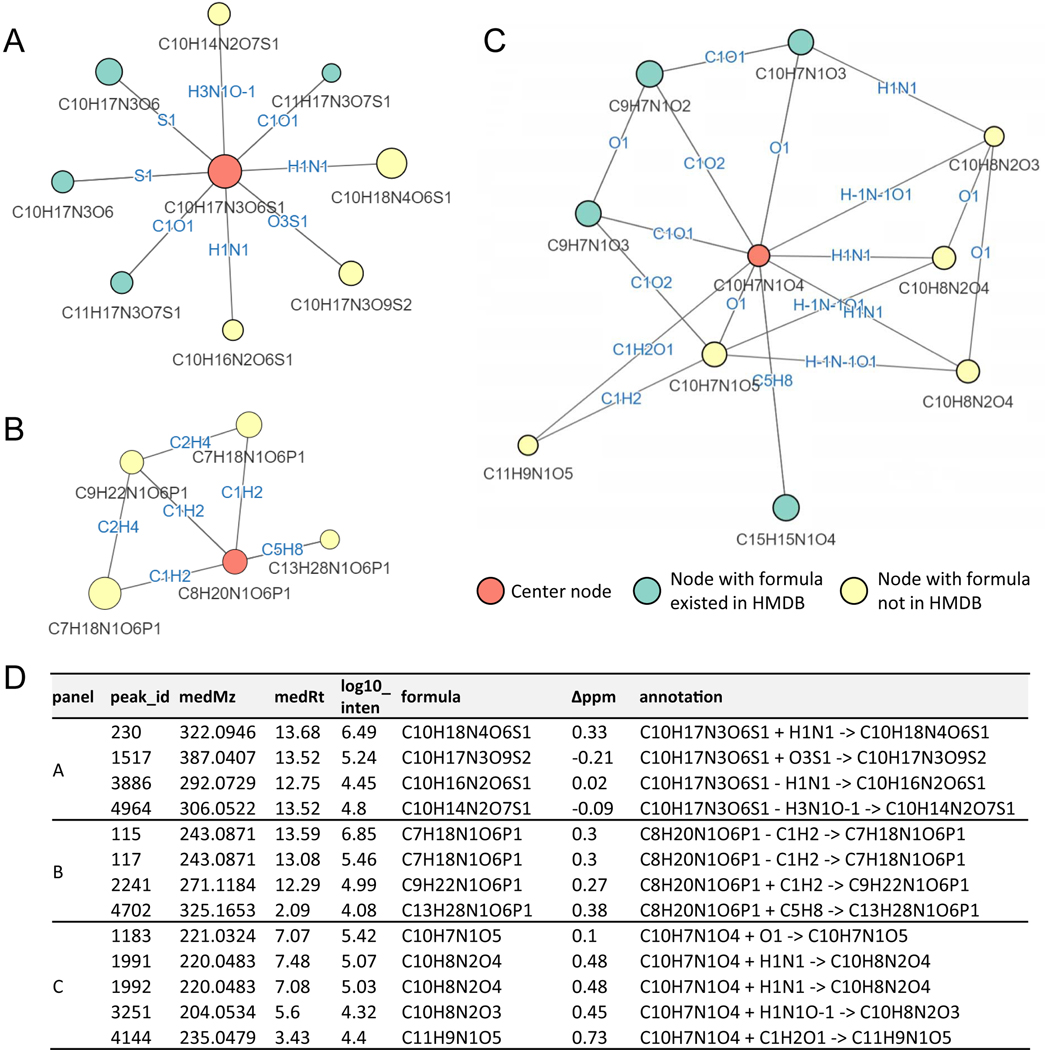
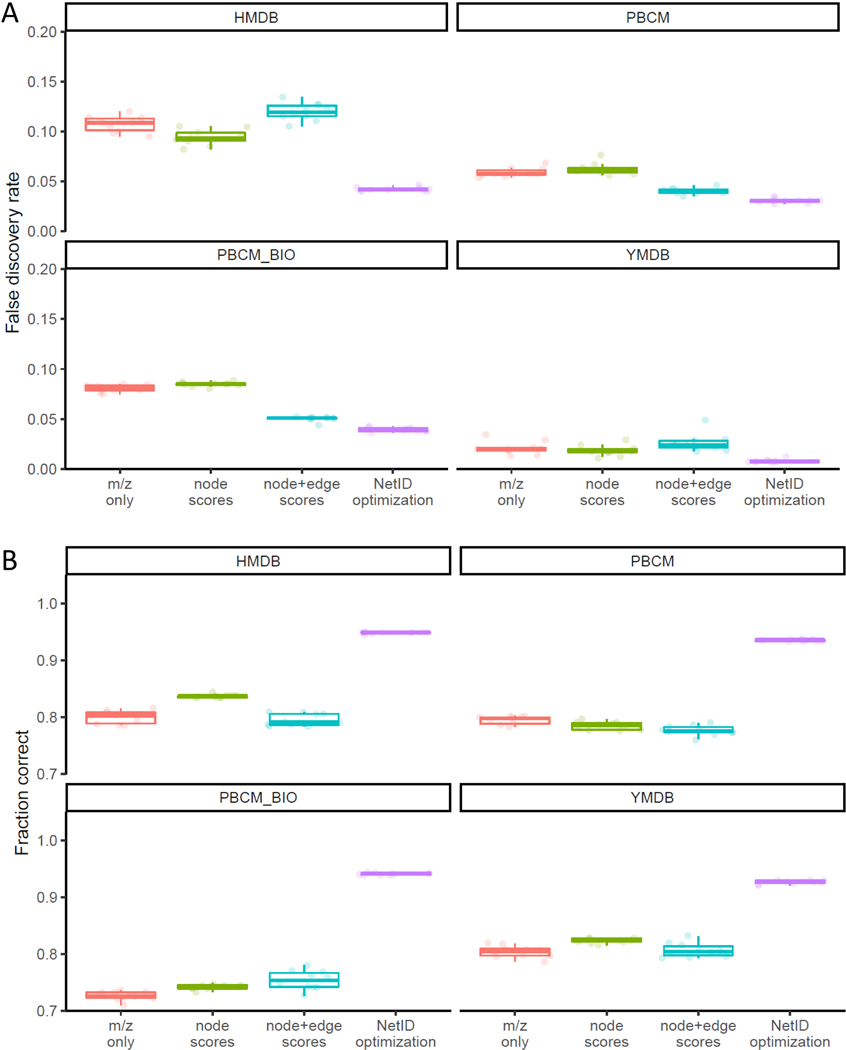
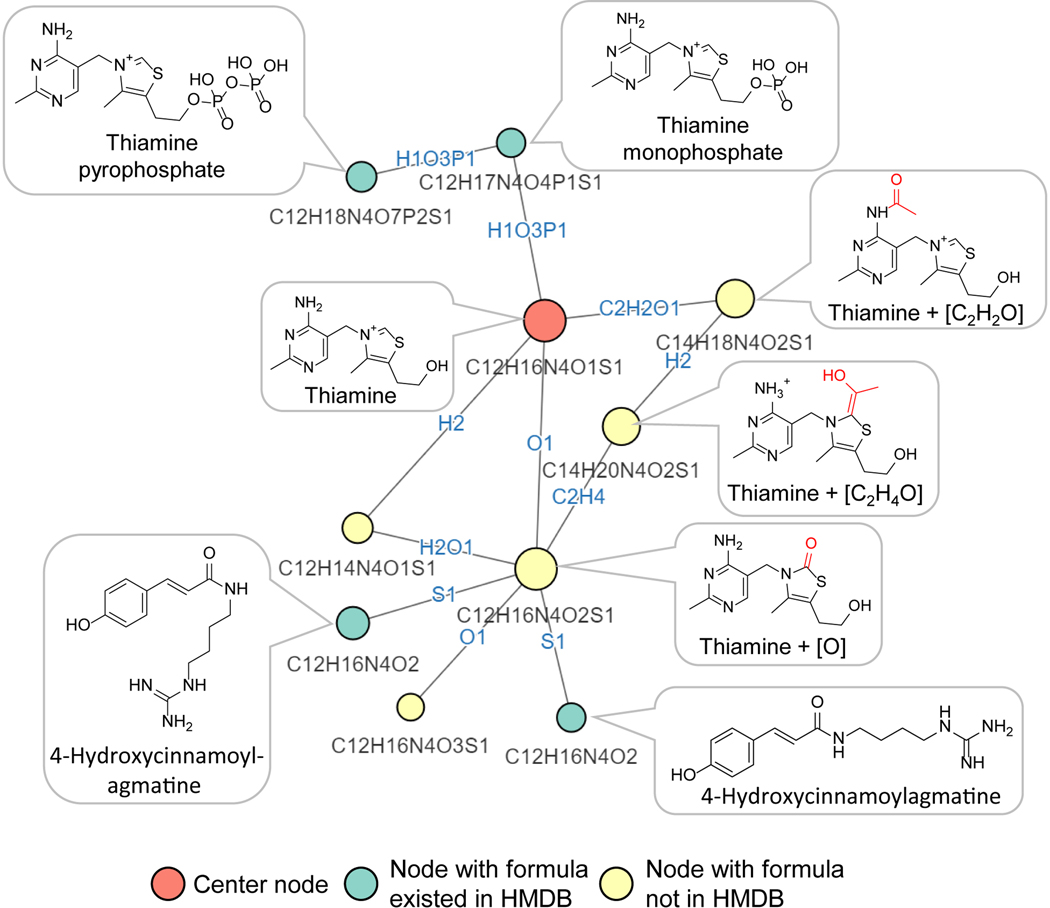
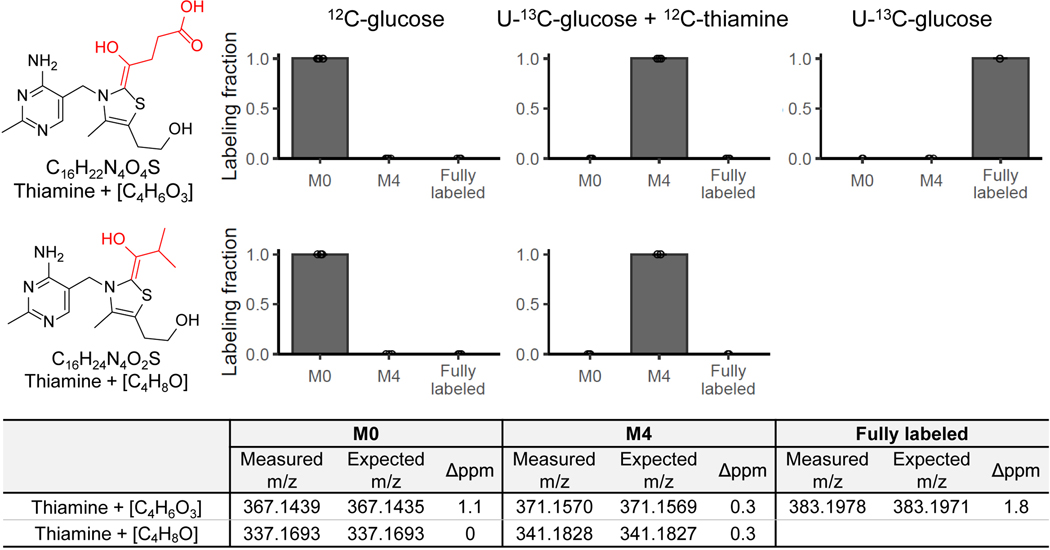
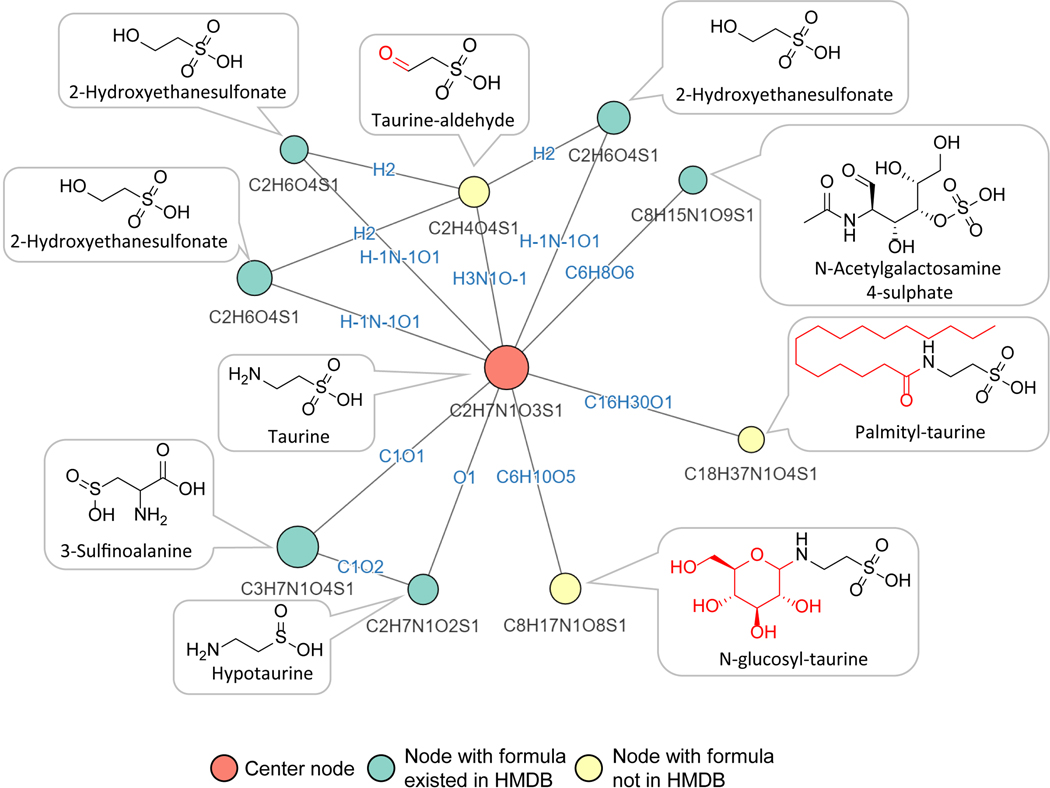
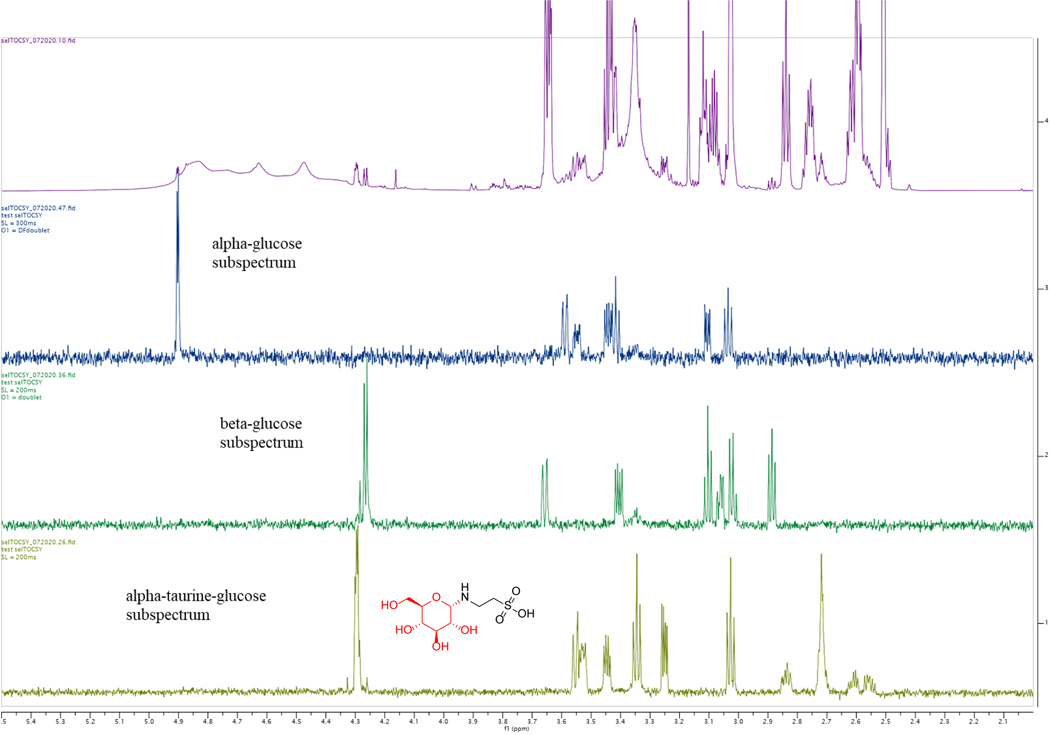
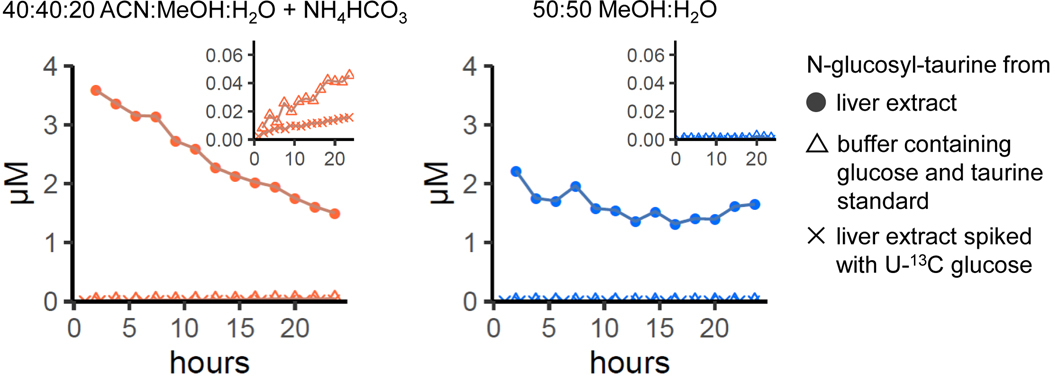
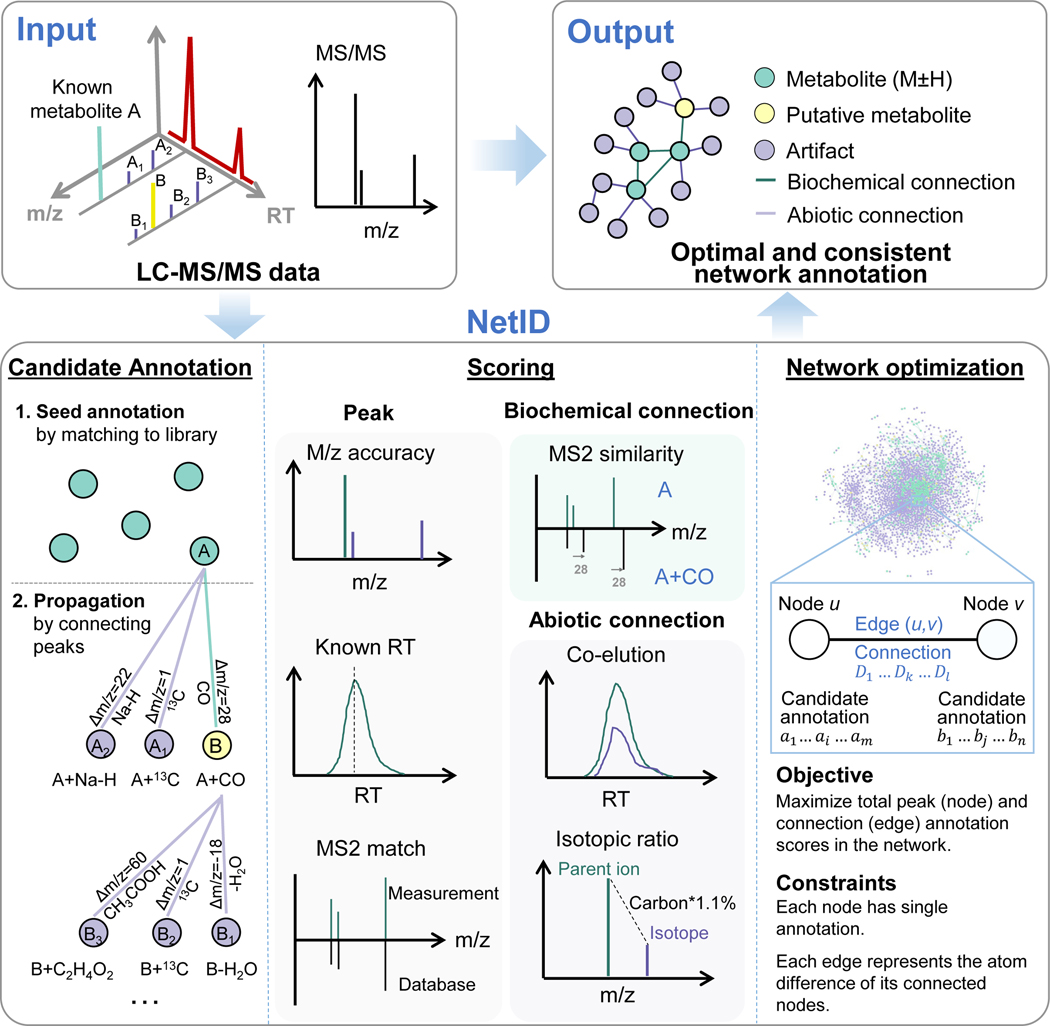
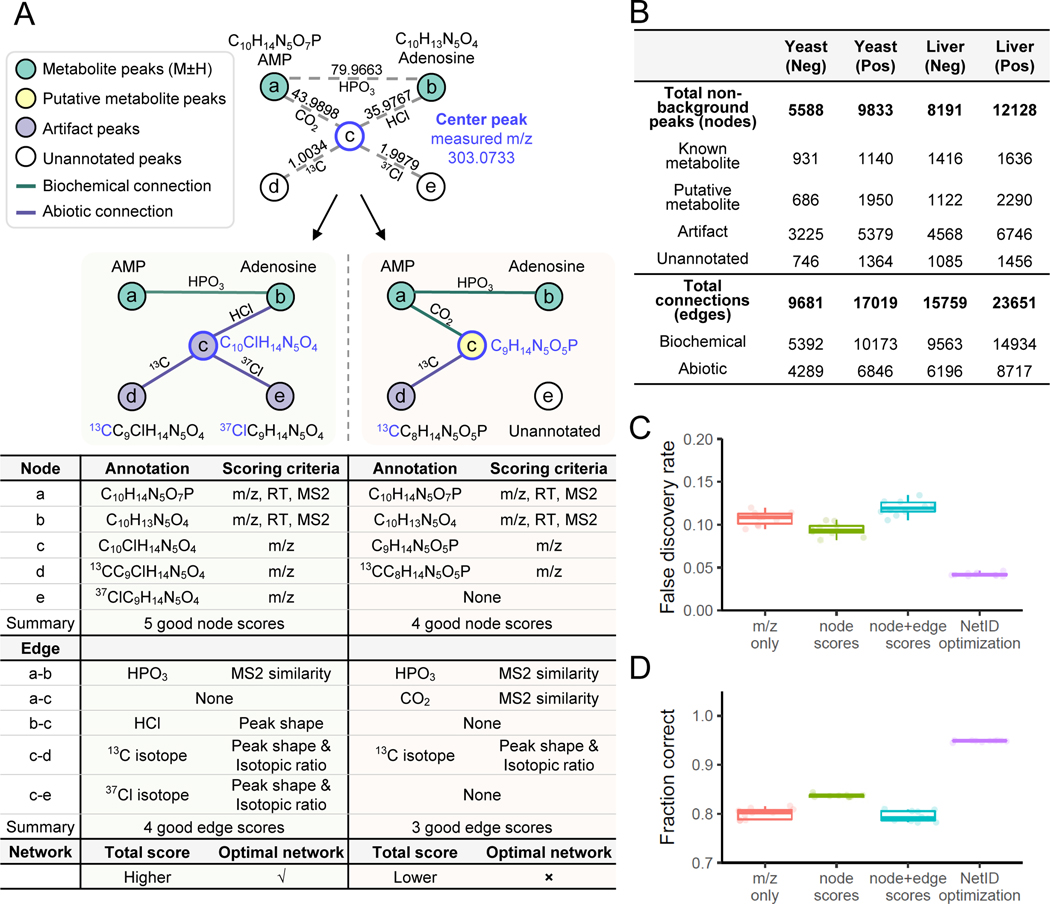
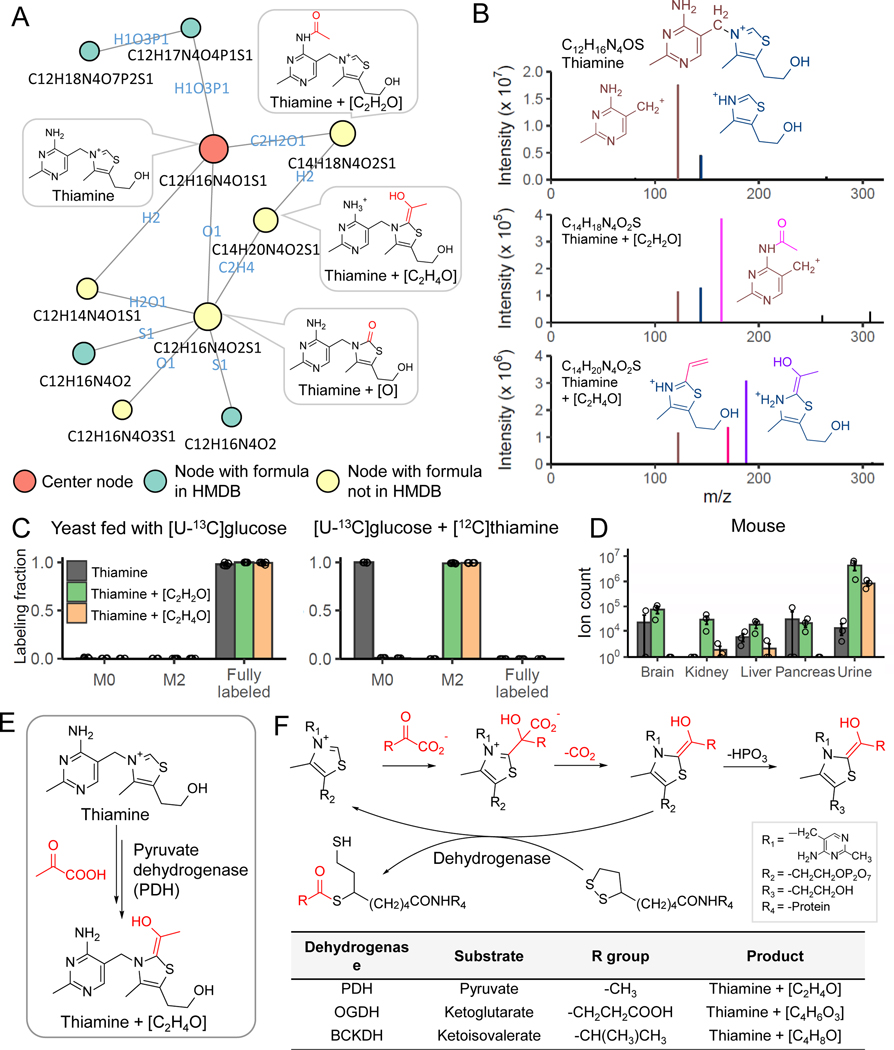
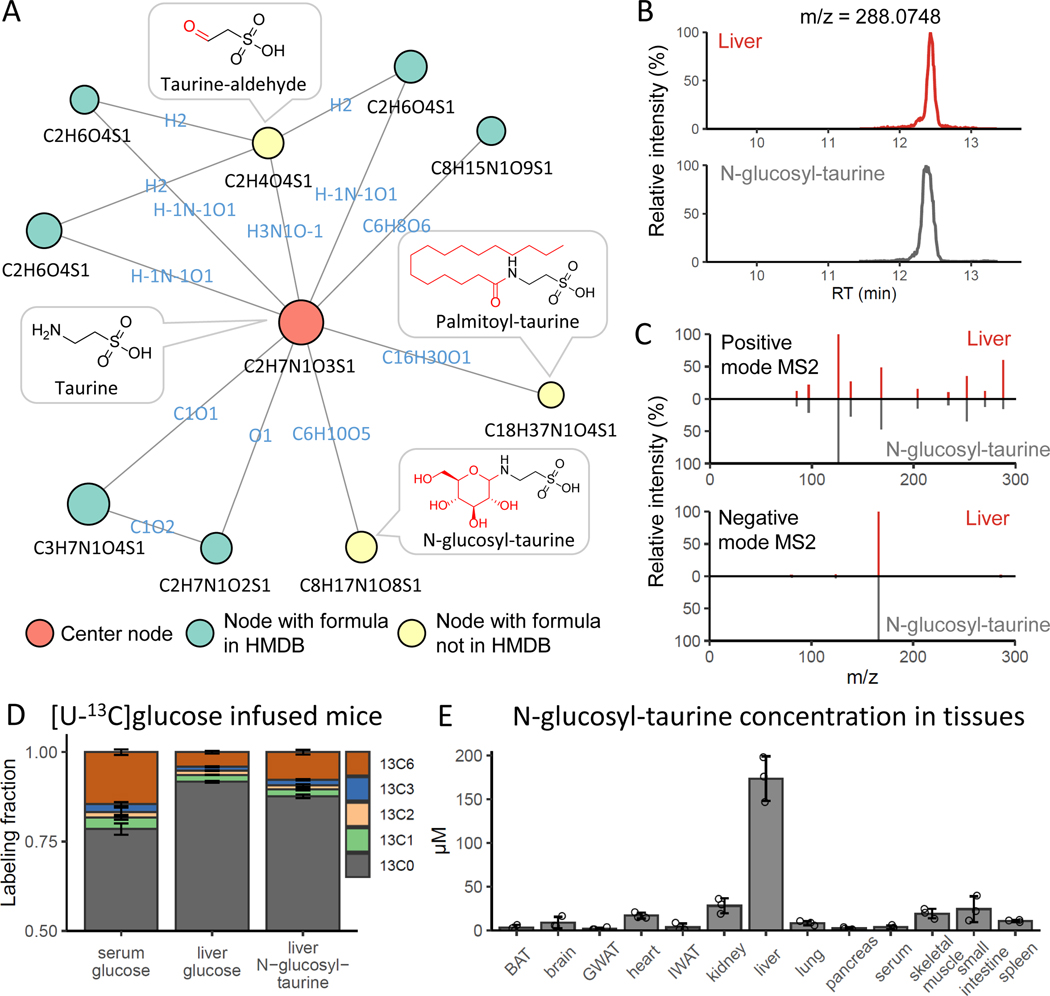
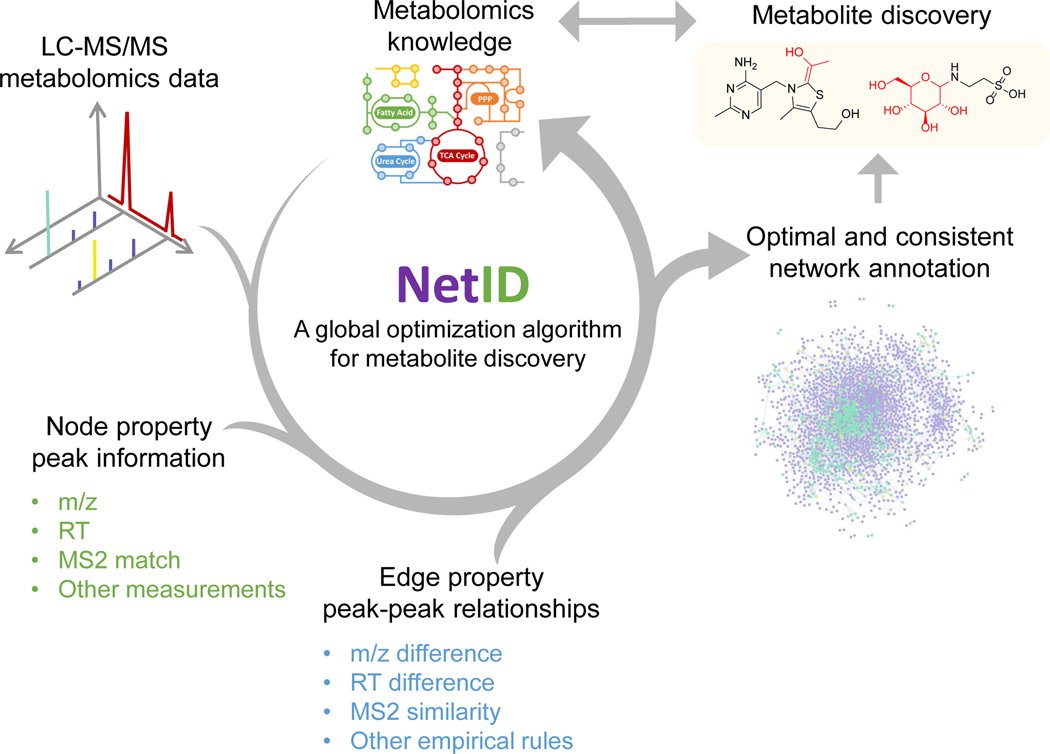
Liquid chromatography-high-resolution mass spectrometry (LC-MS)-based metabolomics aims to identify and quantify all metabolites, but most LC-MS peaks remain unidentified. Here we present a global network optimization approach, NetID, to annotate untargeted LC-MS metabolomics data. The approach aims to generate, for all experimentally observed ion peaks, annotations that match the measured masses, retention times and (when available) tandem mass spectrometry fragmentation patterns. Peaks are connected based on mass differences reflecting adduction, fragmentation, isotopes, or feasible biochemical transformations. Global optimization generates a single network linking most observed ion peaks, enhances peak assignment accuracy, and produces chemically informative peak-peak relationships, including for peaks lacking tandem mass spectrometry spectra. Applying this approach to yeast and mouse data, we identified five previously unrecognized metabolites (thiamine derivatives and N-glucosyl-taurine). Isotope tracer studies indicate active flux through these metabolites. Thus, NetID applies existing metabolomic knowledge and global optimization to substantially improve annotation coverage and accuracy in untargeted metabolomics datasets, facilitating metabolite discovery.


Conflict of interest statement

Competing interests

The authors declare no competing interests.

Figures

Extended Data Fig. 1
Extended Data Fig. 1. Characterization of NetID network
Characterization of NetID network. (A) Summary table of the candidate annotation step in NetID workflow. (B) Visualization of the optimal network obtained from negative mode LC-MS analysis of Baker’s yeast, containing 4851 nodes and 9699 connections. Metabolite and putative metabolite peaks are in green and artifact peaks in purple. (C) Connectivity of NetID network from the yeast negative-mode dataset.
Extended Data Fig. 2
Extended Data Fig. 2. Examples of putative metabolites in yeast negative-mode dataset
Examples of putative metabolites in yeast negative-mode dataset. (A-C) Subnetwork surrounding glutathione (A), glycerophosphocholine (B), and xanthurenic acid (C). (D) Peak properties and annotations for putative metabolites (yellow nodes) in subnetworks (A)-(C).
Extended Data Fig. 3
Extended Data Fig. 3. Evaluation of annotation false discovery rate (FDR) and fraction gold-standard peaks annotated correctly using different reference databases
Evaluation of annotation false discovery rate (FDR) and fraction gold-standard peaks annotated correctly using different reference databases. The four tested reference compound databases are HMDB (human metabolomics database), PBCM (PubChemLite.0.2.0, zenodo.org/record/3611238), PBCM_BIO (a subset of biopathway related entries in PubChemLite.0.2.0) and YMDB (yeast metabolomics database). (A) False discovery rate estimated using target-decoy strategy. (B) Fraction of 314 manually curated “ground truth” annotations made correctly. For A and B, each individual data point (circle) is from a different randomized decoy library. N = 10 randomized libraries were tested for each reference compound database. Boxes show median and IQR and whiskers extend to largest and smallest value no further than ±1.5 × IQR from hinge.
Extended Data Fig. 4
Extended Data Fig. 4. Subnetwork surrounding thiamine with additional known structures
Subnetwork surrounding thiamine with additional known structures. Nodes, connections, and formulae are direct output of NetID. Boxes with structures were manually added.
Extended Data Fig. 5
Extended Data Fig. 5. Evidence for the additional thiamine-derived metabolites
Evidence for the additional thiamine-derived metabolites. Similar to Figure 3, adding unlabeled thiamine to [U-13C]glucose culture media, yeast uptake the unlabeled thiamine, resulting in unlabeled thiamine, M+4 labeled thiamine+[C4H6O3] and thiamine+[C4H8O] species (n=5). The proposed formulae are also supported by m/z measured by high-resolution mass-spectrometry. Bar represents mean values and error bar indicates s.d..
Extended Data Fig. 6
Extended Data Fig. 6. Subnetwork surrounding taurine with additional known structures
Subnetwork surrounding taurine with additional known structures. Nodes, connections, and formulae are direct output of NetID. Boxes with structures were manually added.
Extended Data Fig. 7
Extended Data Fig. 7. SelTOCSY NMR confirmation of the structure of the chemically synthesized N-glucosyl-taurine
SelTOCSY NMR confirmation of the structure of the chemically synthesized N-glucosyl-taurine. The final crude material is a mixture of glucose, taurine, and N-glucosyl-taurine at 5.2% (pink line). Comparing N-glucosyl-taurine (yellow) to alpha- (blue) and beta-glucose (green) NMR experiments indicate that C1 of the glucosyl group connects the amine group of taurine in α-position.
Extended Data Fig. 8
Extended Data Fig. 8. Glucosyl-taurine is a liver metabolite, not ex vivo reaction product
Glucosyl-taurine is a liver metabolite, not ex vivo reaction product. To test for ex vivo production of glucosyl-taurine, liver extract (with or without spiked 55 μM [U-13C]glucose) or extraction buffer (40:40:20 ACN:MeOH:H2O + NH4HCO3 or 50:50 MeOH:H2O) containing pure glucose and taurine were incubated at 5°C for the indicated duration. Metabolites formed by ex vivo reactions typically accumulate upon sample incubation, while glucosyl-taurine does not. Moreover, there is minimal assimilation of [U-13C]glucose into glucosyl-taurine to make M+6 glucosyl-taurine in liver extract, and, while trace glucosyl-taurine can be formed abiotically in acetonitrile:methanol:water at pH = 7, the observed biological quantity is 100-fold greater.
Figure 1.
Figure 1.. A global network optimization approach for untargeted metabolomics data annotation (NetID).
The input data are LC-MS peaks with m/z, retention times, intensities and optional MS2 spectra. The output is a molecular network with peaks (nodes) assigned with unique formulae and connected by edges reflecting atom differences arising either through metabolism (biochemical connection) or mass spectrometry phenomenon (abiotic connection). Peaks are classified as “metabolite” (M+H or M-H peak of formula found in selected metabolomics database, e.g. HMDB), “putative metabolite” (formula not found in database but with biochemical connection to a metabolite), or “artifact” (only abiotic connection to a metabolite). NetID algorithm involves three steps. Candidate annotation first matches peaks to database formulae. These seed annotations are then extended through edges to cover most nodes, with the majority of nodes receiving multiple formula annotations. Each node and edge annotation are then scored based on match to known masses, retention times, and MS/MS fragmentation patterns. Global network optimization maximizes sum of node scores and edge scores, while enforcing a unique formula for each node and a unique transformation relationship for each edge.
Figure 2.
Figure 2.. Utility of global network optimization.
(A) An example network demonstrating the value of the global optimization step in NetID. Node a and node b match database formulae and are connected by an edge of phosphate (HPO3). Node c can be connected to either node a or node b through mutually incompatible annotations, resulting in two different candidate networks. The table below the two candidate networks shows the annotations and scoring criteria for each, with the left network preferred for more good node and edge annotations. (B) Summary table of NetID annotations of negative and positive mode LC-MS data from Baker’s yeast and mouse liver. (C) False discovery rate estimated using target-decoy strategy. Each data point (circle) is from a different randomized decoy library. (D) Fraction of 314 manually curated “ground truth” annotations made correctly. N = 10 randomized libraries were tested for C and D. Boxes show median and IQR and whiskers extend to largest and smallest value no further than ±1.5 × IQR from hinge.
Figure 3.
Figure 3.. NetID reveals thiamine-derived metabolites in yeast.
(A) Subnetwork surrounding thiamine. Nodes, connections, and formulae are direct output of NetID. Boxes with structures were manually added. (B) MS2 spectra of thiamine, thiamine+C2H2O, and thiamine+C2H4O, with proposed structures of the major fragments. (C) Labeling fraction of thiamine and its derivatives, in [U-13C]glucose with and without unlabeled thiamine in the medium (n = 5). (D) The thiamine derivatives are also found in mouse tissues and urine (n=3). (E) Proposed mechanism for formation of thiamine+C2H4O. Pyruvate dehydrogenase (PDH) decarboxylates pyruvate, and adds the resulting [C2H4O] unit (in red) to thiamine. (F) The same enzymatic mechanism occurs in oxoglutarate dehydrogenase (OGDH) and branched-chain α-ketoacid dehydrogenase complex (BCKDC), and generates thiamine+C4H6O3 and thiamine+C4H8O respectively. Bar represents mean values and error bar indicates s.d. in (C) and s.e. in (D).
Figure 4.
Figure 4.. NetID discovers mammalian taurine derivatives.
(A) Subnetwork surrounding taurine from mouse liver extract data. Nodes, connections, and formulae are direct output of NetID. Boxes with structures were manually added. (B) LC-MS chromatogram of N-glucosyl-taurine standard and the putative glucosyl-taurine from liver extract. (C) Top 10 abundant ion peaks in MS2 spectrum of glucosyl-taurine peak from liver extract (top), and synthetic N-glucosyl-taurine standard (bottom). (D) Isotope labeling pattern of putative glucosyl-taurine in mice, infused via jugular vein catheter for 2 h with [U-13C]glucose (n=3). (E) Absolute N-glucosyl-taurine concentration in murine serum and tissues (n=3). Bar represents mean values and error bar indicates s.d. in (D) and s.e. in (E).
Figure 5.
Figure 5.. NetID applies global optimization for metabolomics data annotation and metabolite discovery.

References

    1. DiNardo CD et al. Durable Remissions with Ivosidenib in IDH1-Mutated Relapsed or Refractory AML. N. Engl. J. Med 378, 2386–2398 (2018). - PubMed
    1. Dang L. et al. Cancer-associated IDH1 mutations produce 2-hydroxyglutarate. Nature 462, 739 (2009). - PMC - PubMed
    1. Doroghazi JR et al. A roadmap for natural product discovery based on large-scale genomics and metabolomics. Nature Chemical Biology 10, 963–968 (2014). - PMC - PubMed
    1. Aron AT et al. Reproducible molecular networking of untargeted mass spectrometry data using GNPS. Nature Protocols 15, 1954–1991 (2020). - PubMed
    1. Johnson CH, Ivanisevic J. & Siuzdak G. Metabolomics: beyond biomarkers and towards mechanisms. Nature Reviews Molecular Cell Biology 17, 451–459 (2016). - PMC - PubMed

Methods Reference

    1. Xu Y-F et al. Discovery and Functional Characterization of a Yeast Sugar Alcohol Phosphatase. ACS Chem. Biol 13, 3011–3020 (2018). - PMC - PubMed
    1. Hui S. et al. Glucose feeds the TCA cycle via circulating lactate. Nature 551, 115–118 (2017). - PMC - PubMed
    1. Chambers MC et al. A Cross-platform Toolkit for Mass Spectrometry and Proteomics. Nat Biotechnol 30, 918–920 (2012). - PMC - PubMed
    1. Xing S. et al. Recognizing Contamination Fragment Ions in Liquid Chromatography–Tandem Mass Spectrometry Data. J. Am. Soc. Mass Spectrom jasms.0c00478 (2021) doi:10.1021/jasms.0c00478. - DOI - PubMed
    1. Mitchell JM et al. New methods to identify high peak density artifacts in Fourier transform mass spectra and to mitigate their effects on high-throughput metabolomic data analysis. Metabolomics 14, 125 (2018). - PMC - PubMed

Publication types

LinkOut - more resources